Lobbying for Alpha Cen

Philippe Thebault sent me a link to an article on the Alpha Centauri planet search published earlier this month in the Frankfurter Allgemeine Zeitung. The text is in German, but the Google translator does a passable job of getting the gist across.

I got my first inkling of the Geneva Planet Search’s Alpha Centauri campaign through Lee Billings’ article in Seed Magazine. (See this post). In the Frankfurter Allgemeine article, Francesco Pepe gives further details — Alpha Cen B is one out of ten stars that are receiving special scrutiny for terrestrial planets at HARPS. They are getting one observation every two weeks, meaning that the star is being hit roughly one out of every two of their planet search nights:

“Allerdings müssen wir uns Harps mit anderen Gruppen teilen”, sagt er. Zudem ist Alpha Centauri B nur einer von zehn Sternen, die sie auf erdähnliche Planeten absuchen wollen. “Aber alle zwei Wochen schauen wir damit auf Alpha Centauri, und das Gerät ist sehr effizient.”

This quote implies that my speculations regarding the Geneva team’s data collection rate on Alpha Cen B were somewhat overheated. Instead of getting 100 ultra-high-precision HARPS velocities per year, it looks like a more realistic estimate of their current rate is 25 velocities per year. Since signal-to-noise increases as the root of the number of observations, this means that the minimum mass threshold for Alpha Cen Bb at any given time is approximately doubled relative to my estimates at the beginning of the Summer. Instead of arriving at 2.5 Earth masses in the habitable zone a bit more than a year from now, they’ll be at roughly 5 Earth masses.

Now nobody likes backseat drivers. As the saying goes, “theorists know the way, but they can’t drive”, and theorists have had a particularly dismal record in predicting nearly everything exoplanetary.

But nevertheless, I’m urging a factor-of-four increase to that data rate on Alpha Cen B. I would advocate two fully p-mode averaged velocities per night, 50 nights per year. I know that because Alpha Cen B is so bright, the duty cycle isn’t great. I know that there are a whole panoply of other interesting systems calling for time. It is indeed a gamble, but from the big-picture point of view, there’s a hugely nonlinear payoff in finding a potentially habitable planet around Alpha Centauri in comparison to any other star.

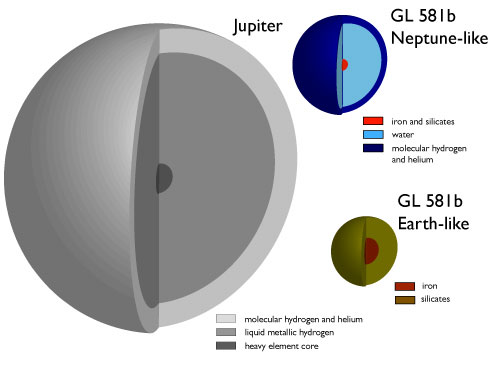
During the next few months, it’s inevitable that one of the numerous Super-Earths that have been turning up in the radial velocity surveys will be announced to be observable in transit (see, e.g. this post). When that occurs, we’ll effectively have had our last first look at a truly new category of planet — the logarithmic mass interval between Earth an Uranus is currently by far the largest among the 70-odd planets that have accurately determined radii. My own guess is that the emerging population of super-Earths will be better described as a population of sub-Neptunes. That is, the transit depths will indicate compositions that are largely water.

So if 5-Earth mass planets turn out to be primarily water-based rather than rock-based, it’s (in my mind) an argument in favor of cranking up the data rate on Alpha Cen B. There were no structurally substantial quantities of water in the Alpha Cen planet-forming environment. If we’re seeing sub-Neptunes rather than super-Earths in the HD 40307, Gliese 581, et al. systems, then the odds are heightened that any planets orbiting Alpha Cen B are less than 2 Earth masses. There’s no payoff in tuning your Alpha Cen B strategy for sub-Neptunes. Finding truly terrestrial-mass planets will require paying full freight.

In the early nineteenth century, the detection of stellar parallax was a problem fully equivalent in both scientific excitement and prestige to the modern-day detection of the first potentially habitable extrasolar planet. I think it’s worth noting that the prize of discovery of the first stellar parallax went not to the eminently capable (but overly cautious and slow-moving) observer who accumulated data on the best star in the sky, but rather to an observer who focused on a rather obscure star in the constellation Cygnus.

Here’s a link to the article, “Thomas Henderson and Alpha Centauri” by Brian Warner of the University of Cape Town.

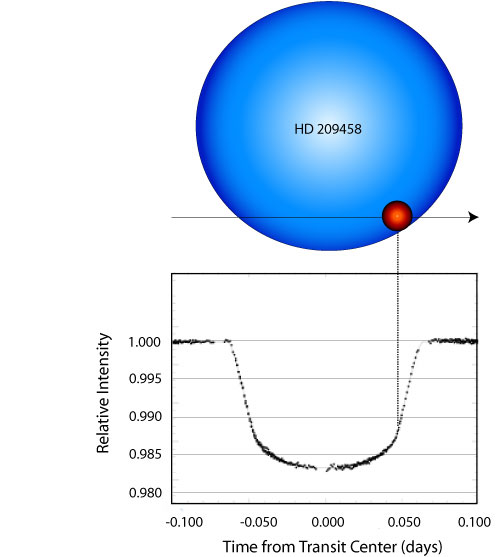
HD209458set on HD 209458b

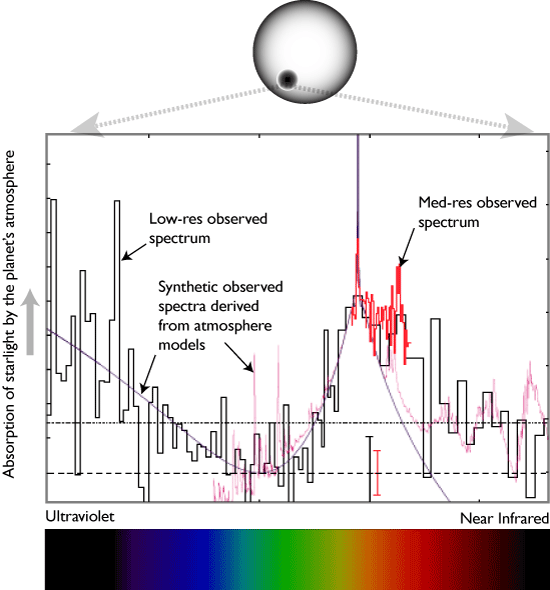
During my visit to the Paris Observatory earlier this summer, Alain Lecavelier showed me the work that he and David Sing and their collaborators have been doing to get a better handle on the atmospheric conditions on HD 209458b. Using the STIS spectrograph on HST, they’ve obtained both medium-resolution and low-resolution visible-wavelength absorption spectra of starlight shining through the atmosphere of the planet as it transits the parent star.

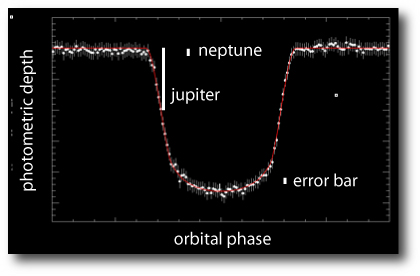
HST is sensitive enough to allow startlingly detailed portraits of “sunsets” that took place back in the mid-1850s. Here’s a reworking of Figure 1 from Sing et al. (2008):

Illustrator-editable .pdf of above with title and source.

Sing et al. manage to do a good job of matching the features in the spectrum. The big absorption spike in the orange is due to the presence of atomic sodium. Their atmospheric models also include Raleigh scattering by hydrogen molecules, a temperature inversion in the atmosphere, condensation of sodium sulfate on the planet’s night side, and the presence of titanium and vanadium oxide in the atmosphere. (Titanium oxide can be invoked to play a big role in modulating the visual appearance of hot Jupiters for much the same reason that it’s used as an opacifier in ordinary paint.)

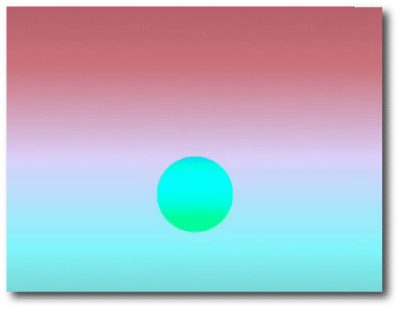
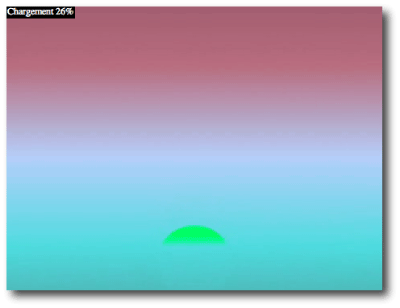
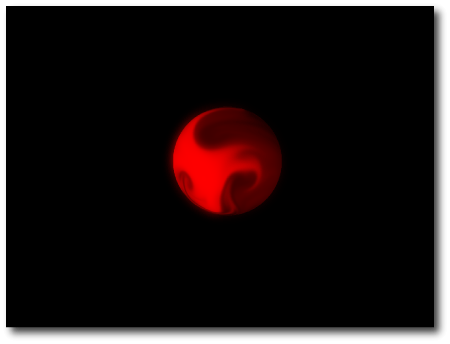
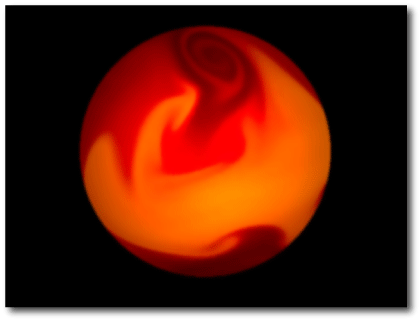
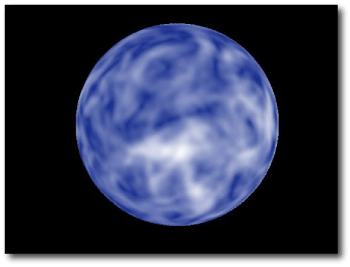
With a detailed atmospheric model in hand, it’s possible to calculate both the color of the sky and the color of HD 209458b at various sight lines through the air column. David and Alain did exactly that, and have made an animation from the perspective of an observer in an asbestos-coated balloon drifting nightward across the terminator. The effect is reminiscent of a Turrell skyspace:


Here’s a link to their French-language press release. According to the inimitable google translator, “star at bedtime absorption is cyan”

Lucky 13

In reviewing grant proposals and observing proposals that seek to study extrasolar planets, one notices that two cliches turn up with alarm-clock regularity. Number one is Rosetta Stone, as in this or that planetary system is a Rosetta Stone that will enable astronomers to obtain a better understanding of the formation and evolution of planetary systems. Number two is ideal laboratory, as in this or that system is an ideal laboratory for studying the processes that guide the formation and evolution of planetary systems.

A terse unsolicited e-mail from Gaspar Bakos always means that a big discovery is in the offing, and today was no exception:

Hello Greg,

You may like this.
http://xxx.lanl.gov/abs/0907.3525

Best wishes
Gaspar

Indeed! HAT-P-13b and c constitute a really exciting discovery. For a number of reasons, this system is a Rosetta Stone among extrasolar planets, and in large part, this is because the system is an ideal laboratory for studying processes such as tidal dissipation and orbital evolution.

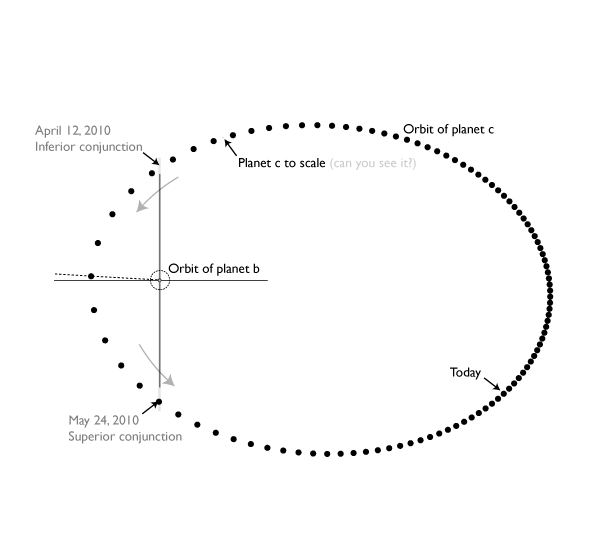
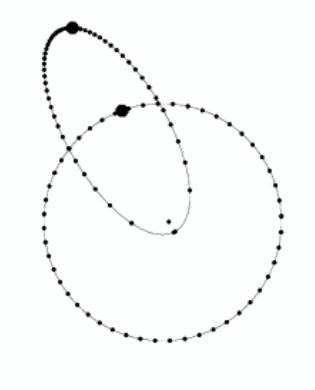
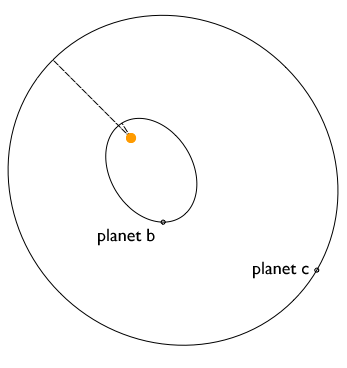
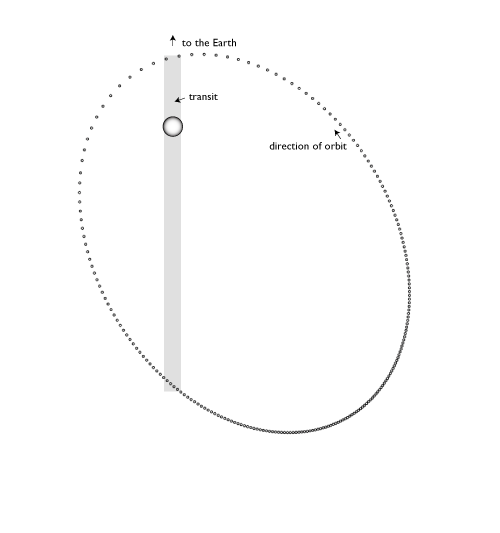
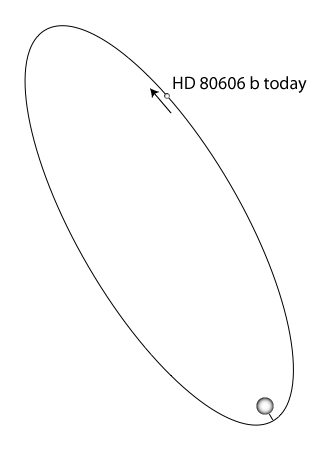
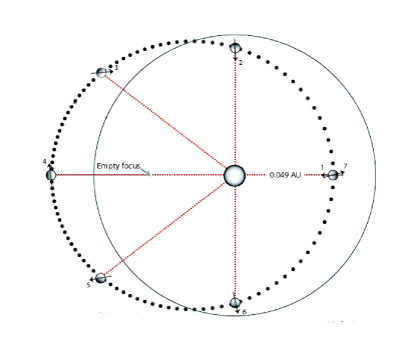
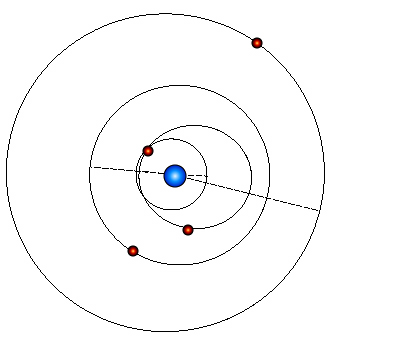
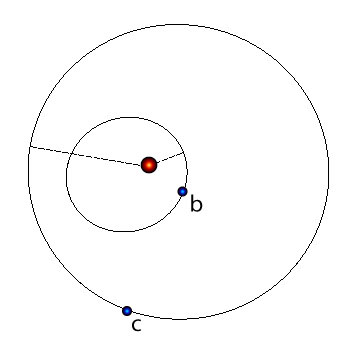
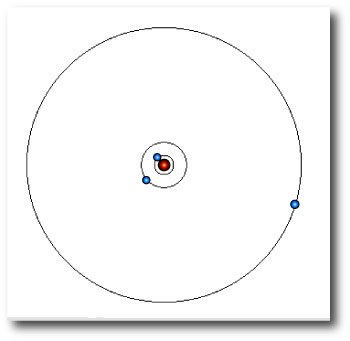
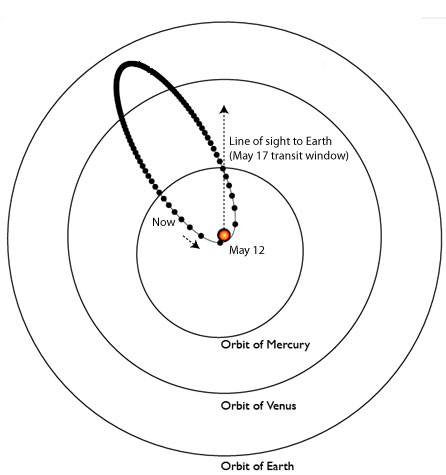
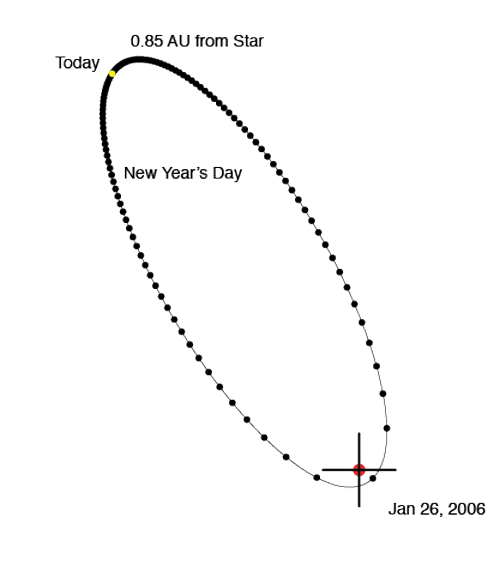
HAT-P-13 harbors the first transiting planet that has a well-characterized companion planet. In this case, the outer companion has a P=428 day orbit, an Msin(i) of 15 Jupiter masses, and an eccentricity, e=0.7. In the following diagram, the orbits and the star are shown to scale; the small filled circles that delineate the outer orbit show the position of the outer planet at 4.28 day intervals.

Illustrator-editable PDF of the above

Of obvious interest is the question of whether planet c can be observed in transit. The a-priori probability is seemingly enhanced by the transit of the inner planet. (Give that one to the good Reverend Bayes). The next opporunity rolls around in April 2010, with the opportunity to observe secondary transit following a bit more than two months later.

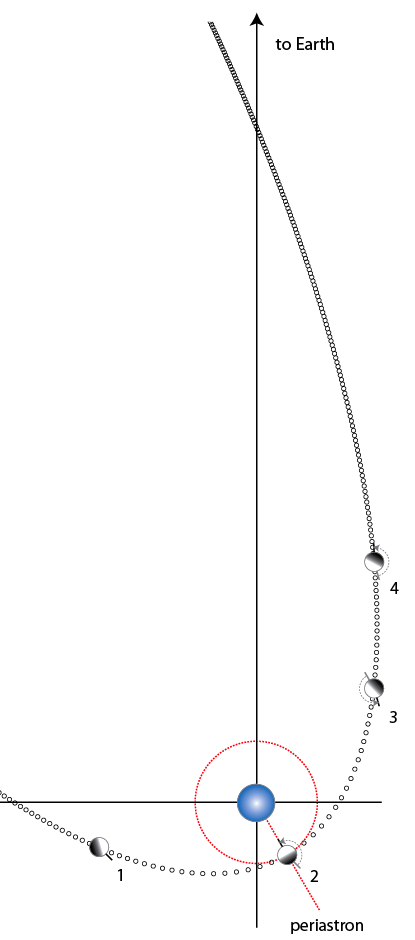
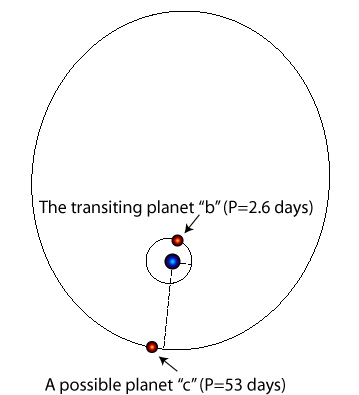
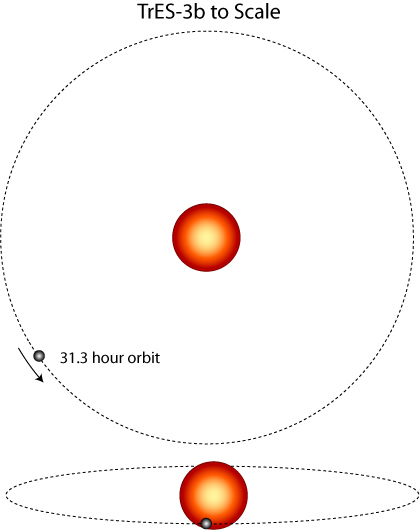
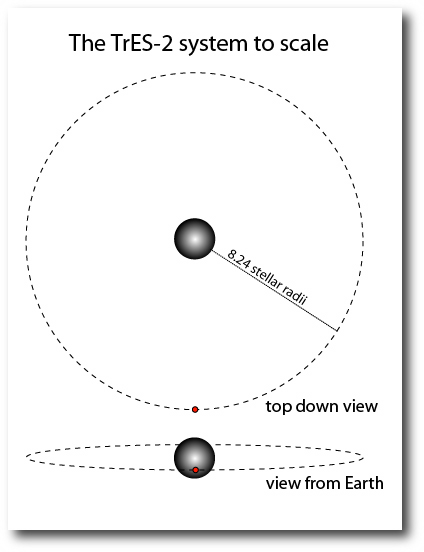
It’ll be quite something if planet “c” does transit. A sense of the wide open spaces in the system can be obtained by plotting the star and the two planets to scale with their respective separations at the moment of inferior conjunction. Given the width restriction of the blog post format, one needs to present this plot vertically:

There’s a lot more to say about the HAT-P-13 system — so much in fact, that Peter Bodenheimer, Konstantin Batygin and I are furiously writing an ApJ letter. Should have it out the door in a day or so, with a roundup to follow here on oklo.org immediately thereafter…

Upgrade

oklo.org is heading into its fifth year, and we’ve just hit something of a milestone: this is the 300th post. A great deal has been learned about extrasolar planets in the past half-decade, and I’ve found that participative reporting has been a great way to keep up with, and even, sometimes, to influence the course of events.

We’ve also just hit another big milestone with the release of the Systemic Console Paper. Our manuscript has just been accepted for publication in the peer-reviewed journal Publications of the Astronomical Society of the Pacific, and the article is now available on astro-ph.

In coming posts, we’ll be highlighting the many new features of the console, and we’ll be updating the now badly-out-of-date tutorials. If you are interested, then by all means download the latest “cutting edge” version, which is available on Stefano’s website.

And finally, if you use the console, and find it useful, please consider citing Meschiari et al. 2009 in your publications.

Forward

Earth occulting the Sun, seen from Apollo 12 (source).

The year 1995 fades into increasingly ancient history, but I vividly remember the excitement surrounding Mayor and Queloz’s Nature article describing the discovery of 51 Peg b. Back in the day, the idea of a Jovian planet roasting in a 4.2-day orbit was outlandish to the edge of credibility.

In the five years following the Mayor-Queloz paper, four additional Doppler-wobble planets with periods less than a week (Ups And b, Tau Boo b, HD 187123b, and HD 75289b) were announced. Each one orbited close enough to its parent star to have a significant a-priori probability of transiting, and by mid-1999, the summed expectation for the number of transiting planets grew to N=0.68. Each new planet-bearing star was monitored for transits, and each star came up flat. Non-planet explanations for the radial velocity variations gained credence. The “planets” were due to stellar oscillations. The “planets” were actually mostly brown dwarfs or low-mass stars on orbits lying almost in the plane of the sky.

The discovery of HD 209458b, the first transiting extrasolar planets was therefore a huge deal. Instantly, the hot Jupiters gained true planetary status. There’s a huge leap from a mass-times-a-sine-of-an-inclination to density, temperature, composition, weather. 209458 was the moment when the study of alien solar systems kicked into high gear.

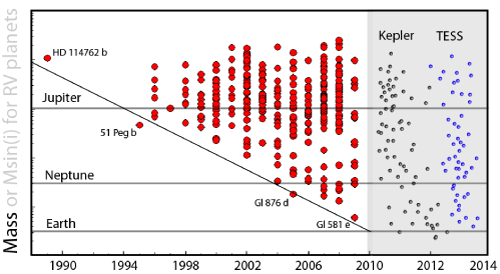
At the moment, we’re within a year of getting news of the first Earth-mass planet orbiting a solar-type star. It’s effectively a coin flip whether the announcement will come from Kepler or from the radial velocity surveys. In either case, the first Earth will likely be too hot for habitability, but within a few years we’ll be seeing genuinely habitable, multi-million dollar worlds. Kepler, for one, will deliver them in bulk.

Enter the TESS mission.

Here’s the scoop: The TESS satellite consists of six wide-field cameras placed on a satellite in low-Earth orbit. If it’s selected, then during its two-year mission, it will monitor the 2.5 million brightest stars with a per-point accuracy of 0.1 millimagnitude (one part in ten thousand) for the brightest, most interesting stars. It will find all of the transiting Jovian and Neptune-mass planets with orbital periods of less than 36 days, and it can make fully characterized detections of transiting planets with periods up to 72 days. Where transits are concerned, brighter stars are better stars. TESS will locate all the bright star transits for Neptune-mass planets and up, and equally important, it will find the best examples of large transiting terrestrial planets that exist.

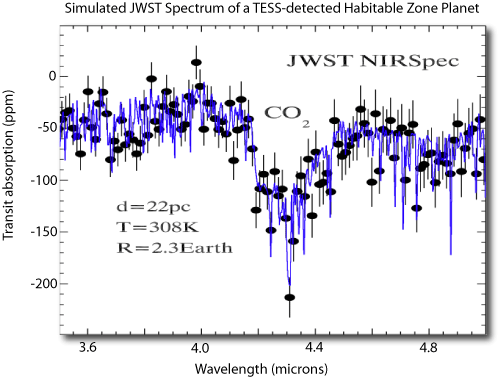
TESS also provides an eminently workable path to the actual characterization of a potentially habitable planet. Included in the 2.5 million brightest stars are a substantial number of M dwarfs. Detailed Monte-Carlo simulations indicate that there’s a 98% probability that TESS will locate a potentially habitable transiting terrestrial planet orbiting a red dwarf lying closer than 50 parsecs. When this planet is found, JWST (which will launch near the end of TESS’s two year mission) can take its spectrum and obtain resolved measurements of molecular absorption in the atmosphere.

If TESS is selected for flight, we’re literally just five years away from probing the atmospheres of transiting planets in the habitable zone.

VB 10b

An interesting discovery announcement came across the wire on Friday. In an article to be published in the Astrophysical Journal, Steven Prado and Stuart Shaklan of JPL write up their detection of a ~6 Jupiter mass companion orbiting the nearby ultra-low-mass red dwarf VB 10. Their discovery was made astrometrically, using a modern CCD camera attached to the venerable Palomar 200-inch telescope. JPL put out a press release to go along with the article.

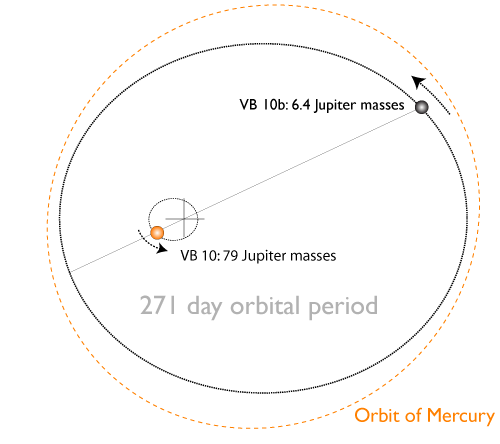
VB 10 contains about 78 Jupiter masses, just barely lifting it above the minimum mass required to qualify as a bona-fide hydrogen-burning main sequence star. It’s got roughly ten times the mass and ten times the density of its companion. In the center-of-mass frame, the system configuration looks like this, where I’m taking a guess at the unknown eccentricity:

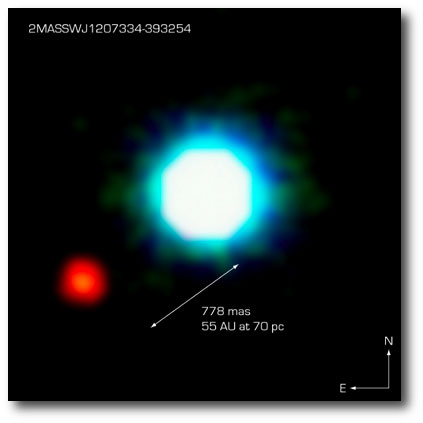
I wouldn’t call VB 10b a planet in the usual sense. With a mass of order one-tenth that of its parent star, it’s almost certainly straggling in at the very bottom of the stellar initial mass function. It’s a low-mass brown dwarf impinging into the “planet desert” from above. Gravitational instabilities tend to crop up if a protostellar disk exceeds 10% the mass of its central star, so the VB 10 system probably formed via the fragmentation process that leads to binary stars rather than via the core accretion mechanism that seems to be responsible for the majority of Jovian planets. Presumably, a similar fragmentation-based process had a hand in the formation of 2M1207, in which a ~4 Jupiter-mass secondary orbits a ~25 Jupiter-mass primary:

Planet Orbiting a Brown Dwarf

Photo credit: ESO (VLT/NACO)

At a distance of only 19 light years, VB 10 is (relatively speaking) just right next door. In tandem with its wide binary companion Wolf 1055, it currently ranks as the 68th-nearest known stellar system. That one need not travel far afield to find VB 10b means that objects like VB 10b are probably common in orbit around the most dimunitive red dwarfs.

As instrumentation improves, it’ll eventually become possible to survey the satellite systems of objects like VB 10b. In our solar system, Jupiter, Saturn and Uranus all have roughly 2×10⁻⁴ of their primary mass locked up in satellites. I’m guessing that this rule of thumb will continue to hold when exomoons start getting detected, but I bet that it won’t hold true for objects that formed via fragmentation.

The VB 10 system is built to last. The primary will enjoy a main-sequence lifetime of close to ten trillion years, during which time the Milky Way-M31 merger remnant will become increasingly isolated from all the other mass that makes up the currently observable universe. Tidal evolution will gradually tighten up the orbit of VB 10b, meaning that the binary will quite possibly survive and harden further during quadrillions of years of encounters with passing degenerates. Barring other catastrophes, gravitational radiation will eventually bring VB 10 and VB 10b together into merger. That shot of good pure H will revive the dead helium remnant of VB 10, causing it to shine for a further hundred billion years or so.

0.5 millimag

It’s a struggle to stay afloat in the non-stop flow of results. As a case in point, the Mayor et al. discovery preprint for HD 40307 b, c, and d has already been up on astro-ph for several weeks, and I only just a chance to read it carefully. The paper spells out the details of the announcement made at the Nantes conference last month, and ends with some bromides that seem to telegraph that the photometric transit search for planets b, c, and d is not yet definitive:

One of the most exciting possibilities offered by this large emerging population of low-mass planets with short orbital periods is the related high probability to have transiting super Earths among the candidates. If detected and targeted for complementary observations, these transiting super-Earths would bring a tremendous contribution to the study of the expected diversity of the structure of low-mass planets.

No controversy in that paragraph. It’ll be undeniably dope when the super-Earths start materializing in transit. Given that population of hot sub Neptunes in our Galaxy is apparently more than five times larger than the human population, it’s also likely that a significant number of these planets transit bright stars, and that’s good news for JWST.

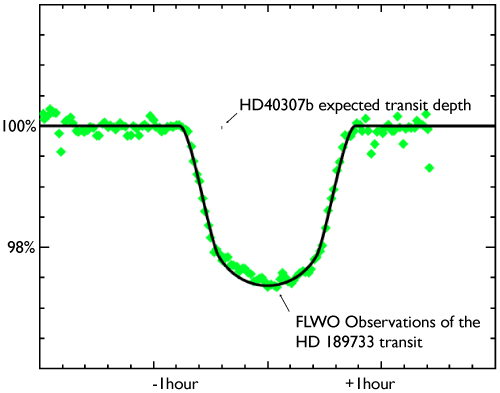
In the interim, it’s not hard to see why the jury is still out on transits for HD 40307 b,c, and d. With its period of 4.61 days, the ~4 Earth-mass HD 40307b has a healthy a-priori transit probability of ~7%. Its expected transit depth, however, is a meager 0.05%. So far, the shallowest known transit for an extrasolar planet is that of HD 149026 b, which, at 0.3%, is fully six times deeper.

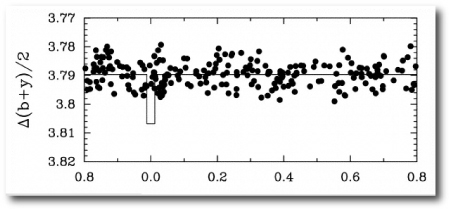
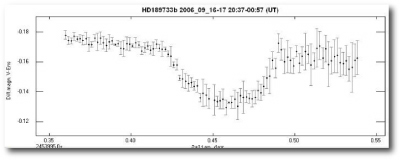
A ground-based detection of transits by HD 40307b would be quite a coup indeed. Is it feasible?The parent star HD 40307 is a K dwarf that’s quite similar in both spectral type and apparent magnitude to HD 189733. We can thus draw on the HD 189733 transits to get a ball park idea of the quality of the photometric data that one might expect from HD 40307. The best published ground-based light curve for HD 189733 that I could find comes from Bakos et al. (2008), who used the FLWO 1.2m telescope in Arizona to get the time series that I’ve reproduced just below. The skimpy expected depth of a central transit by HD 40307b is shown for comparison. The situation looks daunting.

The out-of-transit data in this light curve has a reported RMS scatter of 2.6 mmag for photometric points taken every 17 seconds (binned data is shown in the figure). Naive statistics thus imply that a 0.5 mmag central transit by HD 40307b could be detected by the FLWO 1.2m with at least several sigma confidence. Life, however, is more than root N. Systematic errors are probably large enough to scotch a discovery on a single night of observation, but nevertheless, by repeatedly observing, either with multiple nights or with multiple telescopes, a detection seems within reach. And it’s worth in excess of USD 5M. (At the moment, it seems there’s little need for European or Asian observers to hedge their currency risk.)

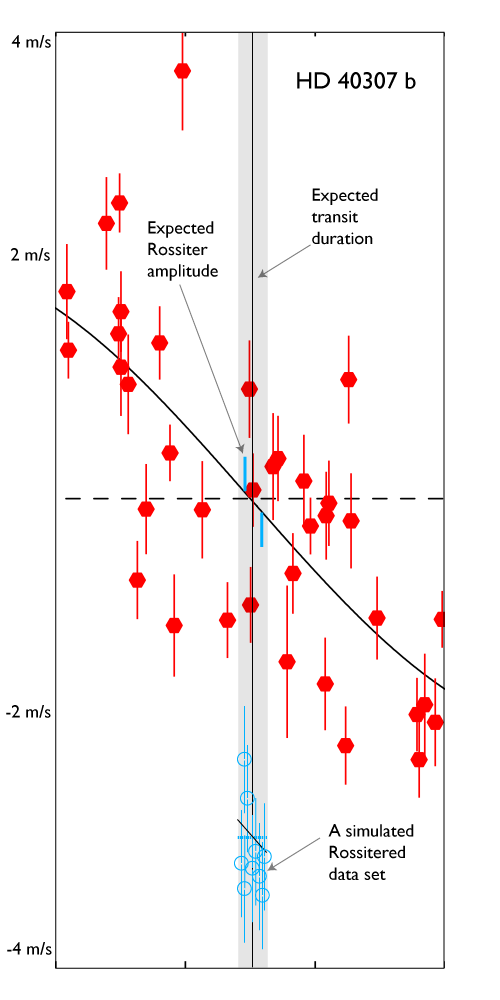
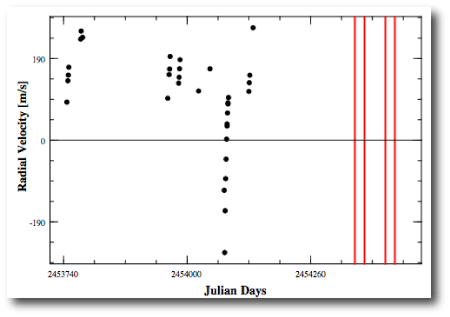
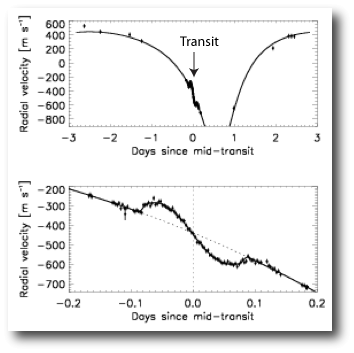
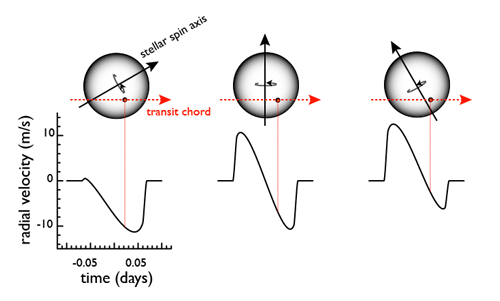
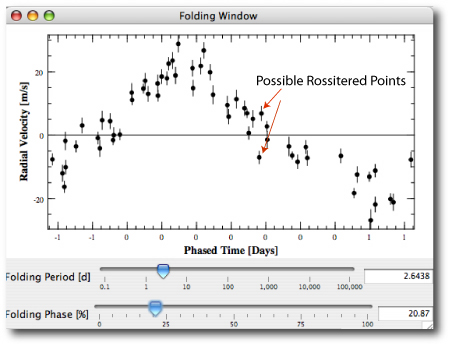
In the event that photometric campaigns aren’t up to the task, it’s in the realm of possibility that a transit by HD 40307b could be extracted via a spectroscopic detection of the Rossiter-McLaughlin effect. Assuming a 1 km/sec rotational velocity for the star, the expected half-amplitude of the Rossiter distortion is similar to the error bars on the published radial velocities. In the following figure, I’ve dished up a simulated Rossitered data set from HARPS, superimposed (with an offset for clarity) on a blown-up version of the radial velocity plot in the paper. During a single occultation, the radial velocities can produce a ~0.85 sigma detection.

In this case, the economics are a bit steeper, but still viable. At the current dollar-euro exchange rate, I’d estimate that USD 15K is a fair price for a HARPS night. (Forgive all this yak yak about currency — as an American traveling in Europe at the moment, I’m rather shocked to be seeing $6.24 0.7l bottles of water at the airport newstand!). One would need 4 hours, or half a night to observe the transit and get adequate baseline. To be at least four-sigma sure, you’d want to rack up ~20 full transits (which would take quite a while). Factoring in the expectation value of 0.07 arising from the transit probability, this works out to a USD ~2M detection.

Superearths

This morning, I awoke to an inbox full of indications that there was indeed plenty of drama in the club.

From one of our correspondents:

He threw out dozens of new systems, very graphically, on slips of paper, like playing cards, floating down on a pile on the screen. Very dramatic. But no HD numbers on those slips!

He predicts 1 to 1.5 Earth sensitivity by around 2010 (extrapolating a trend).

He has been monitoring about 400 FGK slow rotators since 2004, with HARPS.

Can do 0.5 m/s today, 0.1 m/s in near future.

Noise sources are astroseismology, which settles to about 0.1 m/s after 15 minutes of integration, and a worse one, star spots, which settle to about 0.5 m/s after 15 minutes but do not drop lower, even though theory says level should drop to about 0.1 m/s.

He says he has 40 new candidates in the 30-50 day period range, and mass less than 30 Earths.

Nevertheless, after the drama, he did report 3 Neptune-type systems, all focused on the Super Earth theme of the meeting.

The centerpiece was definitely HD 40307, a deep southern K2.5 V star only 40 light years distant, with a metallicity roughly half that of the Sun. It has three detected planets, with Msin(i)’s of 4.2, 6.9, and 9.2 Earth masses, and corresponding periods of 4.31, 9.62, and 20.45 days. It’s fascinating that these planets are close to, but aren’t actually in a 4:2:1 resonance. This is really a remarkable detection.

With 40 candidates in the pocket, the Geneva team does, however, seem to be keeping some of their powder dry, perhaps in anticipation of a low-mass transit. Here’s a link to the ESO press release, which has triggered 93 news articles and counting.

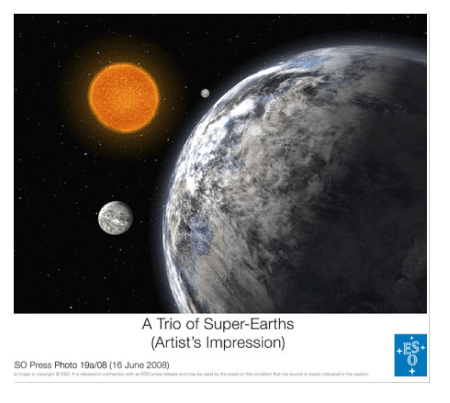
In the press release image, HD 40307d is definitely all that and a bag of chips. Puffy white clouds, azure seas, continents, soft off-stage lighting…

There’s plenty of room at the bottom

On December 29th 1959 at the annual meeting of the American Physical Society at Caltech, Richard Feynman gave a remarkable talk entitled “There’s plenty of room at the bottom” in which he foresaw the impact that nanotechnology could have on materials science. At the beginning of the lecture he remarked (in a vernacular that dates him to the Eisenhower era):

I imagine experimental physicists must often look with envy at men like Kamerlingh Onnes, who discovered a field like low temperature, which seems to be bottomless and in which one can go down and down. Such a man is then a leader and has some temporary monopoly in a scientific adventure.

Over the past several years, the oklo.org party line has been that the radial velocity method for exoplanet detection is similarly equipped with the potential to go down and down in planet mass, and to continue with at least a respectable share of the lead in the ongoing scientific adventure.

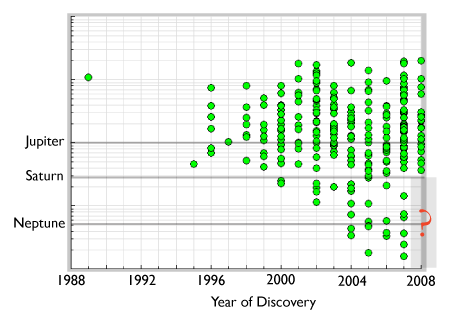
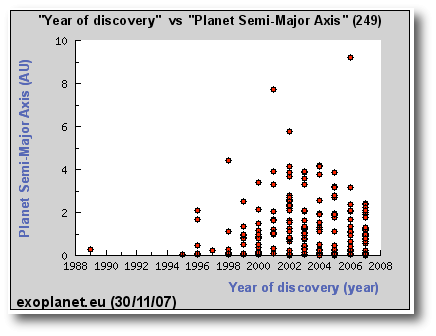
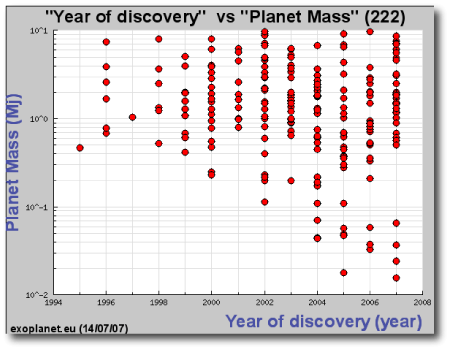
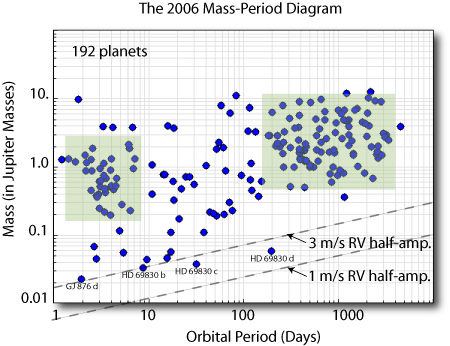
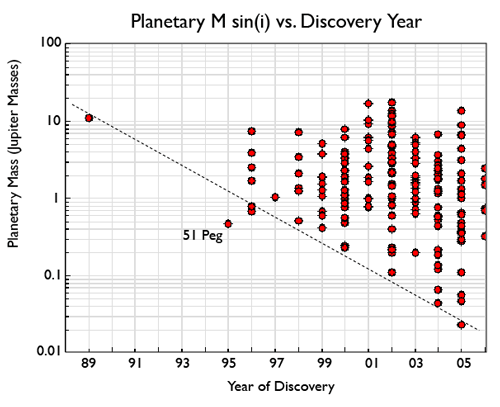
That said, the Doppler returns so far this year have been underwhelming. If we look at the latest planet-mass vs year of discovery diagram on exoplanet.eu (no pulsar planets, no microlenses), the detection rate seems to be holding up, but the crop of announced low-mass planets is nonexistent. Of the 22 new planets so far in ’08 that have been detected via radial velocity, 16 were initially detected by the transit surveys.

What’s up with that?

We’re seeing core accretion in action. The baseline prediction of the core accretion theory for giant planet formation is that once a planet reaches a crossover threshold, where the mass of gas and solids is equal, then rapid gas accretion ensues, and the planet grows very rapidly to Jovian size or even larger. When the galactic planetary census is complete, one thus expects a relative dearth of planets with masses in the range between ~20 and ~100 Earth masses. In the freewheelingly unrefereed forum of a blog post, I can go ahead and dispense with an analysis that takes all the thorny completion issues and selection biases into account and state unequivocally that:

(Courtesy as usual of the exoplanet.eu statistics plot generators)

Planets that do make the grade and blow up to truly Jovian size are the beneficiaries of protostellar disks that had solid surface densities that were well above the average. At a given disk mass, a disk with a higher metallicity has a higher surface density of solids, which is the reason for the planet-metallicity correlation. Disks with higher oxygen and silicon fractions relative to iron will also have high solid surface densities, which is the reason for the planet-silicon correlation. And M stars have trouble putting their Jovian cores together fast enough to get the gas while it’s still there, which is the source of the planet-stellar mass correlation.

As one pushes below Neptune-mass, these correlations should all get much weaker, and the fraction of producing stars should go way up. It’s hard, at the ~10% success rate level for a protostellar disk, to make a Jupiter, and it should be straightforward, at (I’ll guess) the 50% success level for a protostellar disk to make a Neptune.

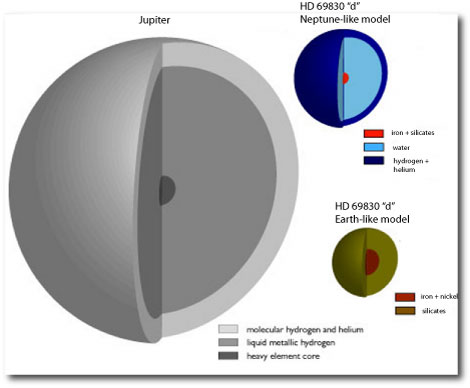
The gap between Neptune and Saturn is the source of the current RV planet drought. At given velocity precision (in the absence of stellar jitter), it takes ~25x more velocities to detect a Neptune than to detect a Saturn. To make progress, it’s necessary to stop down the number of stars in the survey and focus on as many old, quiet K-type stars as possible. We’re talking HD 69830.

The indications at Harvard were that the Geneva group has been doing just that. In a few hours, Michel Mayor is scheduled to give the lead-off talk at the Nantes meeting on extrasolar super Earths. I’ll post a rundown of what he has to say just as soon as the Oklo foreign correspondents file their reports…

Worlds worlds worlds

On Friday, I flew back from the Boston IAU meeting, still buzzing with excitement. On Saturday, I woke up with what might best be described as a transit-induced hangover (an entirely distinct condition from transit fever). I’d basically allowed all my professorial responsibilities to slide for a week. On my desk is a mountain of work, a preliminary exam to assemble, and a horrifying backlog of e-mail.

Ahh, but like an exotic sports car bought on credit, it was worth it. The meeting was amazing, certainly the most exciting conference that I’ve ever attended. Big ups to the organizers! Planetary transits are no longer the big deal of the future. They’re the big deal of the right here right now. Spitzer, Epoxi, MOST, HST and CoRoT are firing on all cylinders. The ground-based surveys are delivering bizarre worlds by the dozen. And we’re clearly in the midst of very rapid improvement of our understanding of the atmospheres and interiors of the planets that are being discovered.

From a long-term perspective, the conference’s biggest news was probably provided by the Geneva group, in the form of Christophe Lovis’ presentation on Tuesday afternoon. In his 15-minute talk to a packed auditorium, Lovis covered a lot of ground. I scrambled to take notes. My reconstructed summary (hopefully without major errors) runs like this:

The HARPS planet survey of solar-type stars contains ~400 non-active, slowly rotating FGK dwarfs. Observations with the 3.6-meter telescope have been ongoing since 2004, and over time, their emphasis has been progressively narrowed to focus on stars that harbor low-amplitude radial velocity variations with RMS residuals in the 0.5-2.0 m/s range. The current observing strategy is to obtain a nightly multiple-shot composite velocity of an in-play candidate during block campaigns that run for 7-10 nights.

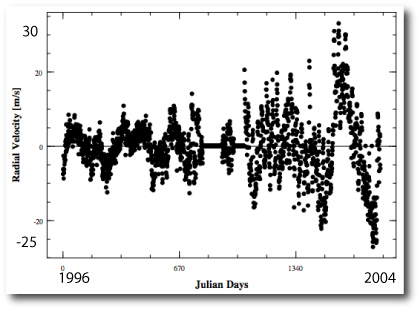
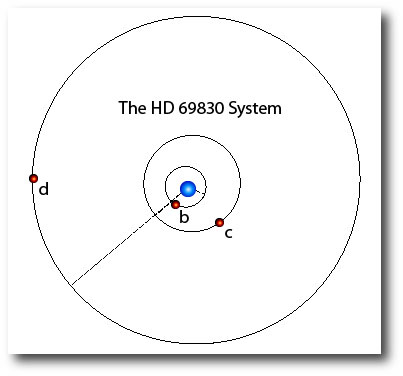
During the first few minutes, Lovis reviewed the current status of the published results. The Mu Arae planets (including the hot Neptune on the 9.6-day orbit, see here and here) are all present and accounted for. The HD 69830 triple-Neptune data set (see here, here and here) now contains twice as many velocities, with virtually no changes to the masses and orbits of the three known planets. Long-term scatter in the HD 69830 data set is at the ~90 cm/sec level, indicating either the effect of residual stellar jitter, or perhaps the presence of additional as-yet uncharacterized bodies.

He then announced that there are currently forty-five additional candidate planets with Msin(i)<30 Earth masses, P<50 days and acceptable orbital solutions. And that’s not counting candidates orbiting red dwarfs.

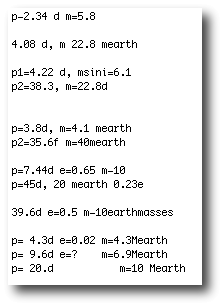
He then began to highlight specific systems. To say that planets were flying thick and fast is an understatement. Here’s the verbatim text that I managed to type out while simultaneously attempting to focus on the talk:

Rumor has it that some of these systems will be officially unveiled at the upcoming Nantes meeting on Super Earths. Odds-on, with 45 candidates in play, we’ll soon be hearing about a transiting planet with a mass of order ten times Earth’s. I won’t be at the Nantes meeting, but the stands will be harboring agents of the Oklo Corporation.

The talk finished with an overview of the statistics of the warm Neptune population. Most strikingly, a full 80% of the candidates appear to belong to multiple planet systems, but cases of low-order mean motion resonance seem to be rare [as predicted –Ed.] . There is a concentration of these planets near the 10-day orbital period, and the mass function is growing toward lower masses. Significant eccentricities seem to be the rule. And finally, I think it was mentioned that the planet-metallicity correlation is weaker for the warm Neptunes than for the population of higher-mass planets.

Seems like core accretion is standing the test of time.

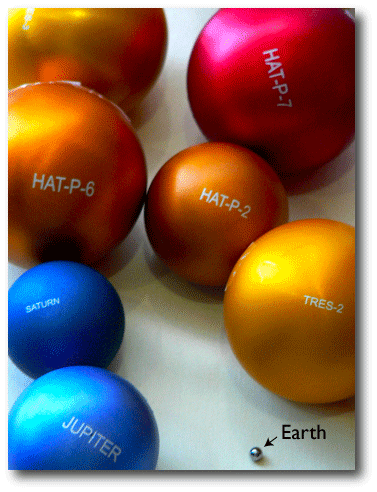
Note on the images: Gaspar Bakos (of HAT fame) had the cool idea of machining metal models for the planets of known radius which are correct in terms of relative size, and which have the actual density of their namesakes. HAT-P-6, for example, is constructed from a hollow aluminum shell, and with a density of ~0.6 gm/cc it would float like a boat. HAT-P-2b, on the other hand, which packs 8.6 Jupiter masses into less than a Jovian radius, has the density of lead and (not coincidently) is made out of lead. It’s startling to pick it up. CoRoT-Exo-3b, which was announced at the meeting, has a mass of twenty Jovian masses, and a radius just less than Jupiter. I guess that one will have to be made from Osmium.

Earth, at ~5.5 gm/cc, on the other hand, can be readily manufactured from a variety of different alloys.

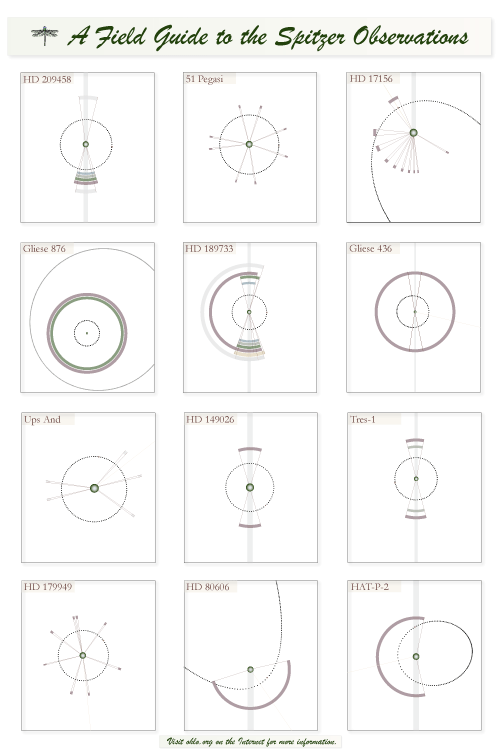
A Field Guide to the Spitzer Observations


Jonathan Fortney
has the office next to mine at UCSC, and so we’re always talking about the Spitzer observations of extrasolar planets. The Spitzer Space Telescope has proved to be an extraordinary platform for observing planets in the near infrared, and during the past year, the number of published and planned observations has really been growing rapidly.

Increasingly, with the flood of data, I’ve been finding that I have trouble keeping mental track of all the photometric observations of all the planets that Spitzer has produced. Let’s see, was Tres-1 observed in primary eclipse? Did someone get a 24-micron time series for HD 149026? And so on.

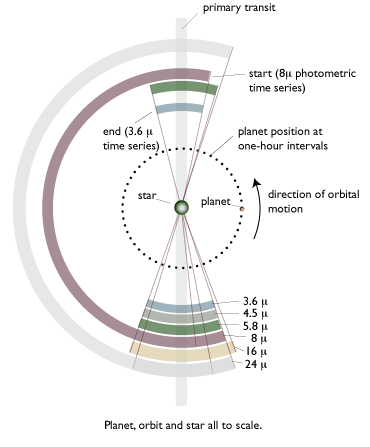
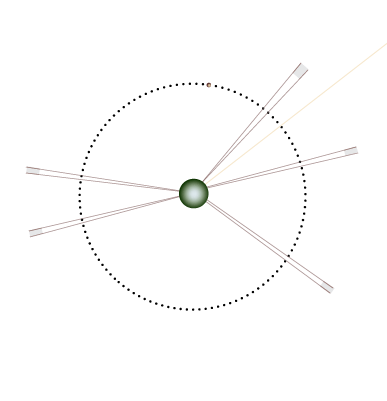
So Jonathan and I decided to put together a poster that aggregates the observations (that we know of) that have either been completed, or which have been scheduled. The relevant information for each campaign includes the star-planet system, the bandpass, and the duration and phase of the observation. We wanted the information for each system to be presented in a consistent manner, in which the orbits, the stars, and the planets are all shown to scale (and at a uniform scale from system to system). As an example, here’s the diagram for HD 189733:

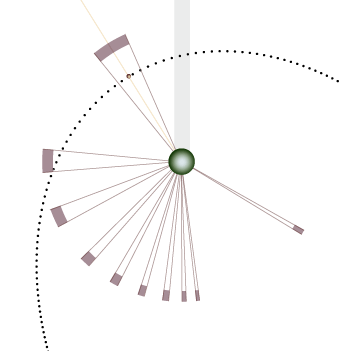
In putting the poster together, we were struck by the variety of different observational programs that have been carried out. Some of the diagrams, furthermore, with text removed, have a delicate insect-like quality.

(The figure just above shows Bryce Croll’s planned 8-micron observations of Transitsearch.org fave HD 17156b. Croll’s campaign will attempt to measure the pseudo-synchronous rotation period of the planet.)

I’m going to Boston next week to attend the IAU transit meeting, and so I printed out a copy of the poster to put up at the meeting:

Here’s a link to the Illustrator file and the .pdf version. Full size, it’s two feet wide and three feet tall. Going forward, I’ll update the files as new observations come in.

Just like in 1846

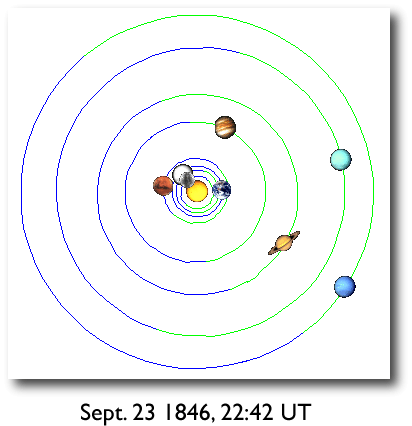
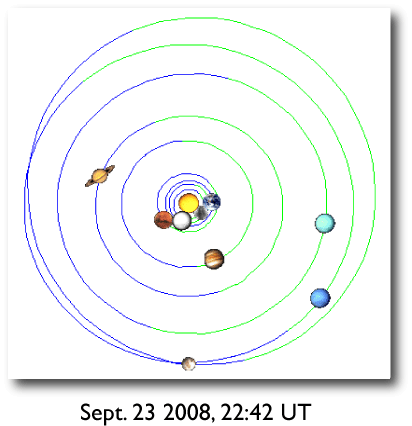
Uranus and Neptune have returned to nearly the configuration that they were in at the time of Neptune’s discovery in 1846. Using Solar System Live, it’s easy to see where the planets were located when Galle and d’ Arrest turned the Berlin Observatory’s 9-inch Fraunhofer refractor to the star fields of the ecliptic near right ascension 22 hours:

In 2011, Neptune, with its 165-year period period, will have made one full orbit since its discovery. Uranus, with an 84-year period, will have gone around the Sun almost two times.

Because the planets are fairly close to conjunction, Neptune has recently gone through the phase of its orbit where it exerts its largest perturbation on the motion of Uranus. This was similarly true in the years running up to 1846, and was responsible for LeVerrier’s sky predictions bearing such a stunning proximity to the spot where Neptune was actually discovered by Galle.

LeVerrier (and Adams) were quite fortunate. Without a computer, multi-parameter minimization is hard, and both astronomers cut down on their computational burden by assuming an incorrect distance for Neptune (based on Bode’s “law”). Their solutions were able to compensate for this incorrect assumption by invoking masses for Neptune that were much too large. They carried out remarkable calculations, but nevertheless, luck (in form of the fact that Uranus and Neptune had recently been near conjunction) played a considerable role.

Predictably, as soon as the real orbit of Neptune was determined, the playa haters tried to rush the stage. Benjamin Peirce of Harvard, in the Proceedings of the American Academy of Arts and Sciences 1, 65 (1847) described LeVerrier’s accomplishment as a mere “happy accident”:

I personally think that’s going a bit far. In any case, it’s interesting to compare the two independent predictions with the actual orbit of Neptune. I pulled the LeVerrier and Adams data in the following table from Baum and Sheehan’s book “In Search of Planet Vulcan” :

Elements Actual LeVerrier Adams
semimajor axis (AU) 30.10 36.15 37.25
eccentricity 0.01121 0.10761 0.12062
inclination (deg) 1.768
long. A. Node (deg) 131.794
long. Peri. (deg) 37.437 284.75 299.18
Period (yr) 164.79 217.39 227.3
Mass (Earths) 17 57 33
long. on Jan 1 1847 328.13 326.53 329.95

There’s been no shortage of hard work, and there’s been no shortage of predictions and false alarms, but nevertheless, nobody has managed to discover another solar system planet via analysis of gravitational perturbations. With the extrasolar planets, however, the prospects look a lot better. In particular, the Systemic Backend collaboration can team up with amateur observers to do the trick.

On the Systemic Backend, there are many candidate planets that have had their orbits characterized. As is usually the case with planet predictions, most of the candidates will wind up being spurious, but it’s definitely true that real planets orbiting real stars have been detected by the Backend user base. For example, Gliese 581 c was accurately characterized by the Systemic users several months before it’s announcement by the Swiss (see this post) and the same holds true for 55 Cancri f (see this post).

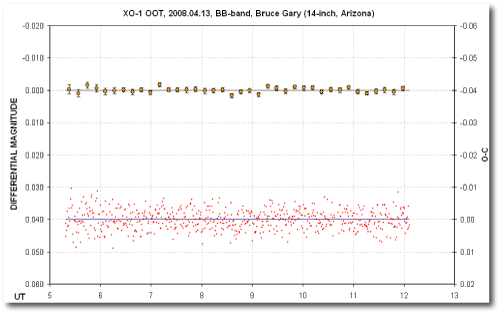
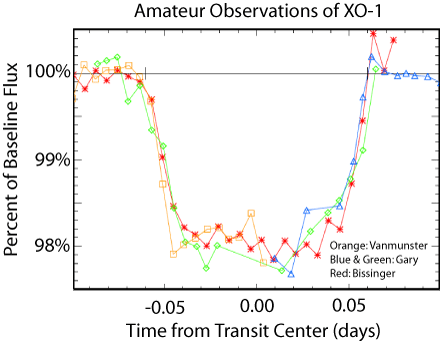
In the happy circumstance that a candidate planet is part of a system with a known transiting planet, then there’s an increased probability that if the candidate planet exists then it can also be observed in transit. This provides a channel for detection that completely circumvents the need for professional astronomers to carry out confirming radial velocity observations. Amateur observers are currently pushing the envelope down to milli-mag precision. Here’s an out-of-transit observation of the parent star of XO-1b by Bruce Gary:

This photometry is potentially good enough to confirm a Neptune-sized planet in transit across a Solar-type star, which is absolutely amazing.

An initial proof-of-concept observation has recently been carried out. On the systemic backend, the users have been investigating the HD 17156 system, which contains a known transiting planet. User “japf ” (José Fernandes) found that a lower chi-square fit to the published radial velocity data can be obtained if there’s a 6.2 Earth-mass companion on a 1.23 day orbit.


The best-fit eccentricity of the planet would bring it to a hair-raising 2 stellar radii of HD 17156, and if the planet is made of rock or water, it’ll be too small to detect, but nevertheless, it’s at least worth having a look. Jose sent the ephemeris to Bruce Gary, who observed on the opportunity falling on April 20, 04.5 UT.

No transit detected. This in itself was not at all surprising, given the long-shot nature of this particular candidate planet. What’s exciting, though, is that the full pipeline is now in place. There will definitely be strong candidates emerging over the coming months, and I think it’s quite probable that we’ll see a prediction-confirmation that is at least as good a match as was obtained for Neptune in 1846…

first quarter numbers

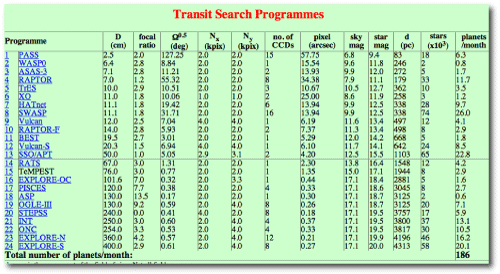
Back in 2002, Keith Horne gave a talk at the Frontiers in Research on Extrasolar Planets meeting at the Carnegie Institute in Washington and showed an interesting table:

At that time, there were more than two dozen active searches for transiting extrasolar planets, but only a single transiting planet — HD 209458 b — had been detected. Transits were generating a lot of excitement, but paradoxically, the community was well into its third straight year with no transit detections. The photometric surveys seemed to be just on the verge of really opening the floodgates, with a total theoretical capacity to discover ~200 planets per month.

It’s been six years, and the total transiting planet count is nowhere near 14,000. Most of the surveys on the table have had a tougher-than-expected time with detections because of the large number of false positives, and because of the need to obtain high-precision radial velocities on large telescopes to confirm candidate transiting planets. Indeed, the surveys that were sensitive to dimmer stars have largely faded out. It’s just too expensive to get high-precision velocities for V>15 stars. With the exception of the OGLE survey (which had been set up to look for microlensing during the 1990s, and which had established a robust pipeline early on) none of the surveys that employed telescopes with apertures larger than 12 cm have been successful. The currently productive photometric projects: TrES, XO, HATnet, and SuperWASP all rely on telescopes of 10 to 11 cm aperture to monitor tens of thousands to hundreds of thousands of stars, and all are sensitive to planets transiting stars in the V~10 to V~12 magnitude range. This magnitude range is the sweet spot: there are plenty of stars (and hence plenty of transits) and the stars are bright enough for reasonably efficient radial velocity confirmation.

Yesterday, SuperWASP rolled out 10 new transits at once, dramatic evidence of the trend toward planetary commoditization and of the fact that it’s getting tougher to make a living out on the discovery side. The detection of new planets is growing routine enough that in order to generate a news splash, you need multiple planets, and the more the better. This inflationary situation for new transit news is highly reminiscent of where the Doppler surveys were at seven years ago. For example, on April 4, 2001, the Geneva team put out a press release announcing the discovery of eleven new planets (including current oklo fave HD 80606b).

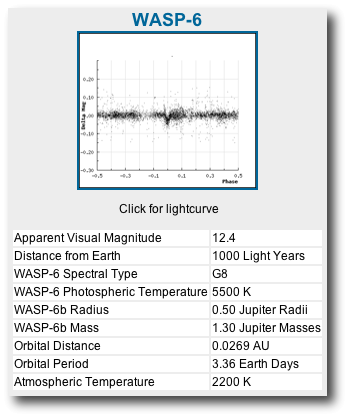
I’d like to register some annoyance with this latest SuperWASP announcement. There are no coordinates for the new planets, making it impossible to confirm the transits. There is no refereed paper. The data on the website are inconsistent, making it hard to know what’s actually getting announced. I was astonished, for example, that WASP-6 is reported on the website to have a radius 50% that of Jupiter, and a mass of 1.3 Jovian masses:

That’s nuts! If the planet is so small, why is the transit so deep? And a 2200 K surface temperature for a 3.36d planet orbiting a G8 dwarf? Strange. Perhaps the radius and mass have been reversed? In addition, there are weird inconsistencies between the numbers quoted in the media diagram and in the tables. For example, the diagram pegs WASP-7 at 0.67 Jovian masses, whereas the table lists it at 0.86 Jovian masses. WASP-10 has a period of 5.44 days in the table and 3.093 days in the summary diagram. Putting out a press release without the support a refereed paper is never a very good idea, even when there’s a danger that another team will steal your thunder with an even larger batch of planets.

Despite the difficulty in getting accurate quotes from the exchange, it’s interesting to see how the ten new planets stack up in the transit pricing formula. Using the data from the new WASP diagram (except for the 0.66 day period listed for WASP-9) and retaining the assumption that USD 25M has been spent in aggregate on ground-based transit searches, the 46 reported transits come out with the following valuations:

Planet Value
CoRoT-Exo-1 b $78,818
CoRoT-Exo-2 b $48,558
Gliese 436 b $3,970,811
HAT-P-1 b $883,671
HAT-P-2 b $77,938
HAT-P-3 b $260,473
HAT-P-4 b $172,851
HAT-P-5 b $133,239
HAT-P-6 b $224,110
HAT-P-7 b $54,382
HD 149026 b $722,590
HD 17156 b $869,254
HD 189733 b $2,429,452
HD 209458 b $10,103,530
Lupus TR 3 b $17,488
OGLE TR 10 b $60,260
OGLE TR 111 b $74,524
OGLE TR 113 b $36,599
OGLE TR 132 b $12,326
OGLE TR 182 b $15,261
OGLE TR 211 b $18,653
OGLE TR 56 b $19,761
SWEEPS 04 $1,826
SWEEPS 11 $193
TrES-1 $556,308
TrES-2 $113,043
TrES-3 $93,018
TrES-4 $205,508
WASP-1 $190,539
WASP-2 $188,956
WASP-3 $105,284
WASP-4 $104,581
WASP-5 $65,926
WASP-6 $339,387
WASP-7 $402,125
WASP-8 $209,169
WASP-9 $106,532
WASP-10 $74,281
WASP-11 $233,334
WASP-12 $160,189
WASP-13 $461,104
WASP-14 $14,450
WASP-15 $243,780
XO-1 $436,533
XO-2 $375,996
XO-3 $33,367

The ten new WASP planets (assuming that the correct parameters have been used) contribute about 1/10th of the total catalog value. There will likely be interesting follow-up opportunities on these worlds from ground and from space, but its unlikely that they’ll rewrite the book on our overall understanding of the field.

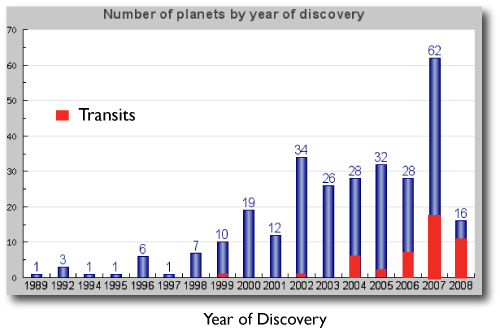
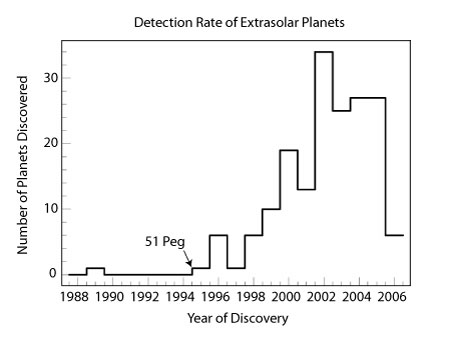
It’s interesting to plot the detection rate via transits in comparison to the overall detection rate of extrasolar planets. (The data for the next plot was obtained using the histogram generators at the Extrasolar Planets Encyclopaedia, which are very useful and are always up-to-date.)

It’s a reasonable guess that 2008 will be the first year in which the majority of discoveries arrive via the transit channel, especially if CoRoT comes through with a big crop. Radial velocity, however holds an edge in that it’s surveying the brightest stars, and (so far) has been responsible for progress toward the terrestrial-mass regime. I think that we might be seeing planets of only a few Earth masses coming out of the RV surveys during the coming year. Certainly, everything else being equal, a planet orbiting an 8th magnitude star is far more useful for follow-up characterization than a planet orbiting a 13th magnitude star.

1:1 eccentric

Image Source.

The range of planetary orbits that are observed in the wild is quite a bit more varied than the staid e < 0.20 near-ellipses in our own solar system. For regular oklo readers, the mere mention of Gl 876, 55 Cancri, or HD 80606, is enough to bring to mind exotic worlds on exotic orbits.

Non-conventional configurations involving trojan planets have been getting some attention recently from the cognescenti. Even hipper, however, is a configuration that I’ll call the 1:1 eccentric resonance. Two planets initially have orbits with the same semi-major axis, but with very different eccentricities. Conjunctions initially occur close to the moment of apoastron and periastron for the eccentric member of the pair.

Here’s a movie (624 kB Mpeg) of two Jupiter-mass planets participating in this dynamical configuration.

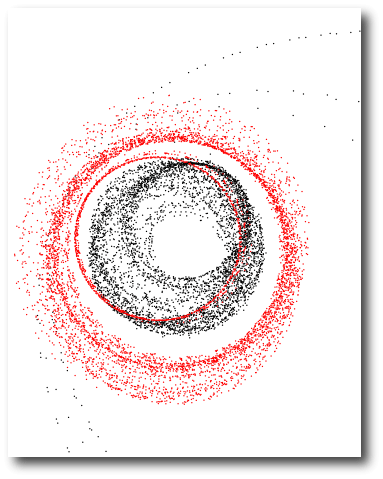
At first glance, the system doesn’t look like it’ll last very long. Remarkably, however, it’s completely stable. Over the course of a 400-year cycle, the two planets trade their angular momentum deficit back and forth like a hot potato and manage to orbit endlessly without anyone getting hurt.

Here’s an animation (1 MB Mpeg) which shows a full secular cycle. The red and the blue dots show the planet positions during the two orbit crossings per orbit made by one of the planets. It’s utterly bizarre.

These animations were made several years ago by UCSC grad student Greg Novak (who’ll be getting his PhD this coming summer with a thesis on numerical simulations of galaxy formation and evolution). As soon as we can get the time, Greg and I are planning to finish up a long-dormant paper that explores the 1:1 eccentric resonance in detail. In short, these configurations might be more than just a curiosity. When planetary systems having three or more planets go unstable, two of the survivors can sometimes find themselves caught in the 1:1 eccentric resonance. The radial velocity signature of the resulting configuration is eminently detectable if the planets can be observed over a significant number of orbital periods.

one seven one five six redux

Image Source.

Stefano, and Eugenio and I have been completely immersed in several time-critical projects during the past few months, and as a result, the frequency of posts here on oklo.org has not been as high as I would like. We’re starting to see our way clear, however, and very shortly, there’ll be a number of significant developments to report. Also in the cards is a major new release of the console, and a refocus on the research being carried out on the systemic backend. In any case, sincere thanks to all the backend participants for their patience.

Oklo regulars will recall all the excitement last fall surrounding the discovery of transits by HD 17156b. The transit was first observed on September 10th by a cadre of small telescope observers, and was then confirmed 21.21 days later on October 1.

Jonathan Irwin at Harvard CfA has led the effort to analyze and publish the October 1 observations of the transit. The work recently cleared the peer-review process, and was posted on the web a few days ago. (Here’s a link to the paper on astro-ph.)

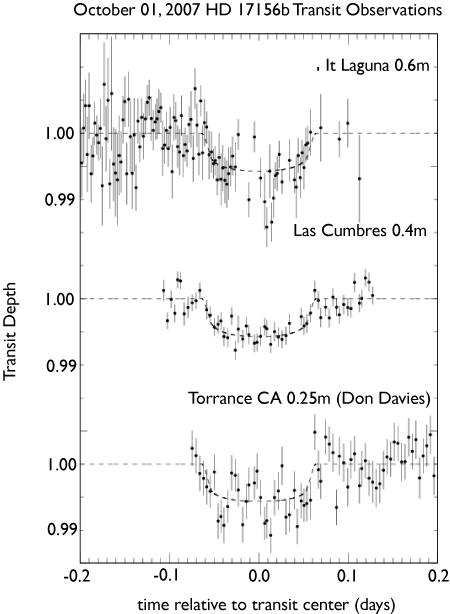
The night of October 1 was plagued by atrociously aphotometric conditions across the North American continent, and most of the observers who tried to catch the transit were clouded out. Southern California, however, had reasonably clear skies, and three confirming time series came from the Golden State. The Mount Laguna observations were taken from SDSU’s Observatory in the mountains east of San Diego, the Las Cumbres observations were made from the parking lot of the LCOGT headquarters in Santa Barbara, and Transitsearch.org participant Don Davis got his photometry from his backyard in suburban Los Angeles.

The aggregate of data from the October 1 transit allowed us to refine the orbital properties of the planet, and additional confirming observations in a paper by Gillon (of ‘436 fame) et al have given a much better characterization of the orbit.

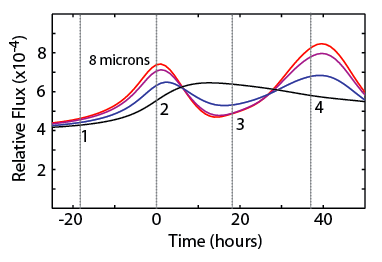
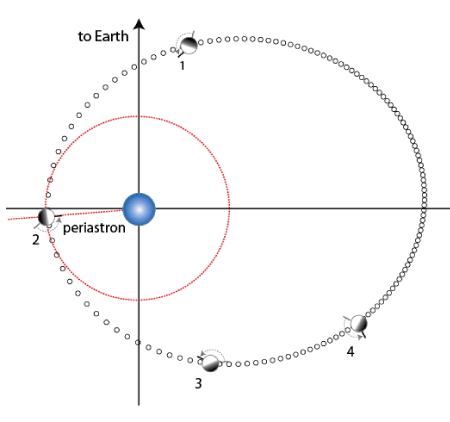
Because of the high orbital eccentricity, the planet should have very interesting weather dynamics on its surface. Jonathan Langton’s model predicts that the planet’s 8-micron flux should peak strongly during the day or so following periastron passage as the heated hemisphere of the planet turns toward Earth.

By measuring the rise and subsequent decay of the planet’s infrared emission, it’ll be possible to get both a measure of the effective radiative time constant in the atmosphere as well as direct information regarding the planet’s rotation rate. Bryce Croll is leading a team that successfully obtained time on the Spitzer telescope to make the observations.

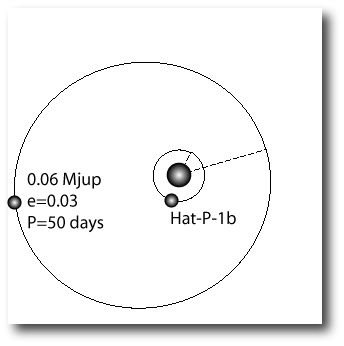
In another interesting development, a paper by Short et al. appeared on astro-ph last week which proposes the existence of a second planet in the HD 17156 system. The Short et al. planet has an Msin(i) of 0.06 Jupiter masses and an orbital period of 111.3 days. It’s quite similar to the slightly more eccentric (and hence dynamically unstable) version of the HD 17156 system proposed by Andy on the Systemic Backend last December, which was based on the radial velocities and transit timing then available:


The existence of a second planet in the HD 17156 system would be extremely interesting! The immediate question, however, is, how likely is it that the second planet is actually there?

To make an independent investigation, it’s straightforward to use the downloadable systemic console to fit to the available published data on HD 17156. I encourage you to fire up a console and follow along. Now that the Irwin et al. paper is on the web, we have the following transit ephemerides:

These can be added to the HD17156.tds transit timing file in the datafiles directory. The file should be edited to look like this:

When the HD17156v2TD system is opened on the console, it shows both the radial velocity and the transit timing data.

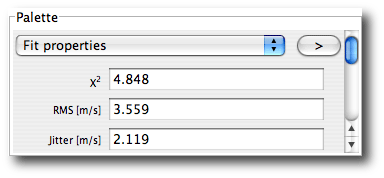
It’s quick work to dial in a one planet fit to the RV and transit timing data. I get a system with the following fit statistics:

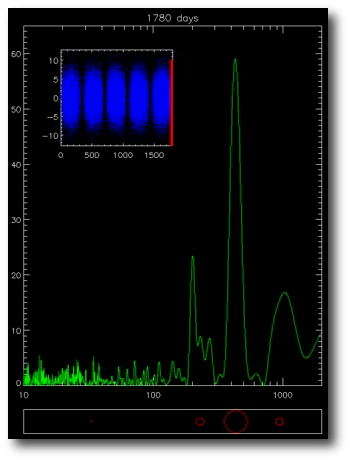
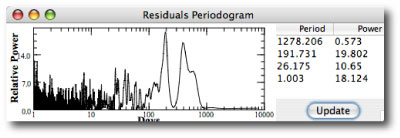
The required jitter of 2.12 m/s indicates that a one planet fit to the data should still be perfectly adequate, since the star (which is fairly hot and massive) has an expected stellar jitter of order 3 m/s. Nevertheless, the residuals periodogram does show a distinct peak at ~110 days:

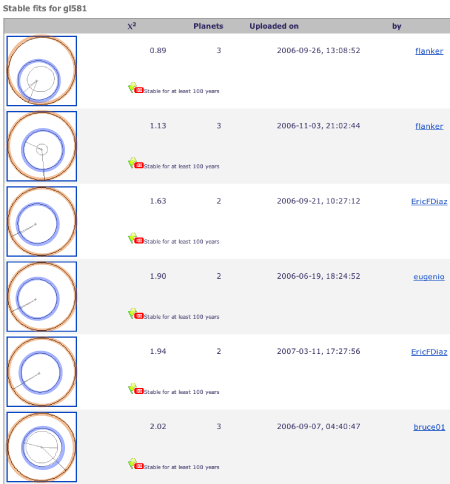
Using the 110 day frequency as a starting point, one finds that ~0.1 Mjup planets do indeed lower the chi-square. I’ve uploaded an example two planet fit to the systemic backend that harbors a second planet in a 113 day orbit and a mass of 0.13 Jupiter masses. Its periastron is aligned with that of planet b, and the RMS has dropped down to 3.08 m/s (for a self-consistent, integrated fit). The implied stellar jitter is a bargain-basement 0.59 m/s, which is almost certainly too good to be true.

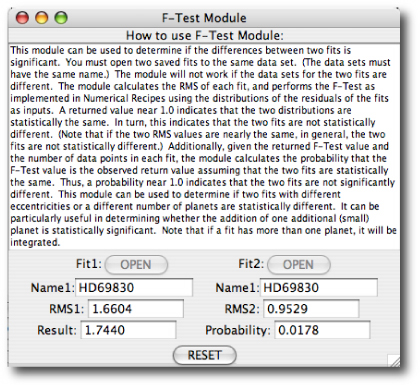
When I do an F-test between my one and two planet fits, the false alarm probability for planet ccomes in at 38%. It’s thus fairly likely that the second planet is spurious, but nevertheless, it certainly could be there, and it’ll be very interesting to keep tabs on both the transit timing data and the future radial velocity observations of this very interesting system…

Toward Alpha Cen B b

Image Source.

Yesterday, I gave a talk at the JPL Exoplanet Science and Technology Fair, a one-day meeting that showcased the remarkably broad variety of extrasolar planet-related research being carried out at JPL. In keeping with the wide array of projects, the agenda was fast-paced and completely diverse, with talks on theory, observation, instrumentation, and mission planning.

The moment I walked into the auditorium, I was struck by the out-there title on one of the posters: The Ultimate Project: 500 Years Until Phase E, from Sven Grenander and Steve Kilston. Their poster (pdf version here) gives a thumbnail sketch of how a bona-fide journey to a nearby habitable planet might be accomplished. The audacious basic stats include: 1 million travelers, 100 million ton vessel, USD 50 trillion, and a launch date of 2500 CE.

Fifty trillion dollars, which is roughly equivalent to one year of the World GDP, seems surprisingly, perhaps even alarmingly cheap. The Ultimate Project has a website, and for always-current perspective on interstellar travel, it pays to read Paul Gilster’s Centauri Dreams weblog.

Interest in interstellar travel would ramp up if a truly Earth-like world were discovered around one of the Sun’s nearest stellar neighbors. Alpha Centauri, 4.36 light years distant, has the unique allure. Last year, I wrote a series of posts [1, 2, 3, 4] that explored the possibility that a habitable world might be orbiting Alpha Centauri B. In short, the current best-guess theory for planet formation predicts that there should be terrestrial planets orbiting both stars in the Alpha Cen binary. In the absence of non-gaussian stellar radial velocity noise sources, these planets would be straightforward to detect with a dedicated telescope capable of 3 m/s velocity precision.

Over the past year, we’ve done a detailed study that fleshes out the ideas in those original oklo posts. The work was led by UCSC graduate student Javiera Guedes and includes Eugenio, Erica Davis, myself, Elisa Quintana and Debra Fischer as co-authors. We’ve just had a paper accepted by the Astrophysical Journal that describes the research. Javiera will be posting the article to astro-ph in the next day or so, but in the meantime, here is a .pdf version.

Here’s a diagram that shows the sorts of planetary systems one should expect around Alpha Cen B. The higher metallicity of the star in comparison to the Sun leads to terrestrial planets that are somewhat more massive.

We’re envisioning an all-out Doppler RV campaign on the Alpha Cen System. If the stars present gaussian noise, then with 3 m/s, one can expect a very strong detection after collecting data for five years:

Here’s a link to an animation on Javiera’s project website which shows how a habitable planet can literally jump out of the periodogram.

I think the planets are there. The main question in my opinion is whether the stellar noise spectrum is sufficiently Gaussian. It’s worth a try to have a look…

436 again

Image Source.

There’s a provocative paper up on the astro-ph today. Ignasi Ribas and two collaborators are reporting the “possible discovery” of a 4.8 Earth mass planet in an exterior 2:1 mean motion resonance with the transiting hot Neptune Gliese 436b. Planet four three six b is the well-known subject of great consternation, great scientific value, and many an oklo.org post. (For the chronological storyline, see: 1 (for background), 2, 3, 4, 5, 6, 7, 8, 9, and 10.)

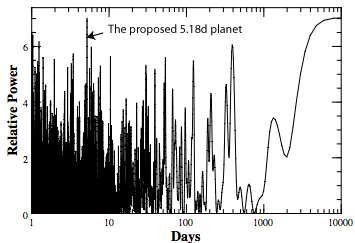
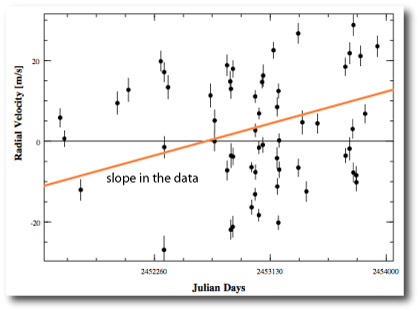
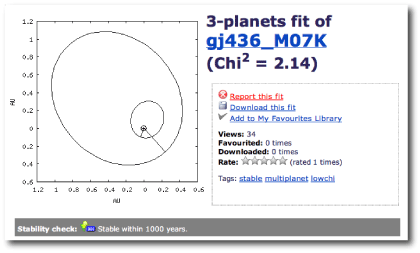
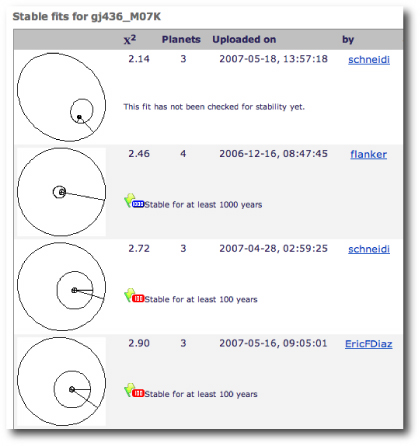
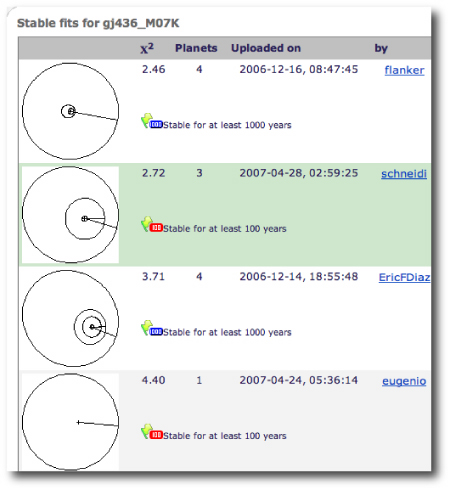
Here’s the basic idea. Ribas et al. note that a single-planet fit to the Maness et al. (2007) radial velocity data set (which is listed as gj_436_M07K on the systemic console) has a peak in the residuals periodogram at P~5.1866 days:

Using this periodogram peak as a starting point, they get a keplerian 2-planet fit that lowers the reduced chi-square from ~4.7 to ~3.7. They then point out that this detection can potentially be confirmed by measuring variations in transit timing. In their picture, the presently-grazing transit has come into visibility only within the last 2.5 years or so, as a result of orbital precession. The transit light curve should thus be showing significant variations in duration as well as deviations from a strictly periodic sequence of central transit times.

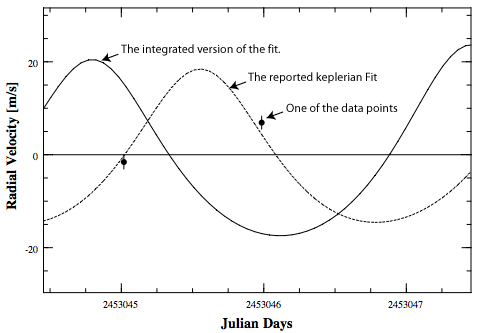
This will be a huge big deal if the claim holds up. For starters, it’ll provide a natural explanation for Gl 436b’s outsize eccentricity. And everyone’s been on the lookout for a strongly resonant transiting system with a short orbital period. For the time being, though, I’m withholding judgment. As a first point of concern, Ribas et al. are presenting a keplerian fit to the radial velocities. Yet for the orbital configuration they are proposing, it’s absolutely vital to take planet-planet interactions into account. One can see this by entering their fit into the console. (Use a mean anomaly at the first RV epoch 2451552.077 for planet b=40.441 deg, corresponding to their reported time of periastron of Tp_b=HJD 2451551.78, and a mean anomaly for planet c=268.14 deg, corresponding to their reported value of Tp_c=HJD 2451553.4.) One can also dial in a long-term trend if one wants, but this isn’t necessary. Once the fit is entered, the reduced chi-square is 3.7. Activate integration. (Hermite 4th-order is the faster method.) When the planets are integrated, their mutual interactions utterly devastate the fit, driving the reduced chi-square up to 85.018. Using the zoomer and the scroller, you’ll see that the integrated radial velocity curve and the keplerian curve start off as a good match, but then rapidly get completely out of phase.

In order to examine the plausibility of a two-planet fit in 2:1 mean motion resonance, one needs to fit the radial velocity data with integration turned on. It is also important to include the existing transit timing data in the fit (and to do this, it’s best to use the most recent, so-called unstable version of the console). Over at Bruce Gary’s amateur exoplanet archive (AXA), there are now three transit timing measurements listed, with the latest obtained by Bruce himself this past New Years Eve. The HJD measurements of central transit should be added to the gj436.tds file, along with the HJD 2454280.78149 +/- 0.00016 central transit time measured by Spitzer.

Ideally, the Spitzer secondary transit timing data should also be included, but at the moment, the distribution version of the console does not have the capability to incorporate secondary transit measurements. One approach would be to get a self-consistent fit, and then see whether the epoch of secondary transit matches that observed by Spitzer.

Have fun…

transit valuations

Image Source

Discoveries relating to transiting extrasolar planets often make the news. This is in keeping both with the wide public interest in extrasolar planets, as well as the effectiveness of the media-relations arms of the agencies, organizations, and universities that facilitate research on planets. I therefore think that funding support for research into extrasolar planets in general, and transiting planets in particular, is likely to be maintained, even in the face of budget cuts in other areas of astronomy and physics. There’s an article in Saturday’s New York Times which talks about impending layoffs at Fermilab, where the yearly budget has just been cut from $342 million to $320 million. It’s often not easy to evaluate how much a particular scientific result is “worth” in terms of a dollar price tag paid by the public, and Sean Carroll over at Cosmic Variance has a good post on this topic.

For the past two years, the comments sections for my oklo.org posts have presented a rather staid, low-traffic forum of discussion. That suddenly changed with Thursday’s post. The discussion suddenly heated up, with some of the readers suggesting that the CoRoT press releases are hyped up in relation to the importance of their underlying scientific announcements.

How much, actually, do transit discoveries cost? Overall, of order a billion dollars has been committed to transit detection, with most of this money going to CoRoT and Kepler. If we ignore the two spacecraft and look at the planets found to date, then this sum drops to something like 25 million dollars. (Feel free to weigh in with your own estimate and your pricing logic if you think this is off base.)

The relative value of a transit depends on a number of factors. After some revisions and typos (see comment section for this post) I’m suggesting the following valuation formula for the cost, C, of a transit:

The terms here are slightly subjective, but I think that the overall multiplicative effect comes pretty close to the truth.

The normalization factor of 580 million out front allows the total value of transits discovered to date to sum to 25 million dollars. The exponential term gives weight to early discoveries. It’s a simple fact that were HD 209458 b discovered today, nobody would party like its 1999 — I’ve accounted for this with an e-folding time of 5 years in the valuation.

Bright transits are better. Each magnitude in V means a factor of 2.5x more photons. My initial inclination was to make transit value proportional to stellar flux (and I still think this is a reasonable metric). The effect on the dimmer stars, though was simply overwhelming. Of order 6 million dollars worth of HST time was spent to find the SWEEPS transits, and with transit value proportional to stellar flux, this assigned a value of two dollars to SWEEPS-11. That seems a little harsh. Also, noise goes as root N.

Longer period transits are much harder to detect, and hence more valuable. Pushing into the habitable zone also seems like the direction that people are interested in going, and so I’ve assigned value in proportion to the square root of the orbital period. (One could alternately drop the square root.)

Eccentricity is a good thing. Planets on eccentric orbits can’t be stuck in synchronous rotation, and so their atmospheric dynamics, and the opportunities they present for interesting follow-up studies make them worth more when they transit.

Less massive planets are certainly better. I’ve assigned value in inverse proportion to mass.

Finally, small stars are better. A small star means a larger transit depth for a planet of given size, which is undeniably valuable. I’ve assigned value in proportion to transit depth, and I’ve also added a term, Np^2, that accounts for the fact that a transiting planet in a multiple-planet system is much sought-after. Np is the number of known planets in the system. Here are the results:

Planet Value
CoRoT-Exo-1 b $86,472
CoRoT-Exo-2 b $53,274
Gliese 436 b $4,356,408
HAT-P-1 b $969,483
HAT-P-2 b $85,507
HAT-P-3 b $285,768
HAT-P-4 b $189,636
HAT-P-5 b $146,178
HAT-P-6 b $245,873
HD 149026 b $792,760
HD 17156 b $953,665
HD 189733 b $2,665,371
HD 209458 b $11,084,661
Lupus TR 3 b $19,186
OGLE TR 10 b $66,112
OGLE TR 111 b $81,761
OGLE TR 113 b $40,153
OGLE TR 132 b $13,523
OGLE TR 182 b $16,743
OGLE TR 211 b $20,465
OGLE TR 56 b $21,680
SWEEPS 04 $2,004
SWEEPS 11 $211
TrES-1 $610,330
TrES-2 $124,021
TrES-3 $102,051
TrES-4 $225,464
WASP-1 $209,041
WASP-2 $207,305
WASP-3 $115,508
WASP-4 $114,737
WASP-5 $72,328
XO-1 $478,924
XO-2 $506,778
XO-3 $36,607

HD 209458 b is the big winner, as well it should be. The discovery papers for this planet are scoring hundreds of citations per year. It essentially launched the whole field. The STIS lightcurve is an absolute classic. Also highly valued are Gliese 436b, and HD 189733b. No arguing with those calls.

Only two planets seem obviously mispriced. Surely, it can’t be true that HAT-P-1 b is 10 times more valuable than HAT-P-2b? I’d gladly pay $85,507 for HAT-P-2b, and I’d happily sell HAT-P-1b for $969,483 and invest the proceeds in the John Deere and Apple Computer corporations.

Jocularity aside, a possible conclusion is that you should detect your transits from the ground and do your follow up from space — at least until you get down to R<2 Earth radii. At that point, I think a different formula applies.

CoRoT-exo-2 c?

Image Source.

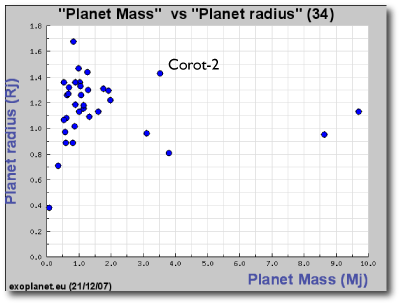
The CoRoT mission announced their second transiting planet today, and it’s a weird one. The new planet has a mass of 3.53 Jupiter masses, a fleeting 1.7429964 day orbit, and a colossal radius. It’s fully 1.43 times larger than Jupiter.

The surface temperature on this planet is likely well above 1500K. Our baseline theoretical models predict that the radius of the planet should be ~1.13 Jupiter radii, which is much smaller than observed. Interestingly, however, if one assumes that a bit more than 1% of the stellar flux is deposited deep in the atmosphere, then the models suggest that the planet could easily be swollen to its observed size.

The surest way to heat up a planet is via forcing from tidal interactions with other, as-yet unknown planets in the system. If that’s what’s going on with CoRoT-exo-2 b, then it’s possible that the perturber can be detected via transit timing. The downloadable systemic console is capable of fitting to transit timing variations in conjunction with the radial velocity data. All that’s needed is a long string of accurate central transit times.

The parent star for CoRoT-exo-2-b is relatively small (0.94 solar radii) which means that the transit is very deep, of order 2.3%. That means good signal to noise. At V=12.6, the star should be optimally suited for differential photometry by observers with small telescopes. With a fresh transit occurring every 41 and a half hours, data will build up quickly. As soon as the coordinates are announced, observers should start bagging transits of this star and submitting their results to Bruce Gary’s Amateur Exoplanet Archive. (See here for a tutorial on using the console to do transit timing analyses.)

6 Gigabytes. Two Stars. One Planet.

Image Source.

Another long gap between posts. I’m starting to dig out from under my stack, however, and there’ll soon be some very interesting items to report.

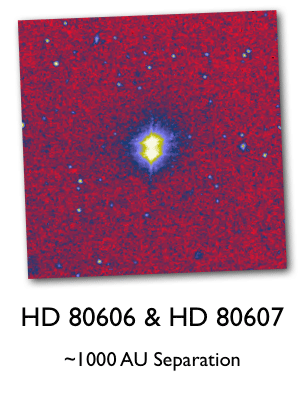
As mentioned briefly in the previous post, our Spitzer observations of HD 80606 did indeed occur as scheduled. Approximately 7,800 8-micron 256×256 px IRAC images of the field containing HD 80606 and its binary companion HD 80607 were obtained during the 30-hour interval surrounding the periastron passage. On Nov. 22nd, the data (totaling a staggering 6 GB) was down-linked to the waiting Earth-based radio telescopes of NASA’s Deep Space Network. By Dec 4th, the data had cleared the Spitzer Science Center’s internal pipeline.

We’re living in a remarkable age. When I was in high school, I specifically remember standing out the backyard in the winter, scrutinizing the relatively sparse fields of stars in Ursa Major with my new 20×80 binoculars, and wondering whether any of them had planets. Now, a quarter century on, it’s possible to write and electronically submit a planetary observation proposal on a laptop computer, and then, less than a year later, 6 GB of data from a planet orbiting one of the stars visible in my binoculars literally rains down from the sky.

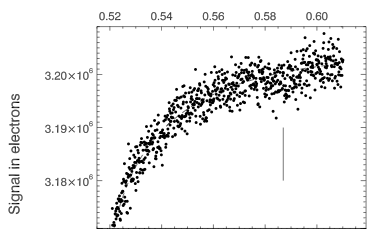
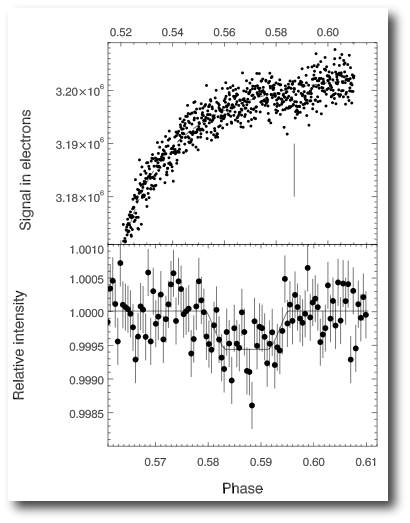
It will likely take a month or so before we’re finished with the analysis and the interpretation of the data. The IRAC instrument produces a gradually increasing sensitivity with time (known to the cognescenti as “the ramp”). This leads to a raw photometric light curve that slopes upward during the first hours of observation. For example, here’s the raw photometry from our Gliese 436 observations that Spitzer made last Summer. The ramp dominates the time series (although the secondary eclipse can also be seen):

The ramp differs in height, shape, and duration from case to case, but it is a well understood instrumental effect, and so its presence can be modeled out. Drake Deming is a world expert on this procedure, and so the data is in very capable hands. Once the ramp is gone, we’ll have a 2800-point 30 hour time series for both HD 80606 and HD 80607. We’ll be able to immediately see whether a secondary transit occurred (1 in 6.66 chance), and with more work, we’ll be able to measure how fast the atmosphere heats up during the periastron passage. Jonathan Langton is running a set of hydrodynamical simulations with different optical and infrared opacities, and we’ll be able to use these to get a full interpretation of the light curve.

In another exciting development, Joe Lazio, Paul Shankland, David Blank and collaborators were able to successfully observe HD 80606 using the VLA during the Nov. 19-20 periastron encounter! It’s not hard to imagine that there might be very interesting aurora-like effects that occur during the planet’s harrowing periastron passage. If so, the planet might have broadcasted significant power on the decameter band. Rest assured that when that when their analysis is ready, we’ll have all the details here at oklo.org.

planet per week

Image Source.

As the academic quarter draws to a close, it gets harder to keep up a regular posting schedule. This year, certainly, the difficulty has nothing to do with a lack of exciting developments associated with extrasolar planets.

A few unrelated items:

It appears that the HD 80606b Spitzer observations went smoothly, and that the data has been safely transmitted to Earth via NASA’s Deep Space Network. It is currently in the processing pipeline at the Spitzer Science Center. When it clears the pipeline, the analysis can start.

Back in September, I wrote a post about Bruce Gary’s Amateur Exoplanet Archive. This is a web-based repository for photometric transit observations by amateurs. With the number of known transits growing by the month, there’s a planet in transit nearly all of the time. Over 90 light curves have been submitted to the archive thus far. For transiting planets such as HD 189733b or HD 209458b, which have significant numbers of published radial velocity data, it’s very interesting to take the transit center measurements from Bruce’s archive and use them as additional orbital constraints within the console. The September post gives a tutorial on how to do this.

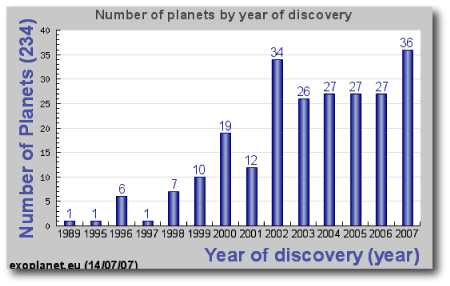
It really is turning out to be a banner year for extrasolar planets. As we head into December, this year is averaging more than one planet per week. The detection rate is more than double that of the previous four years.

The plot above gives a hint that Saturn-mass planets might wind up being fairly rare, as one might expect from the zeroth-order version of the core accretion theory. (For more information, this series: 1, 2, 3, 4, 5, 6, and 7 of oklo posts compares and contrasts the gravitational instability and core accretion theories for giant planet formation.)
Also, if you give talks, here’s a larger version of the above figure.

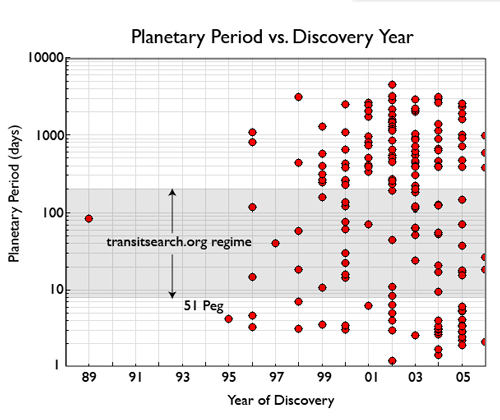
Another interesting diagram is obtained by plotting orbital period vs. year of discovery:

It’s possible that this diagram might be hinting that true Jupiter analogs are relatively rare. Could be that the disks around metal-rich stars are able to form Jovian mass planets and then migrate them in, while stars with subsolar metallicity form ice giants beyond the ice line. In this scenario, our solar system lies right on the boundary between the two outcomes.

It could also be the case that there are a whole slew of true-Jupiter analogs just on the verge of being announced. Time will tell.

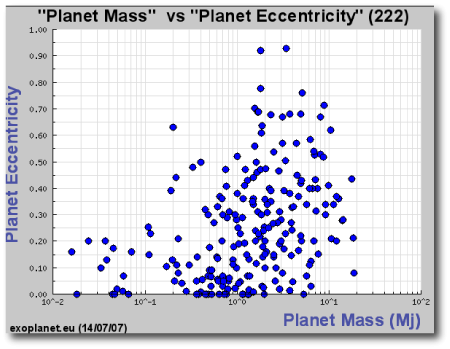
And as always, it’s interesting to spend time with the correlation diagram tool over at exoplanet.eu.

160 basis points

Image Source.

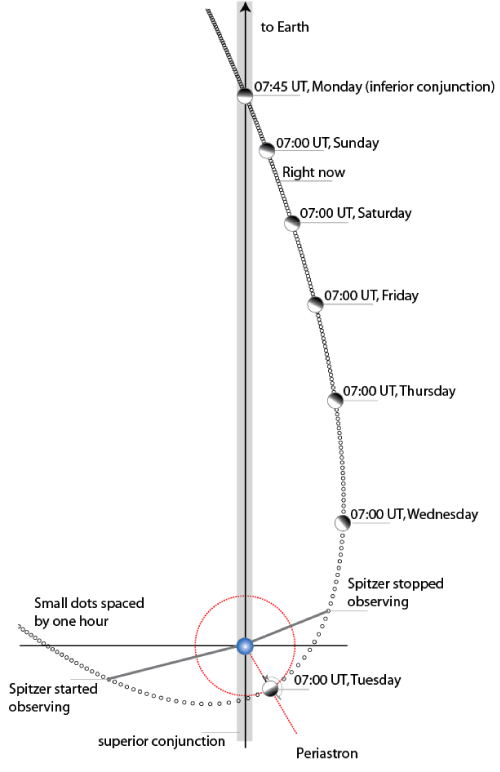
It’s sometimes a little weird to realize that my daily schedule is dictated by the orbits of alien planets. HD 80606b went through periastron passage at 07:00 UT last Tuesday, with the Spitzer Space Telescope’s rattlesnake’s eye vision trained intently upon it. Over the past few days, it’s been hurtling away from the star, gradually reducing its velocity as it climbs up the gravitational potential well of the star.

At 07:45 UT on Monday morning, HD 80606b is scheduled to go through inferior conjunction. In the 1.6% a-priori geometric chance that the orbital plane of the planet is in near-perfect alignment with the line of sight to the solar system, then it will be possible to observe the planet in transit. The 1.6% transit probability is fairly high for a planet with a period of 111 days, but much lower than the 15% probability that a secondary eclipse can be observed. If the planet is undergoing secondary eclipse, then we’ll know as soon as the Spitzer data comes in.

Back in early 2005, Transitsearch.org coordinated a campaign to check for transits of HD 80606b. At that time, there were fewer radial velocities available, and so the transit window was less well constrained. A number of observers got data, and there was no sign of transit, but the coverage was not good enough to rule out a transit. I’m thus encouraging observers to monitor HD 80606 during the next 48 hours on the off chance that it can be observed in transit. Given the small chance involved, it seems appropriate to refer to the transit probability in terms of basis points. As in, “In ’05, we got about 40 basis points. That means there’s still 120 basis points out there to collect.”

HD 80606 is a visual binary. The companion, HD 80607, provides a good comparison star in telescopes with a large enough aperture under good seeing conditions. For most observers, however, the light from the two stars is combined. A transit by HD 80606b is expected to have a depth of order 1.4%, and (if it’s a central transit) will last about 16 hours. It’s a long-shot for sure, but worthwhile and fun nonetheless.

Got the ‘606 kickin’ & the 436 written

Image Source.

As I write this, it’s JD 2454425.219 (17:16 UT, Nov. 20 2007). HD 80606 b whipped through periastron a little more than 10 hours ago, and the Spitzer Space telescope is literally just finishing its 31-hour observation of the event. Next comes the downlink of the data to Earth on the Deep Space Network, and then the analysis. Definitely exciting!

The Spitzer Space Telescope is scheduled to run out of cryogen in early 2009. When the telescope heats up, we’ll lose our best platform for mid-infrared observations of hot extrasolar planets, and so there was a palpable urgency last week as everyone prepared their proposals to meet the submission deadline for Spitzer’s last general observing cycle. During the next few years, there is going to be intense development of detailed 3D radiation-hydrodynamical models for simulating the time-dependent surface flows on extrasolar planets. These models will need contact points with hard data. It’s thus vital to bank as wide a variety of observations of as wide a variety of actual planets under as wide variety of different conditions as possible. A number of fascinating exoplanet observing proposals were submitted last week by a variety of highly competent teams. I’m urging that they all be accepted!

Most of the exoplanet observations that have been done with Spitzer have focused on tidally locked transiting planets on circular orbits. HD 189733b, HD 209458b, TrES-1 and HD 149026b are the flagship examples of this class. In the past year, however, eccentric transiting planets have started turning up. Gliese 436b (e=0.15) was the first, followed by HAT-P-2b (e=0.5), and HD 17156b (e=0.67).

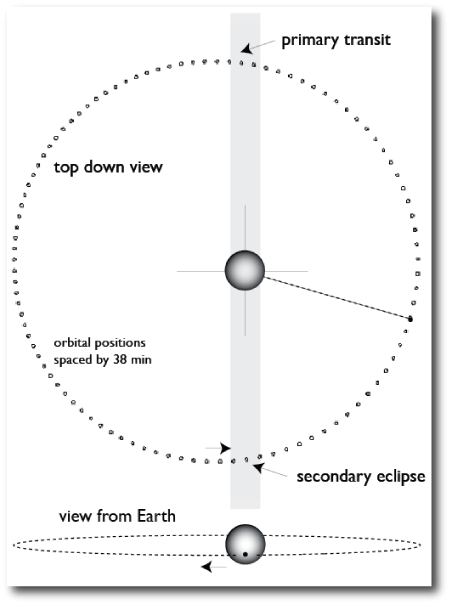
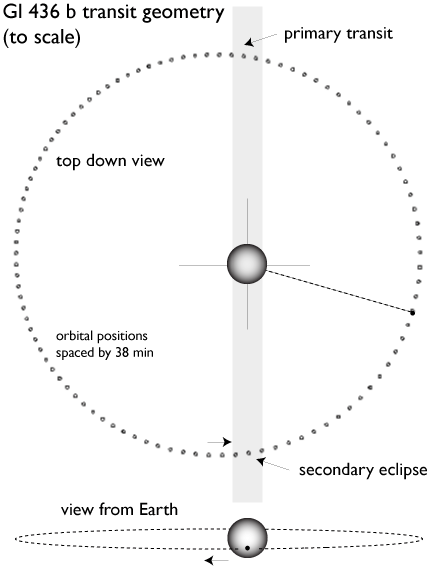
Drake Deming, Jonathan Langton and I decided that the most interesting proposal that we could make would be for Gliese 436 b. This is the Neptune-mass, Neptune-sized planet transiting a nearby red dwarf star. Here’s the to-scale diagram of the 2.644-day orbit:

After Gliese 436b was discovered to transit last spring, it triggered a Joe Harrington’s standing Target of Opportunity program. Both a primary and a secondary transit were observed (see this post) which confirmed the startlingly high eccentricity, and which allowed an estimate of the planet’s temperature (or, more precisely, the 8-micron brightness temperature). This turned out to be 712±36 K, which is significantly higher than the ~650 K baseline prediction.

The hotter-than-expected temperature measurement could arise from a number of different effects (or combinations of effects). By measuring the secondary eclipse, you strobe one hemisphere of the planet. If there are significant temperature variations across the surface of the planet, then a high reading might arise from chancing on the hotter side of the planet. Alternately, the effective temperature implied by measuring the energy coming out at 8-microns could be seriously skewed if the spectrum of the planet has deep absorption or emission bands at the 8-micron wavelength. Another possibility is that we’re observing tidal heating in action. Gliese 436b is being worked pretty hard in its eccentric orbit, and it should be generating quite a bit of interior luminosity as a result. If its structure is similar to Neptune, then a 712K temperature is completely understandable.

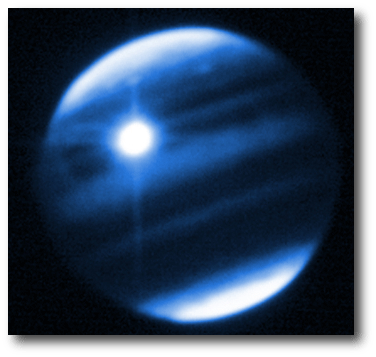
Io, of course, is subject to a similar situation. Here’s a K-band infrared photo of Io in transit in front of Jupiter:

Image Source.

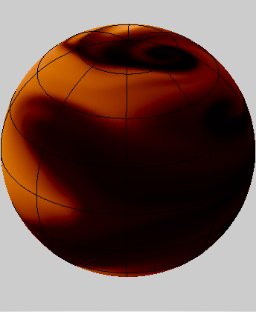
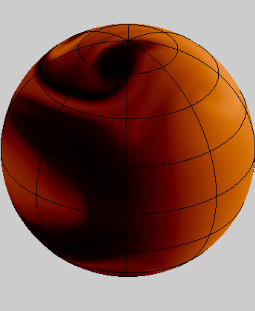
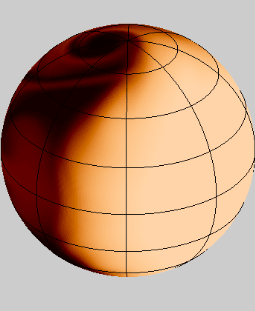
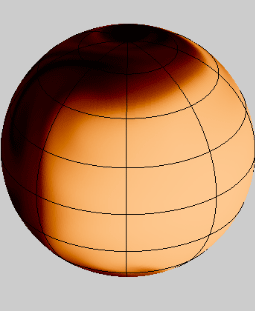
Gliese 436b is in pseudo-synchronous rotation, and spins on its axis every ~2.3 days. The eccentricity of the orbit leads to an 83% variation in the amount of light received from the star over a 1.3 day timescale. This leads to a complicated flow pattern on the surface.

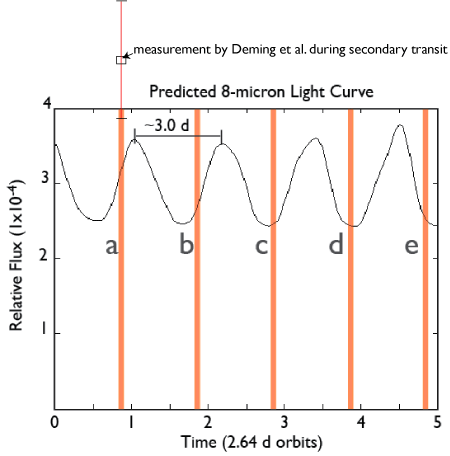
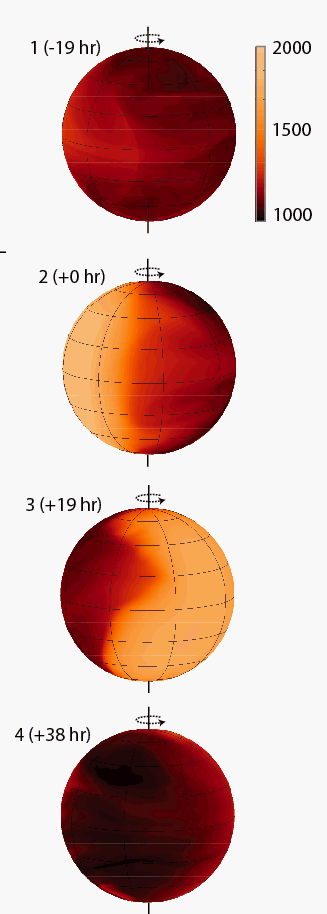
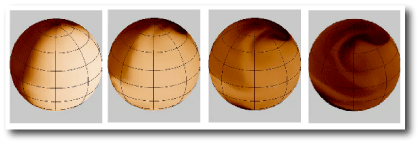
Here’s what Jonathan Langton’s model predicts for the appearance of the hemisphere facing Earth at five successive secondary eclipses:

Globally, the hydrodynamical model produces a statistically steady-state flow pattern that is dominated by a persistent eastward equatorial jet with a zonally averaged speed of ~150 meters per second. This eastward flow in the planet’s frame produces a light curve in the lab frame that has a ~3 day periodicity. This period is significantly longer than both the planet’s orbital period and the planet’s spin period. Our Spitzer proposal is to observe a sequence of 8 secondary transits in hopes of confirming both the amplitude and the periodicity of this light curve.

It’s certainly the case that our current hydrodynamical model is not the definitive explanation of what these planets are doing. I won’t be at all surprised if the flux variation from eclipse to eclipse is more complicated than what we predict. I’m highly convinced, however, that the model is good enough to indicate that the situation on Gliese 436b will be interesting, dynamic, and complex. The actual variation in the real observations will provide an interesting and non-trivial constraint that a definitive model of the planet will need to satisfy. The observations, if approved, will thus be of great use to everyone in the business of constructing GCMs for short period planets.

Stay tuned…

55 Cancri – A tough nut to crack.

Image Source.

As soon as the new data sets for 55 Cancri from the Keck and Lick Observatories were made public last week, they were added to the downloadable systemic console and to the systemic backend. The newly released radial velocities can be combined with existing published data from both ELODIE and HET.

Just as we’d hoped, the systemic backend users got right down to brass tacks. As anyone who has gone up against 55 Cnc knows, it is the Gangkhar Puensum of radial velocity data sets. There are four telescopes, hundreds of velocities, a nearly twenty year baseline, and a 2.8 day inner periodicity. Keplerian models, furthermore, can’t provide fully definitive fits to the data. Planet-planet gravitational perturbations need to be taken into account to fully resolve the system.

Eugenio has specified a number of different incarnations of the data set. It’s generally thought that fits to partial data sets will be useful for building up to a final definitive fit. Here’s a snapshot of the current situation on the backend:

The “55cancriup_4datasets” aggregate contains all of the published data for all four telescopes. This is therefore the dataset that is most in need of being fully understood. The best fit so far has been provided by Mike Hall, who submitted on Nov. 9th. After I wrote to congratulate him, he replied,

Thanks Greg, […] It actually slipped into place very easily. About 13-30 minutes of adding planets and polishing with simple Keplerian, then 25 iterations overnight with Hermite 4th Order.

The problem is that it seemed like I was getting sucked into a very deep chi^2 minimum, so getting alternative fits may be tricky!

Here’s a detail from his fit which illustrates the degree of difference between the Keplerian and the full dynamical model:

and here’s a thumbnail of the inner configuration of the system. It’s basically a self-consistent version of the best 5-Keplerian fit.

Mike’s fit has a reduced chi-square of 7.72. This would require a Gaussian stellar jitter of 6.53 m/s in order to drop the reduced chi-square to unity. Yet 55 Cancri is an old, inherently quiet star, and so I think it’s possible, even likely, that there is still a considerable improvement to be had. It’s just not clear how to make the breakthrough happen.

This situation is thus what we’ve been hoping for all along with the systemic collaboration: A world-famous star, a high-quality highly complex published data set, a tough unsolved computational problem, and the promise of a fascinating dynamical insight if the problem can be solved.

I’ll end with two comments posted by the frontline crew (Eric Diaz, Mike Hall, Petej, and Chris Thiessen) that I found quite striking. These are part of a very interesting discussion that’s going on right now inside the backend.

When something is this difficult to solve using the ordinary approaches, I start to look to improbable and difficult solutions. In the case of 55C, my hunch is that it’s a system where the integration is necessary, but not sufficient to build a correct solution. I think that the parameter space of solutions is so chaotic that the L-M minimization doesn’t explore it well, or that the inclination of the system is significant enough to skew the planet-to-planet interactions in the console, or both. Trojans or horseshoe orbits would fit these conditions. Perhaps other resonant or eccentric orbits would as well.

I think the high chi square results and flat periodograms after fitting the known planets also point to a 1:1 resonant solution or significant inclination. I just don’t think there’s enough K left to fit another significant planet unless it’s highly interactive with the others.

I’m going to keep working on this system in the hopes that we can find a solution (and because it’s really, really fun), but I suspect that a satisfactory answer won’t be found without a systematic search of the parameter space including inclination.

— Chris

“Nature is not stranger than we imagine but stranger than we can imagine.” Or words to that effect, I can’t remember who said that but in all probability this system shall have more questions answered about it (or not as is often the case!) by direct imaging e.g. such as by the Terrestrial Planet Finder (TPF) mission to show what is really happening (if it is ever launched). The 55 Cancri system is listed as 63 on the top TPF 100 target stars.

In the meantime, we struggle on… I don’t think I can add anything else to what Eric and everyone else has said…

— Petej

The latest on 55 Cancri

Image Source.

Here’s a development that systemic regulars will find interesting! In a press release today, came announcement of the detection of a fifth planet in the 55 Cancri system (paper here). The new planet has an Msin(i) of 0.144 Jupiter masses, a 260-day orbital period and a low eccentricity. The detection is based on a really amazing set of additions to the Lick and Keck radial velocities:

For background on the 55 Cancri system, check out this oklo.org post from December 2005.

The outer four planets in the 55 Cancri system all have fairly low eccentricities in the new five-planet model. This leads to a diminished importance for planet-planet interactions, but nevertheless, the system does require a fully integrated fit. Deviations between the Keplerian and integrated models arise primarily from the orbital precessions of planets b, c, and e that occur during the long time frame spanned by the radial velocity observations.

Eugenio has added the velocities onto a fully updated version of the downloadable systemic console. The new version of the console adds a wide variety of new features (including dynamical transit timing) that were formerly available only on the unstable distribution. Check it out, and see the latest news on the console change log and the backend discussion forum. Over the next month, we’ll be talking in detail about the new features on the updated console.

Very shortly, a new entries corresponding to the updated 55 Cancri data sets will be added to the “Real Stars” catalog on the systemic backend. I’ll then upload my baseline integrated 5-planet fit to the joint Keck-Lick data set. I’m almost certain that with some computational work, this baseline model can be improved. Such a task is not for the squeamish, however. Obtaining self-consistent 6-body models to the 55 Cancri data set is a formidable computational task for the console. There are 29 parameters to vary (if the Lick, Keck, ELODIE and HET radial velocity data sets are all included). The inner planet orbits every 2.79 days, and the data spans nearly two decades. Fortunately, Hermite integration is now available on the console. Hermite integration speeds things up by roughly a factor of ten in comparison to Runge Kutta integration.

There have been hints of the 260-day planet for a number of years now because it presents a clear peak in the residuals periodogram. After the 2004 announcement of planet “e” in its short-period 2.8 day orbit, Jack Wisdom of MIT circulated a paper that argued against the existence of planet “e”, and simultaneously argued that there was evidence for a 260-day planet in the data available at that time. More recently, a number of very nice fully self consistent fits to the available data have been submitted to the backend (by, e.g., users thiessen, EricFDiaz, and flanker). Their fits all contain both the 2.8 day and the 260-day planets, and happily, are fully consistent with the new system configuration based on the updated velocities. Congratulations, guys!

Interestingly, the best available self-consistent fits to the system indicate that planets b and c do not have any of the 3:1 resonant arguments in libration. It will be interesting to see whether this continues to be the case as the new fits roll into the systemic backend.

“seventy six seven hundred”

The flurry of activity surrounding the detection of the HD 17156b transits, combined with the start of the academic quarter here at UCSC, caused me to fall way behind on my stack. All of a sudden, over two weeks have passed with no oklo.org posts. I think that’s a record, unfortunately.

And it’s not as if there’s been no new exoplanet news. The past two weeks have seen the announcement of two more new transiting planets from Gaspar Bakos’ HATnet project. “Yo, what up TrES?” HAT-P-5b has a period of 2.79 days, and looks good in a 400-pixel wide everything’s to scale diagram:

There are enough transiting extrasolar planets now, so that it’s interesting to look for trends in the planetary properties. At Jean Schneider’s exoplanet.eu site, there’s a nifty set of php routines that make it very easy to dial up all the different correlation diagrams. With the inclusion of HD 17156b, HAT-P-5b, and HAT-P-6b, a plot of planetary radii vs. stellar metallicity is pointing to an interesting trend. It’s quite apparent that the metal-rich stars tend to harbor smaller planets. This seems to be indicating that metal-rich disks are yielding planets that have highly enriched heavy element fractions, which in turn is giving us an important clue into the planet formation process.

If we ignore Gliese 436b, which is far smaller in both mass and radius than all the other known transiting exoplanets, then there’s a fairly obvious hint of two separate sequences in the diagram — a large-radius sequence, and a small-radius sequence. Feel free to voice your opinion in the comments section…

It’d certainly be nice to get more transits by planets orbiting bright parent stars. To that end, it’s important to stress that literally every single planet transiting a V<13 parent star is located north of the the celestial equator. It’s pretty clear that the southern hemisphere Doppler-wobble planets have not been fully followed up with photometric campaigns. I’m thus keen to get the Southern-Hemisphere Transitsearch.org corps out on the sky during the coming austral summer. First on the list is HD 76700b. This 0.20 Jupiter-mass planet orbits with a period of 3.970985 days, and has an extensive and fairly recent set of published radial velocities. I just updated the orbital fit, and found that the transit windows are still quite narrow. A simple bootstrap analysis shows that the uncertainty in the time of the transit midpoint is not much wider than the expected duration of the transit itself. The star is just coming visible in the early morning, and so it should be straightforward to either confirm or rule out a transit for this particular planet.

Confirmed!

Image Source.

I’m happy to report that HD 17156b is observable in transit, and that Transitsearch.org observers played the key role in the discovery.

Regular oklo.org readers are familiar with HD 17156 b. This planet has an orbital period of 21.2 days, which is nearly four times longer than any other known transiting planet, and an eccentricity of e=0.67 (even higher than HAT-P-2b’s eccentricity of e=0.5). The geometry of the eccentric orbit has a periastron angle of 121 degrees, which means that the planet is quite close to the star as it perforates the plane containing the line of sight to Earth. Here’s a scale model showing the planet (at equally spaced intervals), the star, and the orbit:

Early last week, I got e-mail from Mauro Barbieri, an Italian post-doctoral researcher who is working on the CoRoT satellite, and who’s based at LAM in Marseille, France. In his spare time, Mauro has been writing articles for popular astronomy magazines in Italy, and has worked to coordinate Italian amateur astronomers for participation in Transitsearch campaigns. On the night of Sept. 9/10, he recruited four Italian amateur astronomers to monitor the transit window.

Two observers in Northern Italy were clouded out prior to the start of the transit, but two others, D. Gasparri and C. Lopresti, were able to observe through much of the night in Central Italy. Their data looked promising, showing clear ingresses at the same time as the ingress was observed by Jose Almenara in the Canary Islands. Ron Bissinger, observing from Pleasanton, California, and seven hours farther west, was able to start observing just after the transit ended.

As it happened, Roi Alonso, another CoRoT postdoc, is good friends with Jose Almenara, who made the Canary Island observations on Sep 9/10. Barbieri and Alonso did a careful analysis of the three transit-bearing data sets, and concluded that the transit is present at 3-sigma, 5.3-sigma, and 7.9-sigma, respectively. Almenara’s data, in particular, is excellent, despite of the fact that high winds occluded part of the mid-transit time series. By last Friday, on the strength of the detections, we had begun drafting a paper that discusses the discovery.

The Almenara egress is particularly convincing (the bottom time series shows the result of subtracting out the best-fit transit signal):

Barbieri’s and Alonso’s fit to the data from Sep. 9/10 implies the following properties for the planet and the transit. The model consistently takes into account the eccentric character of the planetary orbit:

The fit to the data suggests that the radius of HD 17156b is just a bit larger than the radius of Jupiter. This is fully in line with our theoretical models of the planet. HD 17156b experiences strong tidal forces during its periastron passages. This tidal heating might be observable in the form of excess infrared radiation, but it is not serving to inflate the planet beyond its expected radius.

Needless to say, we were quite excited by the quality of the fit. Everything seemed to hang together quite well, but confirmation was essential. The full transit would be visible across the United States and Canada. I wrote to the transitsearch.org mailing list, urging observers to monitor the star through the night of Sep. 30/Oct. 1. Dave Charbonneau of Harvard had been following oklo.org, and was impressed by the Sep 9/10 data. He worked very hard to organize and coordinate observers, and he’ll be leading a follow-up paper that uses data from all the transits to improve the planetary and the orbital characterization. Dave was very generous in offering to notify us if a transit was confirmed by the cadre of observers that he’d recruited.

Sunday morning was perfectly clear in Santa Cruz. Ron Bissinger lives in Pleasanton, just forty miles to the Northeast, and was ready to observe. His pipeline is quite automated, and so if he could observe, I knew that we would rapidly rule out or confirm a transit.

Late Sunday afternoon, I went running, and noticed that a gloomy bank of clouds was visible over the Pacific to the west:

At dusk, it was still clear, but the weather forecast did not look good. The bands of clouds that had stayed offshore to the Northwest were beginning to slide across the skies. By midnight, it was evident that the Bay Area would not be producing useful photometry. Furthermore, all of Arizona and New Mexico were rained out. Observer after observer reported in to say that they had not gotten data. The only positive report of clear skies came from Dave, graduate student Philip Nutzman, and postdoc Jonathan Irwin, who had set up a small telescope on the roof of a Harvard/CfA building in Cambridge MA.

By Monday morning, however, it was clear that several observers had indeed managed to obtain data. In addition to the Harvard roof observations, Bill Welsh and Abhijith Rajan had obtained usable photometry from the Mt. Laguna Observatory run by San Diego State University. Dave reported to me that on Sunday, while Dave was visiting the Zoo with his daughter, Bill had called with the news that they had managed to secure a night on the telescope and were at that moment driving up the mountain. In addition, a report came from Tim Brown of Las Cumbres observatory that while their Hawaii site had been weathered out, observations had been successfully made from parking lot of the observatory headquarters in Santa Barbara. And in addition, Don Davies, a Transitsearch.org observer in Torrance California had obtained a 10,000 CCD frames under good sky conditions.

On Tuesday evening, I got a phone call from Dave. The transit was clearly visible in both the Cambridge and the Mt. Laguna data. Thirty minutes later, I got an e-mail from Don Davies, who, in the early stages of analysis was seeing a clear transit-like signal at the expected time. We signed on Davies as a co-author, added Dave’s personal communication to the paper draft, and submitted the discovery. The paper will be showing up on astro-ph today. Here’s a link to a .pdf version:

Barbieri et al. 2007, AA, submitted (157 kb)

As for HD 17156b itself, the transit should present a number of exciting opportunities for follow-up observations. The large orbit leads to a 26-fold orbital variation in the amount of flux received from the parent star. This should drive complex weather on the surface, and indeed, even the night side of the planet should be glowing from its own radiation. Here’s a frame from Jonathan Langton’s most recent simulation of the planet which shows the night side hemisphere:

And here’s a one-orbit 1 MB animation of the surface flow patterns, glowing and roiling with their own emitted heat.

Tonight’s the Night

Image Source.

Tonight, Sept. 30/Oct 1, is the night to follow-up to confirm whether HD 17156b can be observed in transit. Earlier this morning, I sent the following e-mail to the Transitsearch Observers list:

Hello Everyone,

I’d like to alert you to an important follow-up opportunity TONIGHT to observe HD 17156 for a possible transit by its companion planet. North American Observers are best situated for the event.

HD 17156 b has been the topic of several blog posts on oklo.org, see: [1], [2], [3], [4], [5].

Photometry taken by Jose Manuel Alemenara Villa on the Sept. 9/10 opportunity was suggestive of a possible transit with duration 169 minutes, a photometric depth of 0.007 magnitudes, and a mid-transit time of HJD ~ 2454353.614. These values are all quite close to what one would expect if HD 17156b is really transiting.

If the event observed by Alemenara Villa is due to a transit, then the next transit will be centered at HJD~2454374.83 (CE 2007 October 01 07:55 UT Monday) with the transit beginning at about 06:30 UT.

Observing should start as soon as possible this evening, and observers are encouraged to take photometry for as long as possible.

My fit to the published radial velocities predicts a transit midpoint centered at HJD 2454374.87 (CE 2007 Oct. 01 08:52 UT Monday), with a +/- 0.3d uncertainty in the time of central transit. The Alemenara Villa event sits nicely inside this window.

Thanks very much!
best regards,
Greg

It looks like much of the Southwest is clouded out, and although the skies outside here in Santa Cruz are currently cobalt blue, it’s predicted that clouds and even rain will materialize after midnight. SoCal, however, and many locations in the midwest and east look good to go. Here’s a selection of California predictions from the clear sky clock. This is a cool graphical tool for use in scheduling observations. Dark blue is good, white is bad.

follow-up still in order…

potomac river

In the last post, I pretty much wrote off HD 17156 b, which was the subject of last week’s transitsearch.org photometric follow-up campaign. Ron Bissinger observed the star during the latter part of the transit window, and saw no evidence of a transit. Tonny Vanmunster wrote with the news that Belgium was clouded out.

Soon after the post went up, however, Jose Manuel Almenara Villa of the Instituto de Astrofisica de Canarias posted a comment:

Hi Greg,

I observed HD17156 in the transit window. Unfortunately the night was windy, affecting the small telescope so the photometry is not so clear as we would wish. Anybody else observe?

It’s possible that I have a central transit. I can show you some plots if you want. I will try to observe again on December 3 (I think that is my next opportunity).

Regards,
Jose

On Saturday, Jose sent me his photometric plots, I should point out that he emphasized once again that the night was windy. In his plots (I’ve rewritten the labels in illustrator so that they show up better on the narrow blog-page format) the black dots are individual observations (R filter, 7 s exposures), the red dots bin 6 observations, and the blue dots bin 12 observations.

On the night before the night of the transit window, he got baseline photometry which shows considerably less scatter, and which does a nice job of showing his excellent photometric technique:

He fit a simple trapezoidal transit template to his data. The resulting fit has a duration of 169 minutes, a depth of 0.007 magnitudes, and a mid-transit time (HJD) ~ 2454353.614. These values are all quite close to what one would expect if HD 17156 b really is transiting. The possible event ends just prior to the start of Ron Bissinger’s time series.

So what to think? It’s most important to reiterate Jose’s point that the weather was not particularly good, and that a block of critical data is missing during the event itself. I myself have contracted transit fever several times in the past, and have built up sufficient immunity to refrain from getting too excited. I think a conservatively realistic assessment would say that there’s still an 11% chance that HD 17156 b transits are occurring, and that the uncertainty in the window has been narrowed down significantly. Over the long run, if transitsearch.org is going to succeed, then its important to stay cautiously optimistic. The good thing about a transit is that it repeats with clockwork regularity (barring the unlikely, but tough-luck situation where dynamically induced precession of the node induces transit seasons.) The next chance to observe HD 17156 during the transit window falls to North America on Oct. 1, where hopefully there’ll be multiple observers on the sky. We’re bad – We’re Nationwide

To end on a heartfelt note, I think that the global collaborative efforts that go into these transitsearch campaigns have been both fun and inspiring, even when the result is the high-probability flat-line light curve. It would be exciting, though, if Jose ends up leading a discovery paper with the other participating observers as co-authors.

Results

Image Source.

It’s not looking good for transits by HD 17156 b. Ron Bissinger of Pleasanton, California obtained a block of photometric data that covered a significant chunk of the transit window. His time series lasts from JD 2454353.68 through 2452353.88, and shows no hint of an event:

His observations were taken just after the peak of the transit midpoint histogram:

No word yet on whether anyone in Europe or the eastern US were able to observe during the first half of the window. If you got data, let me know.

Also, the Gliese 176 window has opened up. If you’ve got a telescope, a CCD, and a free evening, you know what to do!

Discover a planet

Image Source.

My tight 30-minute layover in Denver turned into an eight-hour delay yesterday when a solenoid somewhere in our Boeing 777 malfunctioned just prior to pushback, giving me an unexpected opportunity to attempt to catch up on all the work that’s been piling up.

After 6 hours of tapping on the laptop, I’d exhausted my effectiveness, so I bought glossy magazines from the airport newstand. In the latest issue of Portfolio from Conde Nast, you can read an in-depth Vanity Fair style puff piece on ex-Tyco CFO Mark Swartz’s life in the Big House, and, in one of the advertisements, you’re encouraged to use a Visa “Signature” card to charge up some of the finer experiences in life. Quite to my surprise, #17 on a list that includes “See the Tony Awards live”, and “Test-drive a supercar”, is “Discover a planet”.

Now regular visitors to oklo.org all know that you can get your planet-discovery experience right here on the systemic backend without ever having to reach for your wallet. In fact, just yesterday, we learned from Gregory’s latest preprint on astro-ph that Eric Diaz (and a number of other systemic users) appear to have made the first characterizations of the most statistically probable planetary system fits to the HD 11964 radial velocity data set.

The HD 11964 data set was published by Butler et al. (2006). Two planets are already known to orbit this star. HD11964 b has roughly 1/3rd of a Saturn mass and a ~38-day orbit, whereas HD 11964 c is a sub-Jovian mass planet on a ~2110-day orbit. There’s a wide dynamically stable gap between the two planets, making this system a fertile hunting ground for additional companions.

Gregory does an extensive statistical analysis and argues that there’s strong evidence for a sub-Saturn mass planet on a year-long orbit. Eric Diaz’s version of this planet shows up in the fit that he submitted to systemic back in July 2007:

Eric also suggests the presence of a 12.4-day planet in the system. The Gregory analysis suggests that this planet is not statistically significant, but I’m going to add it to the transitsearch.org unpublished candidates list. There’s certainly no reason not to have a look-see if anyone has unused photometric capability.

HD 17156 at inferior conjunction (right now!)

Image Source.

It’s 01:58 UT Sep. 10, and HD 17156 has moved into its transit window. Hopefully photometric transit observers across Europe have clear skies. If you’re collecting data, drop us a note on the comments page!


Sep 09, 2007 Europe Satellite Map Source.

Most of California looks pretty good for catching the latter part of the transit window once it gets dark tonight. I was up on Mt. Hamilton last night, and even though it was clear, there was a strong smell of smoke in the air. Bits of gray ash from the nearby forest fires were floating down like snow, and so they couldn’t open the dome of the 36-inch.


Image Source.

The odds of a HD 17156 transit are 10.9%, so its best not to get hopes up too high. Its always good to have the next candidate ready to go, and as luck has it, there’s another good one in the hopper.

Endl et al. have published a preprint describing the discovery of a Neptune-mass planet orbiting the nearby red dwarf star Gliese 176 (aka HD 285968). This discovery is further evidence in favor of the core-accretion prediction that Neptune planets should be common around low-mass stars whereas Jovian-mass planets should be relatively rare. Endl et al.’s new planet has an orbital period of 10.24 days, an a-priori transit probability of 3%, and an expected transit depth of 0.4%. This is a low-amplitude signal, but it is nevertheless accessible to many experienced amateur astronomers. The discovery paper makes no mention of a photometric transit search, making this planet a very attractive Transitsearch.org candidate. The star is located at RA 04:43, Dec +18:57, and the next transit window is centered on Sep. 15, 2007.

HD 17156 b

Image Source.

Last week, I wrote a post introducing HD 17156 b, a Jovian planet on a highly eccentric 21.2-day orbit around a V=8.17 solar-type star lying 250 light-years away in Cassiopeia (RA=2h 50m, Dec=72 deg).

A photometric check for transits by HD 17156 b was reported in the discovery paper, but due to the nearly three-week orbital period, it was only possible to rule out about 25% of the transit window. Given the highly favorable geometry of the planetary orbit, this means that there’s an impressive ~11% chance (8.25% if you take the discount) that the planet can be observed in transit. The expected transit depth is a very respectable 1%, and given the bright parent star, it’s a straightforward detection for small-telescope observers everywhere in the Northern Hemisphere.

What’s it worth to catch HD 17156 b in transit? From a crass cash-money standpoint, one can estimate a dollar value. Because the planet has a long period and an eccentric orbit, it would be the first transiting example of its kind, and would thus be expected to generate a fairly large number of citations. From a career standpoint, an ADS citation is worth at least $100 (see, e.g. here). Based on the citation count for the TrES-1 discovery paper (144 citations in three years) it’s reasonable to expect that at one decade out, a HD 17156 b transit would garner of order 200 citations, for a conservative total value of 20K. Given the 10% probability of the transit coming through, the resulting expectation value is equivalent to having twenty Benjamins floating down from the black velvet of the night sky.

I used the systemic console’s bootstrap utility to generate a set of orbital fits to the published radial velocities for HD 17156. Each orbital fit describes a unique sequence of central transit times. For a particular transit opportunity, the aggregate of predicted central transit times from the different fits can be plotted as a histogram. Here’s the resulting plot for the transit opportunity that’ll occur next Monday (HJD 2454353.68):

The uncertainty in the time of central transit is ~0.3 days. A window this narrow is rare for a planet that hasn’t yet been thoroughly checked. In fact, as far as Transitsearch.org opportunities are concerned, it doesn’t get much better than this. Extending our opportunity cost analysis, the expected monetary return for observations within the 1-sigma transit window is an impressive $114 per hour. (Only rarely does the expected return per hour exceed minimum wage for existing transit opportunities.)

Scientifically, a transit by HD 17156 b would certainly be very exciting. The planet should be heating up very rapidly during its periastron passage, which should spur the generation of hemispheric-scale vortices and an 8-micron light curve that’s detectable with the Spitzer telescope. Observation of the secondary eclipse (assuming it occurs) would allow for a measurement of the global planetary temperature near the orbital apastron.

The frame above is from a hydrodynamical study of HD 17156 b that Jonathan Langton has just finished computing. If all the talk of dollars, ephemerides, opportunity cost, and expectation value is leaving you stressed out, then just kick back with this fat 1.0 MB .mov of the simulation and get your groove on.

Countdown

Image Source.

August 1st marked the most recent ‘606 day, which came and went without wide remark. Perhaps this was because in late Summer, HD 80606 rises and sets in near-synch the Sun, and is thus lost from the Earth’s night skies.

At the moment, HD 80606b is headed back out toward apastron.

The global storms and shockwaves that were unleashed at the beginning of August are dissipating rapidly, and the flux of heat from the planet is likely fading back down to the sullen baseline glow that arises from tidal heating.

HD 80606’s next periastron passage occurs on November 20th, and the Spitzer Space Telescope is scheduled to observe the whole event (details here). It’s going to be a big deal. Spitzer can only observe HD 80606 during two three-week windows each year, and fortunately, the Nov. 20th Periastron passage occurs during one of these windows. It’s literally the only opportunity to catch HD 80606 b’s big swing before Spitzer’s cryogen runs out in 2009.

The orbital geometry of the periastron passage looks like this:

Each marker of the orbit is separated by one hour. The prediction for the pseudo-synchronous rotation of the planet is also indicated. The planet should be spinning with a period of 36.8 hours. Jonathan Langton’s hydrodynamics code predicts what the temperature distribution on the planet should look like at each moment from Spitzer’s viewpoint in our solar system:

Transitsearch.org observers have covered a number of the HD 80606 b transit opportunities, and it seems pretty certain that the planet doesn’t transit. This isn’t surprising. The geometry of the orbit is such that when the planet crosses the plane containing the line of sight to the Earth, it’s quite a distance away from the star. Not so, however, for the secondary transit. There’s a very respectable 15% chance that Spitzer will detect a secondary transit centered two hours prior to the periastron passage.

Even if the planet doesn’t transit, we should be able to get a good sense of the orbital inclination from the shape of the light curve. If the orbit is nearly in the plane of the sky, then we should see a steady rise followed by a plateau in the 8-micron flux coming from the planet. For more nearly edge-on configurations, the flux peak should be clearly discernable. The observations are scheduled to start 20 hours prior to periastron and end 10 hours after.

Whorls

Image Source.

HAT-P-2b. The name doesn’t exactly ring of grandeur, but this planet — a product of Gáspár Bakos’ HAT Net transit survey — is poised to give the Spitzer Space Telescope its most dramatic glimpse to date of a hot Jupiter.

HAT-P-2b’s orbit is remarkably eccentric for a planet with an orbital period of only 5.6 days, and by a stroke of luck, periastron is located almost exactly midway between the primary and the secondary transits (as viewed from Earth). The strength of the stellar insolation at periastron is nine times as strong as at apastron, which more than guarantees that the planet will have disaster-movie-ready weather.

On June 6th, Josh Winn and his collaborators used the Keck telescope to obtain 97 radial velocities for HAT-P-2. The observations were timed to occur before, during, and after primary transit, and the Rossiter-McLaughlin effect is clearly visible in their data (preprint here):

The symmetry of the Rossitered points indicates that the angular momentum vector of the planetary orbit is aligned with the spin pole of the star:

schematic diagram showing rossiter effect

This state of affairs also holds true for the other transiting planets — HD 209458b, HD 149026b, HD 189733b — for which the effect has been measured. The observed alignments are evidence in favor of disk migration as the mechanism for producing hot Jupiters.

With its apparent magnitude of V=8.7, the HAT-P-2b parent star is roughly ten times brighter than the average planet-bearing star discovered in a wide-field transit survey. The star is bright enough, in fact, to have earned an entry in both the Henry Draper Catalog (HD 147506) and the Hipparcos Database (HIP 80076), but with its surface temperature of 6300K (F8 spectral type) it was too hot to have been a sure-fire “add” to the ongoing radial velocity surveys. Prior to this May, it had been entirely ignored in the astronomical literature (save a brief mention in this paper from 1969).

HAT-P-2’s intrisic brightness and its planet’s orbital geometry mean that in a relatively compact 34-hour observation, Spitzer can collect on the most interesting features of the orbit with high signal-to-noise. In particular, there is an excellent opportunity to measure the rate at which the day-side atmosphere heats up during the close approach to the star. The planet, in fact, presents such a remarkable situation that a block of Director’s Discretionary time was awarded so that the observations can be made during the current GO-4 cycle. They’ll be occurring soon.

Both HAT-P-2b and HD 80606 b will provide a crucial ground truth for extrasolar planetary climate simulations. Jonathan Langton’s current model, for example, predicts that that the temperatures on HAT-P-2b will range over more than 1000K. At the four times shown in the above orbital diagram, the hemisphere facing Earth is predicted to show the following appearances:

Spitzer, of course, can’t resolve the planetary disk. It measures the total amount of light coming from the planet in chosen passband. At 8-microns, the planet’s light curve should look like this:

The temperature maps only hint at the complex dynamics of the surface flow. A better indication is given by the distribution of vorticity,

which we’ll pick up in the next post…

HAT-P-3b

Image Source.

The HATNet survey’s latest single, “3b” landed on the charts last week at #12. This hot (Teff~1053K) new disk shows a definite metal influence, which makes sense, given that [Fe/H] for the parent star is an Ozzy-esque +0.27. You can get a free download of the paper from the Extrasolar Planets Encyclopaedia.

The past twelve months has seen the inventory of known transiting planets more than double, as wide-field surveys such as TrES, Exo, and HATnet start to reach the full production end of their observational pipelines. As the number of planets reaches the threshold for statistical comparisons, interesting trends (or possible trends) have started to emerge.

By far the most remarkable correlation, however, has been with respect to sky location. Among the fourteen fully announced transiting planets orbiting stars with V<14, every single one is located north of the celestial equator.

Planet

Mass

Mjup

Period

days

Dec V
Gl 436b 0.07 2.64385 +26 42 10.68
HAT-P-1 b 0.53 4.46529 +38 40 10.4
HAT-P-3 b 0.61 2.8999 +48 02 11.86
HAT-P-2 b 8.64 5.63341 +41 03 8.71
HD 149026 b 0.36 2.8766 +38 21 8.15
HD 189733 b 1.15 2.21857 +22 43 7.67
HD 209458 b 0.69 3.52475 +18 53 7.65
TrES-1 0.61 3.03007 +36 38 11.79
TrES-2 1.98 2.4703 +49 19 11.41
TrES-3 1.92 1.30619 +37 33 12.4
WASP-1 b 0.89 2.51997 +31 59 11.79
WASP-2 b 0.88 2.152226 +06 26 11.98
XO-1 b 0.9 3.941534 +28 10 11.3
XO-2 b 0.57 2.615838 +50 13 11.18

Looks like there’s some opportunity down under…

A hot hot Neptune

Image Source.

Regular oklo readers will recall Gillon et al.’s discovery that the Neptune-mass planet orbiting the red dwarf star Gl 436 can be observed in transit. Transitsearch got scooped, and the whole eposide got me all worked up enough to neglect the exigencies of everyday academic life and reel off three straight posts on the detection and its consequences (see here, here, here, and also here). The transits of Gl 436 b are a big deal because they indicate that the planet is possibly composed largely of water. It’s not a bare rock and it’s not a Jupiter-like gas giant. Rather, it’s consistent with being a fully Neptune-like object, hauled in for inspection on a 2.64385 day orbit.

Following Gillon et al.’s announcement, it became clear that Gl 436 transits would fit into a window of observability during the June 24th – July 04 IRAC campaign on the Spitzer Space Telescope. The red dwarf parent star, furthermore, because of its proximity, is bright enough for Spitzer to achieve good photometric signal-to-noise at 8-microns. As a result, Joe Harrington’s Spitzer Target of Opportunity GO-4 proposal was triggered, and the Deep Space Network radioed instructions to the spacecraft to observe the primary transit on June 29th, as well as the secondary eclipse (when the planet passes behind the star) on June 30th, a bit more than half an orbit later. Joe, along with his students Sarah Navarro and William Bowman, and collaborators Drake Deming, Sara Seager, and Karen Horning asked me if I wanted to participate in the analysis. After watching all the ‘436 action from the sidelines in May, I was more than happy to sign up!

One of the most exciting aspects of being a scientist is the round-the-clock push to get a time-sensitive result in shape for publication. There’s a fantastic sense of camaraderie as e-mails, calculations, figures and drafts fly back and forth. On Monday afternoon PDT (shortly after midnight GMT) when Mike Valdez sent out his daily astro-ph summary, it was suddenly clear that we were under tremendous pressure to get our results analyzed and submitted. The Geneva team had swooped in and downloaded the data for the primary transit the moment it was released to the community! They had cranked out a reduction, an analysis, and a paper, all within 48 hours. Their light curve confirmed the ground-based observations. Spitzer’s high-quality photometry indicates that the planet is slightly larger than had been indicated by the ground-based transit observations. Drake submitted our paper yesterday afternoon.

Fortunately for us, the real prize from Spitzer is the secondary eclipse. Its timing is capable of independently confirming that the orbit is eccentric, and the depth gives an indication of the surface temperature on the planet itself.

The upper panel of the following figure shows the raw Spitzer photometry during the secondary eclipse window. IRAC photometry at 8 μm is known to exhibit a gradually increasing ramp-up in sensitivity, due to filling of charge traps in the detectors, but even before this effect is modeled and subtracted, the secondary transit is visible to the eye. The bottom panel shows the secondary transit in detail.

The secondary transit occurs 58.7% of an orbit later than the primary transit, which proves that the orbit is eccentric. A detailed fit to the transit times and to the radial velocities indicates that the orbital eccentricity is e=0.15 — halfway between that of Mars (e=0.1) and Mercury (e=0.2). The orbital geometry can be drawn to scale in a diagram that’s 440 pixels across:

The depth of the secondary eclipse is 0.057%, which allowed us to estimate a 712 ± 36K temperature for the planetary surface.

A temperature of 700+ K is hotter than expected. If we assume that the planet absorbs all the energy that it gets from the star and re-radiates its heat uniformly from the entire planetary surface, then the temperature should be T = 642 K. The higher temperature implied by the secondary eclipse depth could arise from inefficient transport of heat to the night side of the planet, from a non-“blackbody” planetary emission spectrum, from tidal heating, or from a combination of the three. If the excess heat is all coming from tidal dissipation, then the Q-value for the planet is 7000, suggesting that it’s a bit more dissipative inside than Uranus and Neptune.

What would Gl 436 b look like if we could go there? To dark adapted eyes, the night side is just barely hot enough to produce a faint reddish glow (as is the case on the surface of Venus, which has a similar temperature). The atmosphere is too hot for water clouds, and is likely transparent down to a fairly high atmospheric pressure level. The day-side probably reflects a #E0B0FF-colored hue that contrasts with the orange-yellow light of the star. The planet spins with a period of 2.32 days so that it can be as spin-synchronous as possible during the sector of its orbit closest to periastron. At a fixed longitude on the planet, the day drags on for 456 hours from high noon to high noon.

Jonathan Langton has been running atmospheric simulations with the latest parameters. On the phone, just a bit ago, he would only say that the preliminary results were “interesting”…

Second quarter earnings report

Image Source.

On Thursday and Friday of last week, the Dow Jones Industrial Average jumped nearly 2%. Given the soaring price of oil and the subprime mortgage crisis, many students of the financial markets were puzzled by this seeming burst of irrational exuberance.

A visit to exoplanet.eu, however, suggests that investors and speculators were placing buy orders in response to the rapid recent increase in the number of known planets. During the first two quarters of ’07, the extrasolar planet detection rate has been running more that 100% above the rate reported for the most recent full fiscal year.

When asked about the impact of the new discoveries, one metals trader was quoted, “Well, Mate, the Marketplace has been pricing in the core-accretion theory for several years now. That means we’re looking at a Z of ~0.1 for each one of these planets coming in, so that’s roughly 30 Earth masses of ore per extrasolar planet. If we use the solar gold assay, that works out to one quintillion ounces of new proven reserves for each discovery. With gold at $660, we’re starting to talk real money.”

Jocularity aside, the raft of new planet discoveries is having a noticeable impact on the correlation diagrams that can be explored at the exoplanets.eu site. One (likely statistically insignificant) curiosity is the lack of Saturn-mass planets in this year’s crop to date. At the low-mass end, Neptunes such as Gl 674b are turning up with increasing frequency, and the detection-rate for Jupiter-mass planets and above also remains strong. This dichotomy is very much in line with a key prediction of core-accretion in its simplest form. The rapid gas accretion that occurs once the planet mass reaches ~30 Earth masses should tend to make Saturn-mass planets relatively rare.

Another interesting diagram results when one plots the masses and eccentricities of the known RV-detected planets. A glance at the resulting diagram indicates that low-mass planets tend to be on more circular orbits. Could this be hinting at two populations of planets and (perhaps) two different formation mechanisms? It’s hard to tell. Much of the effect comes from the fact that low-mass planets need to have short periods in order to be detectable. Short-period planets, in turn, are far more affected by tidal circularization of the orbits. The plot is also reflecting the still-mysterious (but well known) shortage of high-mass hot Jupiters.

A Habitable Earth

Image Source.

There remain three blockbuster, front-page discoveries in exoplanetary science. The first is the identification of a potentially habitable Earth-mass planet around another star. The second is the detection of a life-bearing planet. The third is contact with extraterrestrial intelligence.

It’s hard to predict when (and in which order) discoveries #2 and #3 will take place. Discovery #1, on the other hand, is imminent. We’re currently 2±1 years away from the detection of the first habitable Earth-mass planet (which implies ~15% chance that the announcement will come within one year).

The breakthrough detection of a habitable Earth will almost certainly stem from high-precision Doppler monitoring of a nearby red dwarf star, and already, both the Swiss team and the California-Carnegie team are coming tantalizingly close. The following table of notable planet detections around red dwarfs gives an interesting indication of how the situation is progressing:

Planet

M star

M sin(i)

date K #obs sig µ
Gl 876 b 0.32 615 1998 210 13 6.0 247
Gl 876 c 0.32 178 2001 90 50 5.0 127
Gl 436 b 0.44 22.6 2004 18.1 42 4.5 26
Gl 581 b 0.31 15.7 2005 13.2 20 2.5 23
Gl 876 d 0.32 5.7 2005 6.5 155 4.0 20
Gl 674 b 0.35 11.8 2007 8.7 32 0.82 60
Gl 581 d 0.31 7.5 2007 2.7 50 1.23 16
Gl 581 c 0.31 5.0 2007 2.4 50 1.23 14

The masses of the stars and planets are given in Solar and Earth masses respectively. The year of discovery for each planet is listed, along with the half-amplitude, K, of the stellar reflex velocity (in m/s), the number of RV observations on which the detection was based, the average reported instrumental error (sigma) associated with the discovery observations, and a statistic, “µ”, which is K/sigma multiplied by the square root of the number of observations at the time of announcement. The µ-statistic is related to the power in the periodogram, and gives an indication of the strength of the detection signal at the time of discovery. In essence, the lower the µ, the riskier (gutsier) the announcement.

What will it take to get a habitable Earth? Let’s assume that a 0.3 solar mass red dwarf has an Earth-mass planet in a habitable, circular, 14-day orbit. The radial velocity half-amplitude of such a planet would be K=0.62 m/s. Let’s say that you can operate at 1.5 m/s precision and are willing to announce at µ=20. The detection would require N=2,341 radial velocities. This could be accomplished with an all-out effort on a proprietary telescope, but would require a lot of confidence in your parent star. To put things in perspective, the detection would cost ~10 million dollars and would take ~2 years once the telescope was built.

Alternately, if the star and the instrument cooperate to give a HARPS-like precision of 1 m/s, and one is willing to call CNN at µ=14, then the detection comes after 500 radial velocities. The Swiss can do this within 2 years on a small number of favorable stars using HARPS, and California-Carnegie could do it on a handful of the very best candidate stars once APF comes on line. Another strategy would be to talk VLT or Keck into giving several weeks of dedicated time to survey a few top candidates. Keck time is worth ~$100K per night, meaning that we’re talking a several-million dollar gamble. Any retail investor focused hedge funds out there want to make a dramatic marketing impact? Or for that matter, with oil at $68 a barrel, a Texas Oil Man could write a check to commandeer HET for a full season and build another one in return. “A lone star for the Lone Star.”

If I had to bet on one specific headline for one specific star, though, here’s what I’d assign the single highest probability:

The Swiss Find a habitable Earth orbiting Proxima Centauri. Frequent visitors to oklo.org know about our preoccupation with the Alpha-Proxima Centauri triple system. We’ve looked in great detail at the prospects for detecting a habitable planet around Alpha Centauri B, and Debra Fischer and I are working to build a special-purpose telescope in South America to carry out this campaign (stay tuned for more on this fairly soon). Proxima b, on the other hand, might be ready to announce right now on the basis of a HARPS data set, and the case is alarmingly compelling.

Due to its proximity, Proxima is bright enough (V=11) for HARPS to achieve its best radial precision. For comparison, Gl 581 is just slightly brighter at V=10.6. Proxima is effortlessly old, adequately quiet, and metal-rich. If our understanding of planet formation is first-order correct, it has several significant terrestrial-mass planets. The only real questions in my mind are, the inclination of the system plane, the exact values of the orbital periods, and whether N_p = 2, 3, 4 or 5.

The habitable zone around Proxima is close-in. With an effective temperature of 2670K, and a radius 15% that of the Sun, one needs to be located at 0.03 AU from the star to receive the same amount of energy that the Earth receives from the Sun. (Feel free to post comments on tidal locking, x-ray flares, photosynthesis under red light conditions, etc. Like it or not, if the likes of Gl 581 c is able to generate habitability headlines and over-the-top artist’s impressions, just think what a 1 Earth-Mass, T=300 K Proxima Centauri b will do…) A best guess for Proxima’s mass is 12% that of the Sun. An Earth in the habitable zone thus produces a respectable K=1.5 m/s radial velocity half-amplitude. It’s likely that HARPS gets 1.2 m/s precision on Proxima. A µ=15 detection thus requires only 144 RV observations. Given that Proxima is observable for 10 months of the year at -30 South Latitude, there are presumably already more than 100 observations in the bag. We could thus get an announcement of Proxima Cen b as early as tomorrow.

Relaunch

Image Source.

The Transitsearch collaboration has been active since 2001, and has fallen somewhat short of success. When reporters from the likes of space dot com call, they always want to know, “How many planets have you guys discovered?”

“Zero.”

The project has, however, been of some value. It’s helped publicize the fact that small telescopes can be of remarkable utility in carrying out photometric follow-up observerations. The basic strategy of checking Doppler-detected planets at the predicted transit times has proved its worth for the Swiss with the transits of Gl 436 b. But the fact is unavoidable. Transitsearch needs to step up several levels if it’s going to compete.

I’m thus in the midst of implementing a major overhaul of the site resources. To get away from the tonight-we’re-gonna-html like it’s 1999 feel, I’ve given the website a new look. Check it out.

Not everything is in place yet, but the server that hosts the systemic backend is now also keeping the candidates tables up to date. The ephemerides are incrementally updated every ten minutes, and so the transit window column now has a much finer resolution. It gives a quick overview of which planets are transiting (or potentially transiting) right now.

A Transitsearch observer seeking to get a first detection of a transiting extrasolar planet still starts at a major disadvantage. The radial velocity survey teams all have in-house photometric observers who monitor their candidate stars prior to announcement, and they thus have first dibs on the stars that are most likely to pan out with transits. This vertically integrated strategy will continue to monopolize the detection of hot Jupiters like HD 209458b, HD 149026b, and HD 189733b that transit bright stars.

Ideally, we need to get an open-source dedicated radial velocity observatory up and running to really feed transitsearch and the systemic backend, and we are looking at avenues to make this happen. In the interim, however, we can tap the growing fit database on the systemic backend for suitable candidate planets that have not yet been published in the literature. There are a number of planetary candidates that have low false-alarm probabilities and are dynamically stable (see also here).

To get things started, I’ve taken two candidate planets — HD 19994 c and HD 216770 c — from the probable planet discoveries page on the backend wiki, and reproduced the fits on the downloadable console. With a fit in hand, it’s straightforward to use the bootstrap utility to compute errors on the orbital parameters, and to produce transit ephemerides and observing windows. These first two candidates are listed in a table on the Transitsearch website, and we’ll be adding many more potential planets in the near future:

HD 216770 “c”, for example, has a period of 12.456 +/- 0.019 days, and Msin(i)~60 Earth Masses. If it exists, it has a 3.1% chance of transiting, and would likely produce a transit depth of a bit more than 1%. The radial velocity data set for HD 216770 is several years old, and so the transit window has, frustratingly, widened to about 8 days.

Let’s try to identify additional candidates that are (1) dynamically stable, (2) have Msin(i)>0.05 Jupiter Masses, (3) F-test statistics below 0.2, and (4) periods less than 100 days. If you find them, add them to the backend wiki, or as comments to this post.

transitsearch dot org

Image Source.

Gl 436 b was the first planet to be detected in transit after the radial velocity detection of the planet itself was publicly announced. Gillon et al.’s discovery shows that the basic strategy of checking known Doppler wobble stars for transits can pay off dramatically, and indeed it’s recharged my interest in keeping transitsearch.org up and running.

Successful transit predictions depend on having accurate ephemerides, which in turn depend on fits to the most recent radial velocities available. The period error in an old fit builds up to the point where the predicted transit window is longer than the orbital period itself. Indeed, relying on a published fit that’s five, six, or even eight years old, is akin to showing up at the 2007 Grammy Awards in a 2001 Escalade.

We’ve thus started the job of making sure that the transitsearch.org candidate tables are as up to date as possible. I’ve committed to spending a bit of time each day checking and updating the master orbit.data and star.data files that are used as input to the cron job that runs every night to update the prediction tables. In each case, we’ll use the most recent published orbital data for a given planet.

In addition, the eighteen known transiting planets have all had their ephemeris tables updated using the latest literature values for the orbital parameters. I got the most of these data from Frederic Pont’s useful summary table, and took the radial velocity half-amplitudes from exoplanet.eu and exoplanets.org. At the moment, the occultations are all treated as central transits by my code, which means that the predicted transit durations will in general be longer than the actual observed events. This discrepancy will be patched shortly, but in the meantime, the predicted transit midpoint times in the ephemeris tables should be extremely accurate for all 18 planets. (See the candidates faq for more information).

We’ve made the decision to base the main transitsearch.org candidates table only on published orbital fits that have appeared in the refereed literature. In many cases, however, one finds a need to go beyond predictions based on published fits. There are two main circumstances under which this can occur. (1) The systemic console provides the ability to obtain fits to all existing radial velocity data for any given system. For many systems, one thus has the opportunity to obtain orbital parameters for the planet that are more accurate than published values that are based on fewer data sets. (2) You may have used the console to locate a candidate planet that is not yet published. If this planet can be observed in transit, then you’ve got dramatic confirmation of your discovery.

Eugenio has written an extension to the bootstrap window of the most recent version of the console that allows anyone to make transit predictions for any planet produced by the console. In an upcoming post, we’ll look in detail at how this new feature works.

The Weather Overground

Image Source.

Jonathan Langton is at the AAS meeting in Hawaii, and on Wednesday, he’s going to be presenting the results from his latest simulations. Let’s just say that the animations show some amazing weather patterns on the eccentric planets that receive strongly variable stellar heating. If you’re in Honolulu, then by all means make sure you catch his talk. [It’s during the Wed. 4:15-6:00 PM Extrasolar Planets Session in Room 319. Here’s a link to his abstract.]

A ten-minute talk is barely enough time to hit the highlights of the simulations; fortunately, the full story will be available shortly in a paper that we’re readying for submission.

HAT-P-2b will almost certainly be one of the planets that makes the cut. This world is vying with HD 80606b as the most interesting potential candidate for future observations with the Spitzer Space Telescope. Despite having a relatively short 5.63-day orbital period, the orbit is quite eccentric: e=0.50. Periastron occurs almost exactly midway between the primary and secondary transits, which gives the system an absolutely ideal geometry for Spitzer.

Click here for a high-resolution .eps version.

If you can’t make it to the talk, then make sure to check back here at oklo.org in a day or so. I’ll be posting the latest pictures and animations from the simulations, and we’ll have a detailed look HAT-P-2b’s remarkable predicted light curve.

e as in Weird

Image Source.

Gl 436 b orbits its parent star in a short 2.64 days, and the discovery of transits indicates that its physical properties are quite similar to Neptune. The theoretical expectation is thus completely clear cut. “That orbit is circular, Son. Tidal dissipation has long since damped out that eccentricity.”

The data, however, stubbornly insist otherwise. When I do a one-planet fit to the radial velocities (incorporating the constraint on the mean anomaly imposed by Gillon et al.’s observation of the transit midpoint) then the distribution of bootstrap fits indicates e~0.13 +/- 0.03:

[Note: Stefano and Eugenio have been cranking away on the downloadable console code base, and the current beta-test version on the backend now contains a slew of new features, including a revved-up Hermite integrator and the ability to incorporate transit timing observations into the orbital fits. The user interface has been completely overhauled in order to maintain usability with the rapidly expanding feature set. We’ll be putting up some posts very soon that demo all this bling. In the interim, though, I definitely recommend downloading a copy and taking it for a test-drive.]

The latest console version.

In this post from last week, I looked at the possibility that gl 436 b’s eccentricity is being maintained by as-yet unpublished planets. There’s a hint of a long-term trend in the data that indicates a large and distant companion.

The lowest chi-square fit to th gj437_M07K data set (by user Schneidi) reduces the magnitude of the long-term trend by using a pair of planets on 53 and 399 day orbits.

In Schneidi’s fit, the bulk of the perturbation on planet b is provided by the 53-day plant “c” which also has close to a Neptune mass. In last week’s post, I looked at this model in gory detail. If the 53-day planet exists, and if its orbital plane is aligned for transits, then the transit will occur around June 7th.

For two planets like Gl 436 b and c, which aren’t in mean-motion resonance, and which aren’t on crossing orbits, the long-term evolution of the orbits is well-described by an approximation worked out by Laplace and Lagrange in the 1770s. In the Laplace-Lagrange theory, the gravitational interactions between a set of planets are assumed to be effective over a “secular” timescale that is much longer than the orbital periods of the planets themselves. The planets can thus be treated as flexible elliptical wires of varying mass density (highest near apoastron where the planets spend more time, and lowest near periastron where the least time is spent). The planets are able to trade eccentricity back and forth while keeping their semi-major axes fixed (orbital angular momentum is exchanged, but not orbital energy).

Last week, I was wondering whether the secular interchange of eccentricity could provide a mechanism for b to offload angular momentum as it tidally dissipates its orbital energy. If such a mechanism were effective, then it might explain why b’s orbit is still eccentric.

To look at this, I used a “double averaging” approximation to do a long-term numerical evolution of the 2-planet system in the presence of tidal damping. With this approach, one uses the Laplace-Lagrange theory to advance the system forward over a secular timestep of hundreds to thousands of years. After each secular timestep, one then applies tidal dissipation (modify semi-major axis and eccentricity so as to decrease the energy of planet b while conserving its angular momentum). Then one takes another secular timestep, etc. This approach should provide a reasonable picture of the orbital evolution so long as the secular time scale (thousands of years) is much shorter than the tidal evolution time scale (millions of years or more).


The answer is immediately clear. The presence of a 53-day planet “c” doesn’t stave off tidal circularization. In the graph above, I’ve assumed a Neptune-like tidal Q of 10,000 for b. The high-frequency secular exchange of angular momentum is of no use for maintaining b’s eccentricity. The orbit is circularized on an e-folding timescale of ~10 million years — much shorter than the current age of the star.

Guess I’m just not hip to where b’s scoring its e.

z=0.6

Image Source.

Yesterday, the Texas group announced their discovery of a new two-planet system orbiting HD 155358. Assuming that they’ve drawn a more-or-less edge-on configuration, the inner planet has a bit less than a Jupiter mass and orbits the solar-type parent star in 195 days. The outer planet has about half a Jupiter mass and orbits in 530 days. Dynamically, the system is reminiscent of an overclocked Jupiter and Saturn (although the planets lie far enough away from the 5:2 commensurability so as to avoid the indignities associated with the great inequality).

The main angle on HD 155358 is the low metallicity. The star has [Fe/H]=-0.68, which means that its iron abundance is only 21% that of the Sun. It’s rare to find giant planets around a star that’s so anemic. What exactly happened that allowed HD 155358b and c to beat the odds by assembling cores and accreting enough gas to become full-fledged giant planets?

There were probably a number of contributing factors. HD 155358 may have had a relatively long-lived protostellar disk. In all likelihood, that disk was probably considerably more massive than average. Although HD 155358 is iron-poor, I bet it’ll turn out to be relatively overabundant in oxygen and silicon (that is, a core-accretion formation scenario would prefer supersolar [Si/Fe] and [O/Fe] for HD 155358, see here for more details). Giant planet cores are made from volatiles, and so it’s the oxygen, not the iron, that’s the critical element.

HD 155358, with its ~10 billion year age, and (possibly) enhanced [O/Fe] would be very much at home in a giant elliptical galaxy like M87.

Image Source.

At times, oklo.org likely seems rather provincial. The scope of discussion here rarely ranges beyond the distances of a few hundred light years that mark our local stellar neighborhood. It’s easy to forget that there are a hundred billion galaxies within our cosmological horizon. Each galaxy contains billions of planets.

A bruiser like M87 packs trillions of stars, many of which formed during the ferocious galactic mergers that occurred roughly 10 billion years ago at redshift z~2. (I like this Java applet for computing ages, redshifts and lookback times for the Universe as a function of fundamental cosmological parameters). Many of the stars in giant ellipticals have metallicities that are similar to or even greater than solar, and because older stellar populations tend to have higher [O/Fe], it’s nearly certain that collossal numbers of planets were forming during the epoch when the giant ellipticals were being assembled.

To the best of our knowledge, it takes 4.5 billion years from the epoch of planetary formation to the point where technology and directed information processing emerge. This means that when we look back at elliptical galaxies at redshift z~0.65, we’re seeing what may have been the Universe’s golden age — the time and the environment when the density of civilizations was the highest that it will ever be. What happened to them? Where are they now?

“With all possible expedition”

Image Source.

First, I squandered literally years of opportunity to coordinate a photometric follow-up transit search on Gl 436. Then I managed to incorrectly report the circumstances of the detection on the initial version of this (now corrected) oklo post! Naturally, I’m feeling sheepish, and my situation bears a distant echo to that of John Herschel (son of William), who was partly to blame for the inadequate coordination of an observational follow-up to John Couch Adams’ predictions of Neptune’s location.

Following the stunning news from the Continent of LeVerrier’s prediction and Galle’s successful detection of Neptune, Herschel likely realized at once that Neptune’s discovery would have gone to England had only he pressed Adams’ case more assiduously. In an October 1, 1846 letter to the London Athenaeum, Herschel hems and haws in a somewhat disingenuous effort to wriggle out of the uncomfortable situation that he had put himself in.

“The remarkable calculations of M. Le Verrier – which have pointed out, as now appears, nearly the true situation of the new planet, by resolving the inverse problem of the perturbations – if uncorroborated by repetition of the numerical calculations by another hand, or by independent investigation from another quarter, would hardly justify so strong an assurance as that conveyed by my expression above alluded to. But it was known to me, at that time, (I will take the liberty to cite the Astronomer Royal as my authority) that a similar investigation had been independently entered into, and a conclusion as to the situation of the new planet very nearly coincident with M. Le Verrier’s arrived at (in entire ignorance of his conclusions), by a young Cambridge mathematician, Mr. Adams; – who will, I hope, pardon this mention of his name.”

Herschel also wrote urgently to his friend William Lassell, a wealthy beer brewer from Liverpool, and a skilled observer who owned a fine 24-inch reflector. Herschel exhorted him to partially salvage the situation for himself and for Britain through a search for “satellites with all possible expedition!!”

Lassell began observing Neptune immediately, and within a week had spotted what was later confirmed to be Neptune’s satellite Triton. This, however, did little to assuage the court of British public opinion, and Challis, Airy, and Herschel were savaged for their inaction. “Oh, curse their narcotic Souls!” wrote Adam Sedgwick, professor of Geology at Trinity College.

[I culled these anecdotes from my favorite book on the topic of Neptune, Vulcan, LeVerrier and 19th-century dynamical astronomy; “In Search of Planet Vulcan — The Ghost in Newton’s Clockwork Universe” by Richard Baum and William Sheehan.]

Unfortunately, even with the exertion of all possible expedition, the detection of satellites orbiting Gl 436 b is a long shot. Large moons orbiting a planet only 0.02 AU from the parent star are almost certainly dynamically unstable (as shown here), and would, in any case, require exquisite photometry to detect. But one can, however, investigate the possibility that Gl 436 b might point the way toward other detectable planets in the system.

The first clue that Gl 436 might harbor more than one planet comes from planet b’s considerable, e~0.16, eccentricity. It’s surprising to find a P=2.644 day planet on a non-circular orbit. Given that its tidal quality factor, Q, is likely similar to Neptune’s, it should have circularized a long time ago — unless there’s a source of ongoing gravitational perturbation.

Gl 436 b’s high eccentricity means that, like Jupiter’s moon Io, it’s experiencing a lot of tidal heating. It’s internal luminosity is likely of order 10^20 Watts, which is in the rough ballpark of the amount of energy that the planet intercepts from the red dwarf parent star. Another interesting consequence of the non-zero eccentricity is that b will have a pseudo-synchronous spin period. That is, tidal forces will have forced the planet into a rotational period of 2.29 days, which allows it to optimally show one face to the star during periastron passage when the tidal forces are strongest. Jonathan Langton has done a simulation of the surface flow pattern (assuming a water-vapor atmosphere). The following 1.1MB animations (“eastern” view, and “western” view) trace two full orbits in the planet’s frame, and show the slow synodic drift of the baking daylit hemisphere.

If there’s a perturbing companion to Gl 436 b, then it’s a reasonable guess that it lies in roughly the same orbital plane, meaning that there’s a non-negligible chance of transit. It would certainly be nice if such a transit could be predicted in advance…

The first task is to look at whether the published radial velocity data set for Gl 436 gives any hint of additional planets. Going to the “Real Star” catalog on the systemic backend, and calling up the “gj436_M07K” dataset shows a wide variety of fits that have been submitted by systemic users over the past nine months:

Unlike the case of Gl 581c, there’s no particularly compelling evidence for a second planet. In sifting through the various fits that have been submitted, one finds that a second planet with a mass similar to Uranus and a period of 53 days is probably the most likely candidate perturber, and using the console, I find an unpublishably high false-alarm probability of 49% for a planet “c” with these properties. (The discussion boards on the systemic backend indicate that the systemic users have also arrived at this conclusion.)

On the other hand, however, a coin-flip isn’t half-bad odds, and what better low-stakes venue than a blog for an analysis? Let’s go ahead and assume that the 53-day candidate is really there.

At the current time, the console software isn’t configured to incorporate transit information into radial velocity fits. In particular, when one has a transit, one gets (1) an excellent determination of the period, and (2) an accurate ephemeris of the moment when the transiting planet and the parent star both lie on the line of sight to the Earth. Condition (2) provides a constraint on the fit that replaces the transiting planet’s Mean Anomaly as a free parameter. I have a Fortran code (that I wrote for an analysis of the orbit of HD 209458b) that handles this situation, and so I can carry out a self-consistent two-planet fit that takes advantage of the transit ephemeris for b reported in the Gillon et al. paper. This 2-planet fit (based on the 53-day Uranus suggested by the fits submitted to the systemic backend) has a chi-square statistic of 3.09, and an RMS scatter of 3.91 m/s. The orbital parameters of the planets are: P_b=2.64385d, P_c=53.57724d, e_b=0.1375, e_c=0.2281, omega_b= 347.999 deg, omega_c=185.146 deg, M_b=0.0697 M_jup, and M_c=0.0417 M_jup. The Mean Anomaly of the putative planet “c” at JD 2451552.077 is 100.69 degrees.

One would certainly prefer to see a beefier perturber for Gl 436 b. When I compute the Laplace-Lagrange 2nd-order secular theory for the above system (including the effects of general relativistic precession) I find that b’s eccentricity cycles between e_min=0.135 and e_max=0.160 with a period of 13,000 years. This is much shorter than the time scale for orbital circularization, but it’s not immediately clear to me whether the secular perturbations from c would be able to maintain such a large eccentricity for b over billions of years. Does anyone know the answer offhand? That is, if b and c both formed with sizable eccentricities, would the secular interaction prevent circularization by providing c with a mechanism to offload angular momentum?

In any case, if c is for real, and if its orbital plane is properly aligned for central transits, then they will occur on (all times UT):

ingress JD: 2454152.02 2007, Feb 20, 12:34
egress JD: 2454152.19 2007, Feb 20, 16:29

ingress JD: 2454205.60 2007, April 15, 2:24
egress JD: 2454205.77 2007, April 15, 6:24

ingress JD: 2454259.18 2007, June 7, 16:14
egress JD: 2454259.34 2007, June 7, 20:14

ingress JD: 2454312.75 2007, July 31 06:04
egress JD: 2454312.92 2007, July 31 10:04

I’m now doing a more detailed analysis to see if c can maintain the observed eccentricity of b over the long term. If it’s a go, then I’ll run a bootstrap calculation to determine the probable error on the above predictions. It might be useful, however, to mark down June 6th-8th on the calendar.

Follow-up Photometry

Water is a major component of Neptune

Image Source.

I’m still astounded by the dramatic detection of the transit of Gl 436b, and I’m working on some posts that sort through the scientific results and implications that this discovery is generating.

GJ 436b was found using the same basic strategy that led to the detection of the transits of HD 209458b, HD 149026b, and HD 189733b. First, the planet is located with the radial velocity technique. Doppler velocities, of course, do not give the inclination of the planetary orbit, but they do give a prediction of when transits would occur if the line of sight to the system lies within a small enough angle of the planet’s orbital plane.

Short-period planets have higher a-priori chances of being observed in transit (a 12% probability is typical for a hot Jupiter on a short-period orbit) and so in general, most of the RV-detected planets with orbits of less than a week are checked photometrically for transits by members of the discovery team before the planet is publicly announced. The discovery teams found the transits of HD 209458b, HD 1409026b, and HD 189733b. Dramatically not so, however, with Gl 436b.

Note: In the initial version of this post, I jumped to some incorrect conclusions about how the Gl 436 discovery was made. This article on swissinfo caused me to infer that the initial April 2nd detection of the transit was a postcard-perfect story of an independent small-observatory follow-up of the variety encouraged by transitsearch.org. It turns out, however, that the OFXB telescope is tightly linked to the Geneva program. The Gl 436 detection was made in the course of an ongoing systematic survey of the known planet-bearing M-stars and K-stars, and of as-yet unannounced new candidates discovered by HARPS and SOPHIE. Michael Gillon, lead author on the Gl 436 paper, and the lead scientist for the photometric follow-up effort was kind enough to correct my facts.

Scooped!


Image Source.

Literally seconds after I pressed the submit button on this afternoon’s TrES-3 post, the telephone rang. Eugenio.

“Did you see astro-ph? the Swiss have a transiting Neptune around Gl 436!”

I stayed up almost all night last night finishing my NASA PGG proposal, and so the cogs in my brain were turning rather slowly.

“Gl 436?” I asked, confused, “That doesn’t sound right. You’re sure it’s not Gl 674?”

But he was right. It is Gl 436 b that’s transiting, and this is easily the biggest planet-related discovery so far this year. New results from the Swiss team have been coming so thick and fast that it’s hard to even keep them all straight. Let me be the first to offer my heartfelt — and let’s admit it, envious — congratulations.

First, the hard facts that we’ve all been waiting for. The planet has a mass of 23 Earth-masses and an orbital period of 2.64385 days. It orbits a red dwarf star 33 light years away. The temperature on the planet is somewhere in the oven-cleaning neighborhood of 600K (327K, 620F). No habitability news stories on CNN for this fine fellow. The transit depth is a healthy 0.6%, which implies that the the planet’s radius is ~25,000 km. That’s four times that of the Earth, and essentially identical to the 24,764 km radius of Neptune.

The Neptune-like radius indicates that the planet is largely composed of water. This means that it formed beyond the snow-line in Gl 436’s protoplanetary disk and then migrated inward to its present location.

Remarkably, Gl 436b has been known for over two years. In the original discovery paper (on which yours truly was a co-author) there are a number of photometric observations of the star taken over a long period. When the data are folded at the orbital period of the planet, no transit was visible. It looks like systematic effects associated with the analysis of long-baseline photometry may have resulted in the baby being thrown out with the bathwater. In retrospect, that clump of points just to the right of the predicted transit interval may actually be the transit.

Lesson learned. Even if folded photometry shows no sign of a transit, it’s important to follow up with a time-series that covers an entire predicted transit window. This object is within reach of dozens of amateur observers, and it has been sitting in the transitsearch.org candidates table since 2004. Had I pushed for observations of this planet in the same way that we pushed for Gl 581 b and Gl 876 b and c, then we would have gotten it. But to the Victor belongs the prize, and I’m thrilled that this long-awaited Neptune-mass transiting planet has turned up.

The opportunities for follow-up on this discovery are enormous. First, the eccentricity of Gl 436 b appears to be alarmingly high. Single planet fits to the radial velocity data indicate e=0.16. The orbit, however, should have been tidally circularized quite a while ago. It’s likely that there’s additional perturbing bodies in the system. To get a discussion going, look at this fit by user flanker on the systemic backend. There’s an urgent need to start fitting this system to get multiple-planet fits that have (1) low chi-squares and (2) low F-test statistics for planets beyond the known transiting planet “b”. If you find a good fit, upload it to the backend.

Gl 436 should be placed under constant photometric surveillance. If you’re capable of doing sub-1% photometry, please get out there on the sky whenever the night is clear and Gl 436 is at low air mass. If there are additional planets in the system, then it’s completely possible that they are transiting as well.

In addition, it’s very important to collect the best possible time-series data for future Gl 436 transits. By timing when the transits occur, it will be possible to derive the orbital elements of significant additional perturbing bodies. This endeavor is within the reach of careful amateur and small-telescope observers.

And then there’s the Rossiter effect:

schematic diagram showing rossiter effect

Folding the downloadable systemic console‘s gj436_M07K dataset at 2.64385 days shows two points that have (possibly) had their velocities altered as a result of being taken during transit:

And finally, no more major discoveries this week, please! I’ve got to finish my Kepler Participating Scientist proposal to NASA, which is due on Friday.

A Year in a Day

Image Source.

Looks like this week is good for at least one new transiting planet. Francis O’Donovan (Caltech) and his collaborators have just announced the discovery of TrES-3 and it’s a hot property. The planet is nearly twice Jupiter’s mass, and has a radius about 30% larger than Jupiter. The most remarkable characteristic of the planet is its extremely short orbital period. Thirty one hours, twenty minutes and fifty five seconds. I’ve learned that shady Glenngary Glen Ross-type operators have begun promoting real estate on this planet. Don’t get suckered in! TrES-3 is undergoing orbital decay as a result of tidal evolution, and sooner or later it’s going to merge with its parent star.

TrES-3 exhibits a nice symmetry. The radius of the central star is 16.5% of the planet’s orbital radius, and the planet’s radius is 16.5% the radius of the star. The transit itself is practically a grazing transit, which leads to a bell-shaped light curve. As soon as this post goes up, I’ll add the ephemerides to the transitsearch.org candidates page. With a whopping 2.5% transit depth and a transit just about every day, this is a great starter world for Northern Hemisphere observers who want to bag their first extrasolar planet.

HAT-P-2b: SEVERE STORM WARNING

Jonathan Langton’s hydrodynamics code has just finished a simulation of the atmospheric dynamics on HAT-P-2b. The short orbital period and the high orbital eccentricity conspire to make this world the stormiest exoplanet found to date. This planet should definitely be observed before Spitzer’s cryogen runs out.

I’ll post our more detailed analysis, along with the predicted light curves in the various Spitzer bands very shortly. In the meantime, however, here are two animations (HATa.mov and HATb.mov) showing the temperature over the planetary surface. The temperature scale runs from a (comparatively) mild 950K to a scorching-hot 2170K. The animation runs through two orbital periods of the planet, and thus covers ~6 rotation periods. The animations are shown from the point of view of a camera fixed above one spot on the planetary surface, one above the “eastern” hemisphere, the other above the “western” hemisphere. They work best when looped. If you’re a connoisseur, please click here for a .pdf-format description of our numerical model.

Corot-Exo-1b

Image Source.

The CoRoT satellite fired off its first planetary dispatch today. Here’s a link to the CNES press release. It now appears that CoRoT has the photometric sensitivity to eventually reach down to planets of approximately Earth-size, and in the immediate near future, the mission stands a good chance at bagging the first discovery of a transiting sub-Neptune mass planet.

The prospect of seeing a 10-Earth mass planet in transit has everybody all worked up, and for good reason. The moment a transiting example of a planet like Gl 581 b (or c) turns up, then we’ll know whether it formed in-situ (in which case it’ll be small and thus made of rock and iron) or whether it migrated in from colder regions of the protoplanetary disk (in which case it’ll be relatively large and thus made mostly of water).

Here’s a slightly reworked version of the light curve accompanying the press release.

So far, there doesn’t seem to be such a thing as an “average” extrasolar planet. Nearly every new world that turns up has at least one unusual, completely unexpected characteristic. This week so far has been no exception. Hat-P-2b sports an extraordinarily high orbital eccentricity. X0-2b appears to have a very large complement of heavy elements, which gives it a comparatively high density and a comparatively small radius. CoRoT-Exo-1b is distinguished by its enormous size.

The CoRoT press release quotes a radius of 1.68 Jupiter radii for their 1.3 Jupiter-mass planet. The planet’s orbital period is short (only 1.5 days) and its surface temperature is high — probably ~1500-1800K — but its still quite a bit larger than the 1.45 Jupiter-radius that our models predict. A powerful internal heat source seems to be necessary to get the planet up to the large observed radius.

Or alternatively, the star may be somewhat smaller in size than the best-fit value. It’s notoriously difficult to get accurate radii for stars that don’t have parallax measurements.

Another HAT trick (plus XO-2b)

Image Source.

Man, when it rains it pours! This week’s big planet news is the announcement of a second transiting planet from the HATNet project.

HAT-P-2b orbits the bright nearby star HD 147506, which means that there will be all sorts of opportunities for detailed follow-up. For those who want to get in on the action, the midpoint of the next transit will occur at 3 PM on May 3rd (UT). The planet’s orbital eccentricity is a whopping e=0.5, the planetary mass is high (8 Jupiter masses) and the orbital period is a relatively long — for a transiting planet — 5.63 days. In fact, just about the only aspect of this world that isn’t remarkable is its radius. Preliminary indications are that the planet is 10-20% larger than Jupiter, exactly as theoretical models predict.

Had HAT-P-2b turned up on the scene with a large radius a la HD 209458b, or with a small radius (such as that observed for HD 149026b), then it would have signaled that something is seriously awry with our understanding of planetary structure. The interior of an 8-Jupiter mass planet is dominated by electron degeneracy pressure, which leaves little room for large variations in the planet’s overall size. It doesn’t matter if there’s tidal heating. It doesn’t matter if there’s a 50-Earth mass core. The radius of an 8-Jupiter mass planet should maintain a zen-like lack of perturbation in the face of all that optional bling that causes lesser planets to run off track. It’s thus very reassuring to see that HAT-P-2b is meeting its radial obligation.

The weather on this planet is going to provide an amazing opportunity for Spitzer. Even as I write this, our processors are roaring to the tune of a full-scale hydrodynamical simulation of the flow patterns on the surface.

UPDATE: I put this post up, went to bed, and woke up to news of yet another transiting planet, XO-2b. See the Extrasolar Planets Encyclopaedia, and the astro-ph preprint. In this case, the planet, which has a mass of 0.6 Jupiter masses and an orbital period of 2.6 days, seems to have a sub-Jovian radius, suggesting a 20-40 Earth mass core of heavy elements. A heavy burden of heavy elements in this case is not too surprising, given that the V=11 K0V parent star has a metallicity nearly three times that of the Sun.

I see that transitsearch.org veterans Ron Bissinger, Mike Fleenor, Bruce Gary, and Tonny Vanmunster are all on the author list of discoverers, Congratulations, guys!

Gliese 581 c (confirmed!)

Gl 581 c

Image Source.

Big news today from the Geneva extrasolar planet search team. Using the HARPS instrument at La Silla, they have announced the detection of an Msin(i)=5 Earth Mass planet orbiting the nearby red dwarf Gliese 581. The planet has an orbital period of 12.9 days, which places it squarely within the habitable zone of the parent star.

The planet probably migrated inward to its current location from beyond the “snowline” in GL 581’s protostellar disk, and so its composition likely includes a deep ocean, probably containing more than an Earth’s mass worth of water. Atmospheric water vapor is an excellent greenhouse gas, so the conditions at the planet’s atmosphere-ocean boundary are probably pretty steamy. It’s also possible, however, that the planet formed more or less in-situ. If this is the case, it would be made from iron and silicates and would be fairly dry. It’s unlikely, but not outside the realm of possibility, that this could be a genuinely habitable world. There’s no other exoplanet for which one can make this claim. In short, it’s a landmark detection.

In 2005, the Geneva team announced the detection of a Neptune-mass planet in a 5.366-day orbit around the star, and they published 20 high-precision radial velocities in support of their detection. These radial velocities have been in the systemic backend database since last summer, and so naturally, when today’s detection was announced, I was eager to see the models that our users have submitted for the Gl 581 planetary system.

The six submitted fits with the lowest chi-square for the system — by flanker (fits 1,2), EricFDiaz (fits 3,5), eugenio (fit 4), and bruce01 (fit 6) — all contain both the known 5.366 day planet as well as a planet with properties (Msin(i)~5 Mearth, P~12.2 days) that are a near-match to the newly announced planet. In the following screenshot, I’ve highlighted Gl 581 b in blue and the newly confirmed Gl 581 c in light orange.

Eureka!

Congratulations, Gentlemen. You made the first public-record characterizations of the first potentially habitable planet detected from Earth.

I’ve gone on record a number of times to emphasize that I have no interest whatsoever in priority disputes regarding who discovered what. It’s a forgone conclusion that the Swiss should receive all of the credit for their detection. The F-test false alarm probability for the Gl 581 c signal based on the 20 originally published velocities is ~25%, and there are thousands of planets that have been submitted to the systemic backend that don’t actually exist. Nevertheless, the systemic users can take a genuine pride in knowing that they were among the first on Earth to sense the existence of this extraordinary new world. I can’t resist dusting off Sir John Herschel’s ringing exhortation to the British Association of the Advancement of Science on Sept. 15, 1846, two weeks prior to the discovery of Neptune.

“The past year has given to us the new [minor] planet Astraea; it has done more – it has given us the probable prospect of another […] Its movements have been felt, trembling along the far-reaching line of our analysis with a certainty hardly inferior to ocular demonstration”

The Perfect Storm

null

Image Source.

Most of the hot Jupiters with periods that last less than a week have orbits that are nearly circular. Tidal dissipation in a body on a short-period eccentric orbit is very strong. The net result of tidal dissipation is that energy of orbital motion is turned into heat. Io is the poster-world example of this phenomenon in our solar system.

There are, however, two hot Jupiters — HD 118203b and HD 185269b — that have orbital periods of less than a week, and eccentricities, e~0.3. Indeed, a quick glance at the radial velocities for HD 185269 phased at 6.838 days shows that the variation is not a perfect sinusoid.

With its eccentricity of 0.3, HD 185269b should have long since been delivered into a state of spin pseudosynchronization, in which it spins roughly three times on its axis for every two trips around the parent star. This state of affairs prevents a steady state flow pattern from developing, and hence the weather on this world is likely to be much more interesting than on your standard-issue tidally circularized hot Jupiter. Furthermore, the amount of energy absorbed by the planet is 345% greater at periastron than at apastron, which will also contribute to a strong “seasonal” variation during the planet’s 6.838-day year.

HD 185269b was discovered by John Johnson, who has been carrying out a radial velocity survey of luminous Hertzsprung-gap stars (discovery paper here). The stars in his survey are more massive than the Sun, and are in the midst of ending the core hydrogen-burning phase of their life cycles. They’re in the process of turning into red giants, and are thus cool enough to be profitably observed with the Doppler radial velocity technique. (See this post for more on John’s survey and its implications). HD 189269 is about four times more luminous than the Sun, and so the surface of the planet should average out at ~1300 K, which is quite hot, even for a hot Jupiter.

UCSC graduate student Jonathan Langton has been making great progress in his hydrodynamical calculations of the global surface flows on extrasolar planets. His code (which he’s written from scratch during the past year) now has a more sophisticated scheme for time-dependant radiative transfer, and is ideal for simulating the weather on planets like HD 185269b, and HD 80606b that are subject to strongly varying fluxes of radiation. We’re getting close to submitting a paper on his research, which will have predicted light curves for all of the known planets that are potentially bright enough to be observed with the Spitzer Space Telescope.

Here’s a sequence of images (each spaced by a bit more than a day) which show the global weather map for HD 185269 b as computed by Jonathan’s code. The view is from a camera that hovers above a fixed spot on the surface, and thus rotates with the planet. The color-scale is chosen to roughly approximate what the eye might see in the absence of clouds in the atmosphere. The brightest yellow regions have a temperature of ~1500K, and the coolest regions are down at ~900K. In this approximation, it’s best to think of the planet as a gigantic transparent molten marble.

In the third frame, we’re getting a good view of the heating that occurs on the hemisphere of the planet that is subject to the brunt of the insolation delivered during the periastron passage. The rapid heating of the atmosphere drives an intense global storm that is still shedding vortices and dissipating when the next wave of heating begins to hit.


It’s quite a fascinating flow, and it’s best visualized if you take the time to download the animations. Here are links to the movies: The first movie animates the temperature of the flow pattern for a full 6.838-day orbital period as viewed from a camera placed above the eastern hemisphere, and the second movie animates the temperature of the flow pattern for the same period from a camera placed above the western (opposite) hemisphere. These are 1.2 MB .avi format files. Run them on loop for a groovy lava lamp effect, and better yet, place them near a copy of the downloadable systemic console to make your desktop look like self-contained Institute for Exoplanetary Studies.

If the above .avi files don’t play on your machine, you’ll likely need to download the Xvid component for QuickTime (or an appropriate player for your OS). They are available here, and are trivial to install on Mac OSX 10.4 (Thanks for pointing me to the link, Andy!) If you can’t get the animations to play, here are links to the original .avi files for the first movie and the second movie. These are 41 MB .avi format files. I’ve put them on the UCO/Lick Server in order to keep our friends at Bluehost from wigging out and going into overload mode…

In the zone

Image Source.

No word yet on whether anyone flew down to Tahiti last Monday to observe GJ 674.

For Northern Hemisphere observers who want some action closer to home, there’s a cool opportunity to check HD 80606b for transits starting essentially right now.

HD 80606b is a favorite here at oklo.org (see e.g. here). The planet went through periastron passage last week, and is now just on the verge of inferior conjunction with the Earth. The a-priori geometric odds of observing a transit are 1.6%. In 2005, transitsearch.org ran a campaign on the star, and while some useful photometry was obtained, the entire transit window was not covered. If HD 80606b happens to show central transits, then the duration of the event will be ~18 hours and the photometric depth will be ~1.4%. At any one location on Earth, one would be able to observe only the ingress or the egress.

The best fit to the published radial velocity data indicates a mid-transit time of 11:07 April 17, 2007 UT. This midpoint is uncertain by roughly half a day, which means that observations starting now and ending on April 18th will be useful.

Bali Hai

No word yet on whether that newly discovered 11 Earth-mass (and possibly rocky) planet orbiting GJ 674 is transiting or not.

The next opportunity is coming up on April 11th 13:17 UT. Given GJ 674’s location in the sky at RA 17:29, Dec -46 54, the South Pacific has by far the best view of the next event. Anyone willing to jump on the next plane to Tahiti with a Meade LX200 and an SBIG ST-7 in their checked baggage?

The current Tahitian weather forecast for the transit window calls for scattered clouds with a 20% chance of rain:

Not exactly the best conditions for obtaining 0.5% photometry, but not completely hopeless, either. I’m interpreting the current forecast as indicating there’s a 1/3rd chance that the weather will be cooperative. This means that if you fly to French Polynesia and set up your telescope in the hotel parking lot, you’ve got a 1 in 60 shot at walking away with the biggest exoplanet discovery of the year.

Even at 60:1 odds, there’s a case to be made that the trip is a good investment. According to the CoRoT website, the CoRoT satellite will detect “a few tens” of large rocky planets for a price tag of roughly 100 Million USD. That’s ~3 million per large rocky transiting planet.

A trip to Tahiti tomorrow, on the other hand, costs out at under 4K, and involves a more clement destination than Baikonur. In fact, when I dialed up a spur-of-the-moment expedition on expedia, I was informed that the price had just gone down:

The expectation value for the Tahiti mission, therefore, is a comparative bargain at $240,000 per transiting planet.

Assuming that you can show up at LAX by ~10pm this evening (Monday) a direct flight on Air Tahiti Nui gets you in to Papeete at 5:10 Tuesday morning. There’s plenty of time to grab a taxi to the luxe Le Meridien Tahiti, where you can take a refreshing nap in your “over water bungalow” set on one of Tahiti’s few sand beaches. Follow your late afternoon dip in the pool with dinner at Restaurant Le Carre, with its trendy atmosphere and refined A la carte dishes. After dinner, there’s still plenty of time for drinks at the L’Astrolabe Bar, where they’ll likely pick up your tab while you regale the hip-yet-distinguished clientele with astronomical bon mots. Indeed, you’ll likely have an admiring circle of new-found friends as you set up your scope in the parking lot and expertly obtain darks, flats, and baseline photometry, prior to observing well into astronomical twilight.

It’ll then be time to retire to your bungalow for some well-deserved rest. You’ll have the rest of the week to analyze your data and hopefully send that discovery e-mail to the IAU. It’ll be impossible for anyone on Earth to scoop your discovery until the next transit window on April 16th, at which point you’ll be flying home (having upgraded to first class for the long-haul flight back to LA).

What’s that you say? No money for your trip? No Problem. As soon as the market opens this morning, just write a few at-the-money April calls on a precariously high-flying tech stock to raise the necessary cash.

GJ 6-7-4

Image Source.

Word up! Chalk a jet-fresh Neptune on the boards — the Swiss’ve done it again.

The red dwarf GJ 674 lies 14.67 light years away. Minus 49 Dec. Only 53 known stars are closer to the Sun, and at V=9.382, GJ 674 is slightly more than twice as bright in the optical as its far more famous cousin GJ 876. With ~35% of the Sun’s mass, it’s packing more heat as well.

According to the Bonfils et al. discovery preprint posted to astro-ph yesterday, GJ 674 is accompanied by a sub-Neptune mass planet on a 4.6938 day orbit. Bucking the recent trends, the paper doesn’t contain a tabulation of the radial velocities. Eugenio, however, made dextrous use of the Dexter to scrape them off the figures, and they’re now safely packaged into the downloadable Systemic Console. The star has also been added to the “Real Stars” catalog on the Systemic Backend. The internal errors on the velocities are mostly below 1 m/s, which is impressive, given that each data point is based on a 15-minute integration of a rather dim star.

This discovery is a exciting for several reasons. Most immediate, is the fact that the planet does not yet seem to have been fully followed up photometrically to check for transits. At first glance, such an effort might appear to be hampered by the fact that the star is young enough to show significant photometric variability in synch with its 35-day rotation period. A central transit, however, would have a duration of only ~80 minutes — much shorter than starspot-induced variations — and would generate a clearly detectable dip of at least ~0.5% photometric depth.

Transitsearch.org has observers in Australia, South Africa, and South America, and so I’m hoping that they can quickly take advantage of this opportunity. The next transit window is centered about 15 hours from now, on April 06, 2007 at 20:38 UT. Here’s looking at you, Perth. The ephemeris table showing all the upcoming opportunities is at transitsearch.org. Based on a radius estimate for the star of 0.35 solar radii, the geometric transit probability is ~5.0%. Roll that twenty-sided die.

It’s fair to say that the next major discovery in the exoplanet game will likely be the detection of transits of a short-period Neptune-mass planet. Quite a few players are scrambling to be the first in the door. If it isn’t done from the ground during the next 6-months, then it’s likely that CoRoT will take the prize.

There’s a large difference in radius between sub-Neptune-mass planets made from rock and iron and sub-Neptunes composed mostly of water:

A Neptune transiting one of the brightest M-dwarfs in the sky would be a huge big deal. Hundreds of citations, Dude. Even if there’s no transit, this planet will likely be an excellent candidate for observation in the long-wavelength Spitzer bands, and fortunately there’s one more GO cycle before that cryogen runs out.

HD 118206…

Image Source.

Most hot Jupiters have orbital eccentricities near zero because the tidal forces exerted on them by their parent stars are strong enough to rapidly circularize their orbits. Any planet whose orbit has been circularized should also be spin-synchronous, and so like our Moon with respect to the Earth, it should turn on its axis once every trip around the star. Synchronicity lends each hot Jupiter a permanent day and night side. This likely imparts a profound effect on both the planetary weather, and on the brightness of the planet when viewed in the infrared at different orbital phases.

All of the planets observed so far with the Spitzer Space telescope have nearly circular orbits, and hence are in (or are very near) the spin-synchronous state. We’re waiting to hear the results of our Spitzer GO-4 application to observe the highly eccentric planet HD 80606b, during an upcoming ‘606 day. If our observing proposal gets a thumbs-up, it’ll dramatically broaden the range of conditions under which planets have been observed. Very shortly, I’ll be posting the results of calculations that Jonathan Langton and I have been doing which predict what the light curve of HD 80606 should look like during the periastron passage in the various Spitzer bands. Here’s a sneak preview of how the temperature distribution on the planet might evolve over a 36-hour period as seen from a direction consistent with our line of sight from the Earth:

In looking over the latest officially published additions to the catalog of extrasolar planets, I noticed that there’s a very interesting object — HD 118203b — that straddles the extremes of the circular hot Jupiters and the ultra-eccentric HD 80606b. This planet was discovered in 2005 by the Swiss Team, has an orbital period of 6.13 days, a mass at least twice that of Jupiter, and a well-determined eccentricity, e=0.3. HD 118203b therefore won’t be spin-synchronous. Rather, as is also the case with HD 80606b (see the diagram here), it’ll have been forced into a state of pseudo-synchronous rotation, in which it does its best to keep one face toward the star during the periastron passage. Its day should be 64.8% as long as its year:

Higher resolution .eps version here.

Which raises a rather interesting question: Why is HD 118203’s eccentricity so high?

Assuming that the planet has a similar structure to Jupiter, the equations of tidal dissipation (see here for a discussion) indicate that the planet’s orbit should circularize in a mere 10-20 million years. This time scale is surprisingly short because the parent star is a subgiant with a radius ~1.5 times larger than the Sun. Something must be exerting a very strong perturbation to keep this planet’s e up.

In their discovery paper, Da Silva et al remark that the residuals around the best 1-planet Keplerian fit to the data are very large. It’s quite straightforward to verify this with the downloadable Systemic console (try it!) Da Silva and company were able to improve their fit by including a linear drift of 49.7 meters per second with their one-planet model. This corresponds to adding the effect of an outer planet that has been observed for only a small part of a single orbit. (The 43 published velocities span a period of 1.1 years.) They speculate that an outer as-yet-uncharacterized planet provides the gravitational perturbation that maintains the high eccentricity for the inner planet.

Last year, Fred Adams and I wrote a computer code (see these papers 1, 2) that includes the effect of general relativistic corrections on long-term planet-planet gravitational interactions. It’s easy to use this program to calculate what the long-term influences of various companion planets would have on HD 118203 b’s eccentricity. I ran a few trial cases, and quickly found that the interactions produced by companions that also provide the observed linear drift in the radial velocities don’t seem to be strong enough to explain HD 118203b’s high eccentricity. Could there be another explanation?

This is the sort of situation where the collaborative systemic back-end is extremely useful. I had a look at the stable fits that have been submitted so far for HD 118203. The best stable, self-consistent fit was uploaded back in October by the user Flanker, and has a reduced chi-square statistic of 1.96:

null.

This fit might point in an interesting direction for some further inquiry. Instead of using a linear trend to soak up the residuals to the one-planet fit, Flanker added two additional planets. One of the planets has a mass of 0.3 Jupiter masses and is orbiting with a period of 15 days. Its periapse is nearly aligned with the periapse of the inner planet. The resulting short-period secular interaction may well be strong enough to keep the eccentricity of the innermost planet high in the face of tidal dissipation. Flanker’s model also contains an outer planet with an orbital period of 244 days and a minimum mass 0.6 times that of Jupiter.

I think it’s worthwhile to explore additional models for this system that contain planets with short enough periods to intereact strongly with the 6.13 day planet. If the perturbing body has a relatively short-period orbit, then its presence will not be hard to verify with additional radial velocity observations of the star. And also, if Spitzer’s cryogen holds out, HD 118203b might be a very interesting target for a full-phase campaign.

This week’s crop

Image Source.

The year 2007 is off to a reasonably good start. Three more planets were announced by the Geneva Planet Search team at a conference in Chile, bringing the total planet crop for ’07 up to seven.

The rate of planet discovery, however, has definitely leveled off. For the past four years, the detection rate has remained fixed at 26 new planets per year. The low-hanging fruit — the 51 Pegs, the 47 Ursae Majorii, the Upsilon Andromedaes — have all been harvested from the bright nearby stars, and increasingly extractive methods are being brought to bear. Transits are starting to contribute significantly to the overall detection rate. Radial velocity is pushing to planets with progressively lower masses. Surveys such as N2K are rapidly screening metal-rich stars that have high a-priori probabilities for harboring readily detectable planets. The neccessity of finding more planets is driving up the average metallicity of the known planet-bearing stars:

The three new planets, HD 100777b, HD 190647b, and HD 221287b are quite ordinary as far as extrasolar planets go. They all have masses somewhat greater than Jupiter, and they all take more than a year to orbit their parent stars. Their discovery seems not to have registered with the news media:

HD 100777 b, however, is actually deserving of some attention. Its orbital period of 383.7 days places it squarely in the habitable zone of its parent star. The eccentricity, e=0.36, is fairly high, and likely leads to interesting seasonal effects in the atmosphere of the planet.

HD 100777 b lies a regime where we expect to see white water clouds forming in the visible atmosphere. The planet is probably very reflective in the optical region of the spectrum (quite unlike the hot Jupiters, which are likely cloud-free, and which are known to absorb almost all of the starlight that strikes them). Convection of interior heat to the surface of HD 100777b is almost certainly driving collossal thunderstorms, and the atmospheric disturbances created by the thunderstorms likely feed giant vortical storms similar to Jupiter’s great red spot.

It’s also possible that the atmosphere is much clearer in regions where air wrung dry by rainfall is downwelling. This phenomenon occurs on Jupiter, where highly transparent patches occur over several percent of the Jovian surface:

Image Source.

The Galileo entry probe went right into one of these regions, and sampled very dry air. On HD 100777, the regions of high atmospheric transparency will probably preferentially absorb red and green light (as a result of Rayleigh scattering of incoming photons). The surface, then, in the vicinity of a downwelling region may look something like this:

The exoplanet prediction market

Image Source.

At first glance, the market capitalization of the Chicago Board Options Exchange, and the list of astronomers active in the field of extrasolar planets would appear to have nothing to do with one another. These two disparate entities are connected, however, by the fact that they’ve both undergone explosive growth over the past decade, and both are continuing to grow. They signify highly significant societal trends.

I think it’s safe to predict that in 25 years, the market for financial derivatives, and the level of economic activity associated with exoplanets will both be far larger than they are now. It’s interesting to ask, will there be an unanticipated co-mingling between the two? And if so, how will it occur?

One very realistic possibility is the development of an exoplanet prediction market, in which securities are issued based on particular fundamental questions involving the distribution of planets in the galaxy. Imagine, for example, that you’re an astronomer planning to devote a large chunk of your career to an all-or-nothing attempt to characterize the terrestrial planet system orbiting Alpha Centauri B. In the presence of a liquid, well-regulated exoplanet prediction market, you could literally (and figuratively) hedge your investment of effort by taking out a short position on a security that pays out on demonstration of an Earth-mass planet orbiting any of the three stars in Alpha Centauri.

Prediction markets have been adopted in a very wide range of contexts, ranging from opening weekend grosses for big-budget movies, to forecasts of printer sales, to the results of presidential elections. A highly readable overview of these markets by Justin Wolfers (who was featured last week in the New York Times) and Eric Zitzewitz of the University of Pennsylvania is available here as a .pdf file. The ideosphere site contains a wide variety of markets (trading in synthetic currency) and includes securities directly relevant big-picture questions in physics, astronomy and space exploration. Here’s the price chart for the Xlif claim,

which pays out a lump-sum of 100 currency units if the following claim is found to be true:

Evidence of Extraterrestrial Life, fossils, or remains will be found by 12/31/2050. Dead or extinct extraterrestrial Life counts, but contamination by human spacecraft doesn’t count. (Life engineered or created by humans doesn’t count.) The Life must have been at least 10,000 miles from the surface of the Earth. If Earth bacteria have somehow got to another planet and thrived, it counts, as long as the transportation wasn’t by human space activities.

It’s very interesting to compare the bullish current Xlif price quote of 72 with the far more bearish sentiment on Xlif2, which is currently trading at an all-time low of 17,

and which pays out if “extraterrestrial intelligent life is found prior to 2050”, and more specifically,

Terrestrial-origin entities (e.g. colonists, biological constructs, computational constructs) whose predecessors left earth after 1900 do not satisfy this claim. If the intelligence of the ET is not obvious, the primary judging criteria will be either a significant level of technological sophistication (e.g. radio transmitting capability) or conceptual abstraction (e.g. basic mathematical ability). Radio signals received or similar tell-tale signs of intelligence (e.g. archeological discoveries) detected and accepted by scientific consensus as originating from intelligent extraterrestrials would satisfy the claim even if not completely understood by the claim judging date.

Recently, open-source software has been released that makes it straightforward to set up a prediction market. We’ll soon have the world’s first exoplanet stock market up and running right here at oklo.org. In the meantime, feel free to submit specific claims (in the comments section for this post) that might lend themselves to securitization…

Lonely Planet Guide to the Hyades

Image Source.

It’s been a hectic week, and now that it’s February, my New Year’s resolution to write 2-3 posts per week managed to lose its shaky option on my priorities.

Eugenio stopped by my office this afternoon to outline his latest code developments for the console. He’s mostly finished implementing a Bulirsch-Stoer integrator. Once this algorithm is tested and operational, it will produce very significant speed-ups for the fitting and the stability analysis of tough multiple-planet systems such as 55 Cancri and GJ 876. Then it’ll be on to a rollout of the bootstrap method for computing uncertainties for the orbital elements in the planetary fits.

“So did you see the new planet?” he asked.

“Huh?” I hadn’t heard anything about it.

Turns out that Bunei Sato and his collaborators have detected a periodic radial velocity variation for the star Epsilon Tauri. Their preprint is on the Astrophysical Journal’s website, but it doesn’t seem to have hit the preprint server yet. This star is a prominent member of the nearby Hyades cluster, and is easily visible to the naked eye as part of the well-known “V”-shaped asterism near Aldeberan in the sky.

Image Source.

Eps Tau is bright enough to have garnered 40 different names in the Simbad catalog, and it’s now listed in the console menu and on the systemic backend as HD 28305. This is one of the most straightforward radial velocity datasets that you’ll come across, and thus makes a good system for first-time users to fit. A few debonair moves with the downloadable console conjure up a model planet with a period of 594 days, an orbital eccentricity e=0.15, and a minimum mass 7.6 times that of Jupiter:

Epsilon Tauri is one of the four stars in the Hyades that are currently nearing the end of their lives and are evolving through the red giant phase. It’s 14 times larger than the Sun, and it’s luminosity is 97 times the solar value. It weighs in at 2.7 solar masses, making it the most massive star known to harbor a planet.

So what’s the story? The Hyades are a metal-rich cluster. One would naively expect that the supersolar composition of the precursor star-forming giant molecular cloud would have lead to a large fraction of the cluster members harboring readily detectable planets. It’s also true that stars somewhat more massive than the Sun should harbor a higher-than-average fraction of giant planets. Eps Tauri scores on both counts.

[Note: John Johnson‘s thesis work at UC Berkeley and Bunei Sato’s RV survey are both capable of providing observational support for the hypothesis of a positive correlation between the detectable presence of a planet and the mass of the parent star. See talk #1 on the Systemic Resources page for more details.]

Young Cluster NGC 3603, Source: NASA

It’s important to keep in mind, however, that a cluster environment will have a strong effect on giant planet formation. Currently, the Hyades are 600 million years old, and the cluster has lost a large fraction of its O.G.s to the general galactic field through the process of dynamical escape. If we extrapolate back to the cluster’s early days, we find that the Hyades would have resembled the Pleiades 500 million years ago, and would have looked like the Orion Nebular Cluster during the first few million years of its existence.

The UV radiation environment in the original Hyades cluster was fierce. The protostellar disks of the individual Hyads were likely photoevaporated before the growing planetary cores were able to reach the runaway gas accretion phase that gives rise to Jupiter-mass planets (see our paper on this topic). When we get the full inventory of planets in the Hyades, I think we’ll find plenty of Neptunes and terrestrial planets, but almost nothing in the Jovian range. Indeed, work by Bill Cochran and the Texas RV group has demonstrated that the Hyades are generally deficient in massive planets.

My guess is that Epsilon Tauri b is an example of a planet that formed through the gravitational instability mechanism. Gravitational instability should generally produce more massive planets (e.g. HIP 75458 b, and HD 168443 b and c) and its efficacy will be little-affected by UV radiation from neighboring stars. It likely occurs once per every several hundred stars that are formed, and so it’s perfectly reasonable that there’s one star in the Hyades that has a planet formed via the GI mechanism.

For more information, this series: 1, 2, 3, 4, 5, 6, and 7
of oklo posts compares and contrasts the gravitational instability and core accretion theories for giant planet formation.

hot and bothered

Image Source.

When an extrasolar planet transits its parent star, we get the opportunity to learn the physical size of the planet by measuring how much of the star’s light is blocked during the occultation. To date, fourteen extrasolar planets have been observed in transit, and the big surprise is that they have a much wider range of sizes than astronomers had predicted.

Five for the show

HD 149026 b, for example, is more than 30% smaller in size than one would expect. Its dense, dimunitive stature is thought to stem from a ~70 Earth-mass core of elements that are heavier than the hydrogen and helium that dominate the composition of most of the known extrasolar planets. HD 209458 b, on the other hand, is roughly 30% larger than predicted. The reason for its bloated condition isn’t fully clear, but it’s believed that the planets with larger-than-expected radii are tapping an extra source of internal heat that keeps them eternally buff.

A lot of astronomers are currently interested in the size question for the extrasolar planets, and we’ve written a number of oklo.org posts that cover the subject. [See 1. here, 2. here, 3. here, 4. here, 5. here, 6. here, 7. here, 8. here, and 9. here.]

Josh Winn (MIT) and Matthew Holman (Harvard-Smithsonian CfA) have written a paper that presents an interesting hypothesis for resolving the HD 209458 b radius dilemma. Winn and Holman propose that the planet is caught in a so-called Cassini state, which is a resonance between spin precession and orbital precession. In short, if HD 209458 b is trapped in the “Cassini state 2”, then its spin axis will lie almost in the orbital plane. Like all short-period planets, the planet will spin once per orbit, but it will literally be lying on its side as it circles the parent star. A hot Jupiter in Cassini state 2 will easily experience enough tidal heating to maintain a 30-percent pump.

If a planet is in Cassini state 2, then the pattern of illumination on the surface is rather bizarre. At the north and south poles, the parent star rises and sets once per orbital period, and at mid-day passes directly overhead in the sky. This contrasts with the two locations on the equator from which the parent star never rises above the horizon, and the two other spots from which the star never quite sets. Here are two short .avi format animations that help to illustrate the situation. In the first animation, we hover above the point on the equator that receives maximum illumination. In the second animation, we hover above the point on the equator that receives the least illumination.

I’ve been working with UCSC physics graduate student Jonathan Langton to model the surface flows on extrasolar giant planets. As a first research problem, we made simulations of what the surface flows might look like on a planet in Cassini state 2, and compared them with the flows on a planet in Cassini state 1. Jonathan has just had his paper accepted by ApJ Letters. It should show up on astro-ph very shortly, but in the meantime, here’s a link to the .pdf file for the accepted version.

The results of Langton’s simulations are interesting. If the planet is in the standard-issue Cassini state 1, then a steady-state flow-pattern emerges on the planet, with the hottest temperatures occuring eastward of the substellar point, and the coldest region lying near the dawn terminator of the night-side:

If the planet is in Cassini state 2, then Langton’s model shows that a periodic flow pattern emerges which repeats every orbital period. In the figure below, each successive frame is advanced by 1/4th of an orbital period. The top row of images corresponds to an equator-on view, and the bottom row of images corresponds to a pole-on view:

It’s interesting to watch the animations of the temperature flows. Here’s a link to the equatorial view (5.7 MB, .avi format).

Event though the surface flow patterns are quite different in Cassini State 1 and Cassini state 2, the overall light curves as viewed from Earth don’t show much diffence. The figure below shows infrared emissions from the planet over one full rotation period. The blue line shows the Cassini state 1 light curve, the red line shows the Cassini state 2 light curve. These two curves are more similar to eachother than they are to the Cassini state 1 light-curve predicted by Cooper and Showman (2005), who used a different simulation method and a different set of assumptions, and got a larger overall variation in the predicted infrared emission from the planet during the course of an orbit:

It will be tough to use the Spitzer telescope to reliably distinguish which Cassini State the planet is in.

stability

Image Source.

If you’re a new visitor to the site, welcome aboard! Yesterday’s post talks about the systemic collaboration, and gives an overview of how you can participate.

The interpretation of radial velocity data sets is confounded by the existence of many different model planetary systems that all do a good job of fitting the data from a given star. If you really want to know whether a particular fit is the correct interpretation of the system, then you need to wait for (or make) more observations to see if your fit’s predicted radial velocity curve is confirmed.

For a real planetary system orbiting a real star, it can take years for enough confirming observations to be made, and so it’s useful to have as many criteria as possible for evaluating whether a particular fit is a contender. Orbital stability provides one such criterion.

On the backend, there are many orbital models that have been submitted that give excellent fits to the given data sets. For example, the four configurations shown in the picture just below are all acceptable models for the 14 Her system.

One immediately notices that these orbital configurations look “crowded”. The orbits make close approaches and sometimes even cross. If we let these model systems run forward in time, then we find that the mutual gravitational pulls between the planets lead to catastrophe within a few decades or less. Instead of behaving in an orderly fashion, the orbits execute motions like this:

which lead inevitably to collisions and ejections. While it’s theoretically possible that we happen to be observing a particular system just before it experiences disaster, Occams razor strongly suggests that wildly unstable fits are likely spurious. We can safely exclude any configuration that lasts for only a tiny fraction of the stellar ages (which are generally in the 2-10 billion year range).

Participants in the systemic collaboration can evaluate the stability of their models by using the “check long-term stability” function on the console. Stefano has also recently implemented a robot that crawls through the systems residing in the backend database and integrates all of the submitted fits. So far, it has sorted out which systems are unstable on timescales of less than a century, and as time goes on, it’s pushing the integration times to longer horizons. It turns out that a 100-year integration can catch a majority of the systems that eventually go unstable. After that, we expect roughly equal numbers of systems to be lost in each factor-of-ten increase of integration time.

Although we don’t expect to see orbital instabilities play out on our watch, it’s nevertheless likely that planet-planet interactions and their associated instabilities have played an important past role in sculpting the systems that we now observe. For example, Eric Ford and his collaborators have published a highly plausible theory for the formation of the Upsilon Andromedae planetary system that involves a dramatic instability. In their scenario, the system starts out with four planets, and eventually ejects one of them. The outer two survivors are left stunned and reeling, and the dynamical imprint of the disaster survives to the present day. They’ve made an engaging animation (available here) that shows the action blow-by-blow.

This brings up a relevant question. If orbital instability exists among the extrasolar planets, might our own solar system eventually go unstable? Is it possible that Earth will find itself getting dramatically tossed around the solar system in the manner that was experienced by the unfortunate Upsilon Andromedae E?

The question isn’t new, and the stability of the solar system has been at the forefront of interest for the last 350 years. It was first tackled by Newton, who wanted to understand how the orbits of the Jupiter and Saturn would behave over long periods if their mutual interactions were taken into account. Newton put a lot of effort into the problem, and eventually decided that:

To consider simultaneously all these causes of motion, and to define these motions by exact laws admitting of easy calculation exceeds, if I am not mistaken, the force of any human mind.

Newton’s fame, and the fact that he’d written off the problem as too difficult, was a big motivation for succeeding generations of mathematicians. Pierre Simon de Laplace eventually solved the problem of the motions of Jupiter and Saturn, and fully explained their orbits to the accuracy that could be observed in the late 1700s. In Laplace’s model, the solar system is completely stable, and the inherent predictability of his planetary motions contributed to the concept of a rational determinism, and the idea of a clockwork universe.

During its first three hundred years, the problem of the stability of the solar system was attacked using pen and paper. In the past few decades, however, the advent of computers has provided a powerful new tool. We can now make accurate simulations of the trajectories of the planets through space, and look in detail at the solar system’s possible futures. By the 1980s, when hardware and algorithms had progressed to the point were it was possible to integrate the planets millions of years forward into the future, it was found that the solar system is chaotic in a sense originally envisioned by Poincaré. If the position of a planet, the Earth say, is given a tiny change in the computer, then as millions of years elapse, this slight perturbation grows erratically larger. If Earth is displaced in its orbit by a centimeter, then, after several million years, Earth will likely be located somewhere within 2 centimeters of where it would have been had it been given no push at all. After several million years, the degree of uncertainty doubles again, this time to 4 centimeters.

Worrying about such tiny buildups of uncertainty in the position of Earth on its orbit sounds utterly absurd. Nevertheless, like interest compounding in a forgotten account, the accumulation of uncertainty is guaranteed to eventually become significant. After a hundred million years, which is much less than the 4.5 billion year age of the solar system, the position of Earth in its orbit becomes completely impossible to predict. For times 100 million years in the future, we have no firm knowledge of Earth’s trajectory. We have no idea whether January 1, 100,000,000 AD will occur in the winter or in the summer, or even whether Earth will be orbiting the Sun at all.

Poincaré’s great insight was that the realistic physical description of non-trivial systems can involve what we now call chaotic behavior. The weather is an excellent example. Overnight weather forecasts are generally quite accurate. Three-day forecasts are certainly of some utility. Two-week forecasts, on the other hand, are essentially worthless. Although we have a very clear understanding of the laws of physics that govern the behavior of Earth’s atmosphere, we can’t sample global weather conditions with enough precision to make forecasts accurate beyond a few days. If you let out a deep sigh at the complexity of it all, then the air current that you exhale will spur subtle deviations in the flow of air and moisture of the Earth’s surface that become increasingly magnified over time. The aggravated swirl of air from a slap at a mosquito can career into divergences that visit a hurricane on Miami rather than spinning it out into oblivion over the North Atlantic. Although we can’t accurately predict how the pattern of weather fronts and daily high temperatures will look on the 10:00 p.m. News two weeks from today, we do have some idea of what the weather will be. If it is in the middle of the summer, Texas will be hot. Duluth, in January, will be cold. The pattern of erratic day-to-day weather is superimposed over solidly predictable seasonal and regional climates.

We can thus ask the question: Are the movements of the planets predictably chaotic in the same sense as the weather? That is, over billions of years, will the planets wander only within circumscribed bounds, or is a more wild chaos, with orbit crossing, ejections, collisions and the like – a real possibility?

The answer will be a statistical statement. To high probability, the planets will remain more or less on their present courses until the Sun becomes a red giant. Exactly how high a probability is not fully clear. Stay tuned…

Roll ’em out…

Image Source.

The discovery of new planets is rarely clear cut. No sooner does a new world (Vesta, Neptune, Pluto) emerge, than the wrangling for the credit or the naming rights starts. And it’s usually possible to find a reason why the prediction (or even the planet itself) wasn’t really valid in the first place.

The trans-Uranian planet predicted by Urbain J. J. Le Verrier and John Couch Adams happened to coincide quite closely with Neptune’s actual sky position in September 1846, but the orbital periods of their models were too long by more than 50 years. Le Verrier’s predicted planetary mass, furthermore, was too large by nearly a factor of three, and Adams’ mass prediction was off by close to a factor of two.

In England, following the announcement of Neptune’s discovery, and with the glory flowing to Le Verrier in particular and France in general, the Rev. James Challis and the Astronomer Royal George Airy were denounced for not doing enough to follow up Adams’ predictions, “Oh! curse their narcotic Souls!” wrote Adam Sedgwick, professor of geology at Trinity College.

Nowadays, with the planet count up over 200, the prediction and discovery of a new world doesn’t quite carry the same freight as it did in 1846. No editorial cartoons, no Orders of Empire, and no extravagant public praise to the discoverer, such as that heaped by Camille Flammarion on Le Verrrier, who wrote, “This scientist, this genius, has discovered a star with the tip of his pen, without other instrument than the strength of his calculations alone!”

Nevertheless, I don’t want to be shoehorned into the ranks of the “narcotic souls” as a result of not properly encouraging the bringing to light of any potential planetary discoveries in the systemic catalog of real stellar radial velocity data sets. As of Dec. 30th, 2006, over 3,680 orbital fits have been uploaded to the systemic backend. It’s definitely time to start sifting carefully through the results that the 518 registered systemic users have produced. Over the next few weeks we’ll be introducing a variety of analysis and cataloging tools that will make this job easier, but there are some interesting questions that can be answered right away. Foremost among these is: what are the most credible (previously unannounced) planets in the database?

The backend uses the so-called reduced chi-square statistic as a convenient metric for rank-ordering fits:

In the above expression, N is the number of radial velocity data points, and M is the number of activated fitting parameters. As a rule of thumb, a reduced chi-square value near unity is indicative of a “good” fit to the data, but this rule is not exact, and should hence be applied with caution. The observational errors likely depart from a normal distribution, and more importantly, the tabulated errors don’t incorporate the astrophysical radial velocity noise produced by activity on the parent star. Furthermore, it’s almost always possible to lower the reduced chi-square statistic by introducing an extra low-mass planet.

Eugenio recently implemented the downloadable console‘s F-test, which can provide help in evaluating whether an additional planet is warranted. The F-test is applied to two saved fits and returns a probability that the two fits are statistically identical. As an example, pull up the HD 69830 data set and obtain the best two planet fit that includes the 8.666-planets and 31-day planets. Save this fit to disk. Next, add the 200-day outer planet and save the resulting 3-planet fit to disk (using a separate name). Clicking on the console’s F-test button allows the F-test to be computed using the two saved fits:

In the case of HD 69830, there’s a 1.7% probability that the 2-planet fit and the 3-planet fit are statistically identical. This low probability indicates that the third planet is providing a significant improvement to the characterization of the data. It’s likely really out there orbiting the star.

So here’s the plan: Let’s comb through the systemic “Real Star” catalog, and find the systems that (1) contain an unannounced planet(s) in addition to the previously announced members of the system (see the exoplanet.eu catalog for the up-to-date list). (2) have a F-test probability of less than 2% of being statistically identical, and (3) are dynamically stable for at least 10,000 years. If you find a system that meets these requirements, post your findings to the comments section of this post.

Disclaimer: this exercise is for the satisfaction of obtaining a better understanding of the planetary census, and also for fun. When the planets do turn up, I’m going to sit back with a bottle full of bub and enjoy any scrambles for priority from a safe distance.

Happy New Year, y’all!

The Mass-Period Diagram

radio -- live transmission

Image Source.

When J. Edgar Hoover was getting on in years, his aides would often tell scheduled visitors to his office that he was unable to meet with them because he was “in conference”. In reality, this meant that Hoover was napping at his desk.

It might seem that the refrain of, “we’re busy working on the systemic back-end” is an equally convenient euphemism for long lapses between posts on the front end. Nevertheless, we have been busy getting the new oklo xserve quad xeon up and running. The whole site has now been replicated and tested, the server is live and on air, and very shortly, we’ll be flipping the switch. Can’t wait, man!

With the vast increase in processing power afforded by the xserve, we’ll be able to provide a much more extensive suite of research tools to oklo visitors. In particular, it’ll be possible to dynamically generate the kinds of correlation diagrams that are currently only available from our estimable continental competition: exoplanet.eu.

It’s always interesting to look through the latest versions of the correlation diagrams to see whether the various trends and hints of trends are holding up. The a-e plot is worth examining, as is the plot that charts the number of planetary discoveries per year over the past decade. As of today, exoplanet.eu lists 192 planets that have been detected with the radial velocity method. Plotting the masses of these planets against their periods on a log-log plot (and running the resulting screenshot through Illustrator) yields the following:

latest mass-period diagram

For Keplerian orbits, the relationship between the radial velocity half-amplitude of the parent star and the orbital period of the planet is given by:

equation for radial velocity half-amplitude

If we assume that the mass of the planet is negligible in comparison to the mass of the star and if we further assume edge-on, circular orbits around solar mass stars, then we get the dashed lines in the figure that show detection thresholds for K=3 m/s and K=1 m/s. The three planets orbiting HD 69830 stand out in this diagram as the most striking discoveries of 2006.

To the eye, there are two curious clusters of planets in the diagram. At short periods (P~3d) we have the hot Jupiters. Most of these have masses (times the sine of the unknown inclination) somewhat less than Jupiter. At longer periods (P>100d) we have a second prominent clump of planets. These are the Eccentric Giants, and their masses average out at a significantly higher value (between 2 and 3 times the mass of Jupiter). Part of the difference in mass is due to selection bias, but nevertheless there is a real effect. Like the planet-metallicity connection, this effect is telling us something about either planet formation or planet migration (probably the latter).

Anyone got an idea regarding what’s going on? Let’s get a discussion going in the comment section. Over the past week, I’ve been flooded by depressingly clumsy attempts at comment spam from single-minded robots with mechanical enthusiasms for satellite TV service and online poker, e.g. “Great blog, keep it comming.” It’d be nice to see some signal in the noise…

New worlds to conquer

Image Source.

The California Carnegie planet search team posted a data-rich paper on astro-ph this week. The new article is scheduled to appear in the February 2007 issue of the Astrophysical Journal. Eugenio, exercising his usual diligence, has added the new velocity tables to both the downloadable systemic console and the systemic back-end stellar catalog.

The highlight of the paper is a new two-planet system orbiting HIP 14810, a metal-rich solar-mass star lying 53 parsecs away. The inner planet in the system has a period of 6.66 days, and tips the scales with least 3.84 Jupiter Masses. The outer planet is less massive (Msin(i)=0.76 Mjup), and goes around the star every 95.3 days.

The secular interaction between the two planets compels them to trade angular momentum back and forth. As a result, the inner planet cycles between an eccentricity of 0.02 and 0.15 on a relatively short 5000-year timescale. It’s currently in the high-eccentricity phase of its orbit. The large radial velocity signal-to-noise for the planet means that its eccentricity can be measured quite precisely (have a look at it with the console). The fact that the orbit is clearly non-circular would be strong evidence for the presence of planet c, even if there weren’t enough data to detect c directly. If planet b was the only significant planet in the system, its orbit would have circularized via tidal dissipation on a timescale that is less than the age of the star.

Short-period planets with masses greater than three Jupiter masses are intrinsically rare. Tau Boo b (with a mass of at least 3.9 Jupiter masses and an orbital period of 3.3 days) is the only other object with roughly similar properties. By contrast, 32 planets with periods of less than a week and minimum masses less than Jupiter’s mass are currently known.

In my opinion, the two most robust statistical correlations that have emerged from the first decade of extrasolar planet detection are (1) the planet-metallicity connection and the (2) dearth of high-mass short-period planets. The planet-metallicity correlation makes perfect sense. It’s the natural, expected outcome of the core-accretion process and the fact that Jovian-mass (as opposed to Neptunian-mass) planet formation is a threshold phenomenon. The paucity of high-mass short-period planets, on the other hand, is both weird and completely unexplained. It’s telling us something about the process of planetary formation and migration. We just don’t know what it is.

Noise Floor

concrete sky

Image Source.

Giant planets are interesting. Terrestrial planets are more interesting. Habitable terrestrial planets are the most interesting of all, and it’s nearly guaranteed that we’re living in the age when the first genuinely Earthlike worlds beyond our solar system will be discovered. The only question is which technique will wind up doing it. The big money is on space-based transit photometry, but I think that ground-based RV might take the prize.

The Systemic Challenge 004 system was designed to be a futuristic idealization of what the Sun’s reflex velocity would like if it were observed with high precision from a neighboring star for more than two decades.

The individual radial velocity uncertainties for the 1172 velocities the Challenge 004 datset are each of order 10 centimeters per second. Errors this small are still safely smaller than the sub-meter per second precision that is currently being obtained by the Swiss team (with HARPS) and the California Carnegie team (at Keck). Given the rapid improvement in the radial velocity technique over the past decade, however, it’s not at all unreasonable to expect instrumental precisions of 10 cm/s fairly soon. Many console users were able to extract the four largest-amplitude solar-system planets — Jupiter, Saturn, Earth, and Venus — out of the challenge004 dataset, suggesting that it’s only a matter of time before instrumental precisions and observational baselines arrive at the threshold where truly habitable, Earth-mass planets can be detected from the ground using the radial velocity technique.

A potential show-stopper for this rosy predictive picture is the astrophysical radial velocity noise produced by the stars themselves. If you want to detect a planet with the mass and period of Earth (which induces a radial velocity half-amplitude of only 9 cm/sec) then you need to be assured that the star is quiet enough for the low-amplitude terrestrial planet signal to be detectable. It’s therefore natural to ask the question: what does the Sun’s reflex velocity look like?

The GOLF experiment on the SOHO satellite provides one set of measurements. A massive time-series of radial velocity observations (from 1996 through 2004) has been published, and is now publicly available. The data set contains over seven million radial velocities taken at a 20-second cadence. The main goal in obtaining this data was to study the Sun’s spectrum of p and g-type modes, which show strongest oscillations at periods of a few minutes.

Three alternate calibrations of the GOLF dataset are posted on the project website. Two of these have clearly been processed to filter out low-frequency, long-period radial velocity variations. It’s interesting, however, to look at what the one unfiltered dataset suggests is happening over timescales of a year or more. I sampled the unfiltered data at a cadence of one velocity measurement per several days, and then loaded the resulting time-series into freshly downloaded version of the systemic console:

radial velocities from the GOLF experiment

According to the above time series, the Sun is a pretty noisy star. I scoured the papers on the GOLF site, and could not find any discussion regarding how much of the variation shown above is believed to come from instrumental effects and how much is belieived to be actually intrinsic to the Sun. The fact that both the scatter and the amplitude of the variations seem to be increasing during the run of the data tend to indicate that intrumental effects relating to the aging of the detector play an important role. If anyone has more specific information on this issue (or if anyone is aware of a preferred calibration) please post to the comments section of the post.

What happens to the detectability of planets that are placed in the GOLF time series? To date, the most precise RV detection of an extrasolar planetary system is the Swiss Team’s discovery of the three Neptune-mass planets orbiting HD 69830. As a control experiment, we relabeled the published HD 69830 dataset at systemic003, and placed it on the backend for Systemic users to evaluate. As expected, nearly all of the twelve submitted fits recovered the published configuration, with chi-square reaching down to about 1.20.

For the systemic004 system, we took the published HD 69830 3-planet orbital model and integrated it forward in time to make a synthetic radial velocity curve. We then perturbed this curve with noise values drawn from the unfiltered GOLF dataset (We averaged the velocities into 15-minute blocks to simulate rapid-fire multiple observations that average over high-frequency p-modes). As of Sunday night, there have been 21 fits uploaded for systemic004 [thanks, y’all, -ed.]. None of them manage a chi-square below 2.5, and aside from the innermost planet, none of them make a convincing case for the presence of the planets that were placed in the dataset. Log in to the backend, call up systemic004 from the “real stars” catalog, and you’ll see what I mean.

The conclusion, then, is that if the GOLF data-set gives a realistic determination of the intrinsic radial velocity variation of the Sun, then the Sun is a far noisier star than HD 69830 (and other similarly old, early K-dwarfs). Indeed, you would even be hard-pressed to believe the presence of Jupiter in the GOLF time-series, unless you’ve got the luxury of waiting for at least several Jovian orbital periods.

dialing 411

Image Source.

Update: The original version of this post tagged systemic003 as the target system and systemic004 as the control system. It’s actually the reverse. In any case, we’re interested in getting multiple fits to both systems. -GL

No post today, just a request:

We’ve been doing an analysis of the detectability of low-mass planets around certain types of stars. In the course of this work, we’ve generated a radial velocity data set, systemic004, which may (or may not) harbor a planetary system. I’d like to ask everyone to (1) download the latest version of the console, and (2) submit your fits to the systemic004 system to the backend. We’ve also included a control system, systemic003, which may look familiar. It would be very useful to have your fits to that system as well.

Thanks in advance! Once we get a batch of fits, I’ll write a post that explains the motivation underlying this request…

Viewed from afar (Challenge 004)

Image Source.

The fourth systemic challenge turned out to be somewhat less challenging than the first three. Quite a few entrants figured out that the data-set corresponds to our own solar system. Among a large number of excellent models, Mark Kilner turned in the fit with the lowest chi-square: 1.0401. In addition to Jupiter, Saturn, Earth, and Venus, he topped off his system with a spurious Mercury-mass planet in a 5.62 day orbit, which allowed him to take the prize. Nice one, Mark!

Eugenio created the challenge 004 synthetic data set after a conversation in which we decided that it’ll soon be feasible to push the precision of the radial velocity method down to an instrumental error of 0.1 m/s. Even more optimistically, we assumed that the Sun, viewed from afar, exhibits negligible radial velocity noise (more on that soon).

Our Solar System, expressed in the Jacobi orbital elements used by the console, is given by:

The true three-dimensional model that Eugenio actually integrated to produce the synthetic data set also includes the correct values for the planetary inclinations and nodes. Because of the sin(i) degeneracy for Keplerian orbits, the current version of the downloadable systemic console does not include the inclinations and nodes as fitting parameters.

The synthetic data set was created with the KeckTAC program, which mimics realistic observing strategies. In an all-out effort on a particular star, one would combine repeated individual observations to get a composite observation that averages over the effect of short-period oscillations (p-modes) of the star itself. This is the strategy that is being currently used by the Swiss team in their campaigns on stars such as HD 69830 and HD 160691. In the challenge004 dataset, there are 1171 radial velocity measurements spread out over 24 years.

Eugenio describes the procedure he used to fit the data:

The periodogram (and the data) shows Jupiter clearly. Saturn appears as a trend, but the periodogram of the residuals after fitting Jupiter gives a good guess for Saturn’s period. After removing Saturn, Earth pops out in the residuals periodogram. I did not find it easy to fit Jupiter, Saturn, and Earth, but after succeeding, Venus very clearly appears in the residuals. I kept on fooling around with the 4-planet fit to see if there was any chance of finding Mars even though the RMS was telling me that 4 planets was the best that I would likely do. I was hoping that N would be large enough to let me get Mars, but I was not able to see a (significant) signal in the residuals periodogram. If anything, Mercury seemed to be more easily detectable. However, after fooling around with the eccentricities of Saturn, Earth, and Venus, the (weak) signal for Mercury disappeared.

Image Source.

With the contests wrapped up, we’re now in the business of getting the fits completed for the Systemic Jr. data set. Eugenio recently incorporated an F-test module into the console, which can be used to determine whether the addition of a planet is warranted. We’ll have a post up shortly that explains in detail how this works. In the meantime, see the discussion on the backend, or download a new console and give its new modules a whirl.

1:2:4

Image Source.

The third Systemic Challenge closed to entries on Friday, and I’ve gone through and evaluated the submitted fits. The results were very encouraging. Eight out of twenty-five submissions corresponded to both the correct orbital configuration and the correct number of planets in the underlying dynamical model.

For challenge 003, we looked to our own solar system for inspiration, and tapped the four Gallilean satellites of Jupiter. Eugenio writes:

The system is a scaled-up version of Jupiter and the four Galilean satellites. To generate the model, I first set the central mass to 1 solar mass. The (astrocentric) period of Callisto was set to 365.25 days, and I required that the mass and (astrocentric) period ratios in the system would remain the same. Here’s the resulting model (using Jacobi elements, with i~88 deg):

The Challenge 003 System
Parameter “Io” “Europa” “Ganymede” “Callisto”
Period (days) 38.77079 77.77920 156.65300 365.42094
Mass (Jupiters) 0.04926 0.02646 0.08175 0.05936
Mean Anomaly (deg) 99.453 50.772 285.591 47.538
eccentricity 0.003989 0.009792 0.001935 0.007547
omega (deg) 31.229 205.427 303.460 359.879

Among the eight entries that got both the total number of planets and their periods correct, there was a fair amount of variation among fits that had nearly equivalent values for the chi-square statistic. Chuck Smith (among others) turned in a configuration that bears a very strong resemblance to the actual input system. The four planets in his fit all have nearly circular orbits:

and the resulting radial velocity curve does a very good job of running through the data, with a chi-square value for the integrated fit equal to 1.1005:

A number of other users turned in very similar configurations.

Because of random measurement errors in the data, the true underlying planetary configuration will not necessarily provide the best fit to a given set of radial velocity observations. Often, a better fit can be found for a configuration that is different from the system that generated the data. Steve Undy, for example, achieved a slightly lower chi-square value for his fit by giving a very significant eccentricity to his “Europa”:

The winner of the contest, however, was Eric Diaz, who submitted a 6-planet fit that achieves an integrated chi-square value of 1.04. In addition to the four planets that are actually present in the model, Eric added small planets with periods of 1.06 days and 18.11 days. These objects soaked up some of the residual noise in the fit, allowing for a lower chi-square value, and a copy of the Sky and Telescope star atlas. Nice job Eric!

The contest raises some interesting issues. First, at what point should one stop adding planets to a fit? The chi-square statistic penalizes the inclusion of additional free parameters in a fit, but it’s clear that chi-square can nearly always be lowered by adding additional small bodies to the fit. Second, its very encouraging to see that subtle, but substantially non-interacting systems can be pulled out of radial velocity data sets. In this system, the masses of the planets are small enough so that their dynamical interactions with eachother are not significant over the time-frame that the system is observed. This is in stark contrast to systems such as GJ 876 and 55 Cancri where it is vital to take interactions into account (by fitting with the integrate button clicked on). Finally, I think that we’ll soon see examples of the 1:2:4 Laplace resonance as competitive fits within the existing catalog of radial velocity data sets on the systemic backend.

Gamma Cephei

Image Source.

Guillermo Torres of the CfA recently posted an interesting article on astro-ph in which he takes a detailed look at the planet-bearing binary star system Gamma Cephei.

Gamma Cephei has a long history in the planet-hunting community. In 1988, Campbell, Walker and Yang published radial velocity measurements which show that Gamma Cephei harbors a dim stellar-mass companion with a period of decades. More provocatively, they also noted that the star’s radial velocity curve shows a periodicity consistent with the presence of a Jupiter-mass object in a ~2.5 year orbit around the primary star. In a 1992 paper, however, they adopted a cautious interpretation of their dataset, and argued that the observed variations were likely due to line-profile distortions caused by spots on the stellar surface. From their abstract:

In 1988 Gamma Cep was reported as a single-line, long-period spectroscopic binary with short-term periodic (P = 2.7 yr) residuals which might be caused by a Jupiter-mass companion. Eleven years of data now give a 2.52 yr (K = 27 m/s) period and an indeterminate spectroscopic binary period of not less than 30 yr. While binary motion induced by a Jupiter-mass companion could still explain the periodic residuals, Gamma Cep is almost certainly a velocity variable yellow giant because both the spetrum and (R – I) color indices are typical of luminosity class III. T eff and the trigonometric parallax give 5.8 solar radii independently.

In October 1995, 51 Peg b was announced, and exoplanet research was off to the races. The Walker team, with their futuristic RV surveys had seemingly come close to success, but had not managed to snag the cigar.

In the Fall of 2002, however, the planetary interpretation for the Gamma Cephei radial velocity variations was revived by Hatzes et al., who used McDonald Observatory to extend the data set. They showed that the 2.5 year signal has stayed coherent over two decades, thus effectively ruling out starspots or other stellar activity as the culprit. The planet clearly exists.

Aside from providing a pyrrhic victory for the Walker team, the Gamma Cephei planet is a remarkable discovery in its own right. Its presence showed that gas giants can form in relatively long-period orbits around binary stars of moderate period. In their discovery paper, Hatzes et al. assumed that the binary companion orbits with a period of 57 years, but other estimates varied widely. Walker et al. (1992), for example, adopted 29.9 years, whereas Griffin (2002) use 66 years. The mystery is strengthened by the fact that to date, the companion star has never been seen directly.

The details of the orbit of the binary star are of considerable interest. For configurations where the periastron approach is relatively close, simulations show that the star-planet-star configuration can easily be dynamically unstable.

In his new article, Torres methodically collects all of the available information on the star, and shows that the binary companion to Gamma Cephei has a 66.8 +/- 1.4 year period, an eccentricity of e=0.4085 +/- 0.0065, and a mass of 0.362 +/- 0.022 solar masses. The orbital separation thus lies at the high end of the previous estimates, and renders the stability situation for the system considerably less problematic.

We’re stoked about the Torres paper because it provides references to some truly ancient radial velocities, dating all the way back to a compendium published by Frost and Adams in 1903:

who report 3 measurements made at the University of Chicago’s Yerkes Observatory:

Eugenio has tracked down the various references in the Torres paper, and has recently added all of the available old-school RV’s for Gamma Cephei to the downloadable console. You can access the full dataset by clicking on “GammaCephei_old”:

It’s straightforward to manually adjust the offset sliders to put the radial velocities on a rough baseline. You can then build a rough binary star fit with the sliders, followed by repeated clicking on the Levenberg-Marquardt polish button, with the five orbital elements and the five velocity offsets as free parameters. This gives an Msin(i)=386 Jupiter masses, a period of 24,420 days, and an eccentricity, e=0.4112. Try it! The values that you’ll derive are in excellent agreement with the Torres solution:

With the binary fitted out, try zooming in on the more recent data from the past 10-20 years. You’ll see that the modulation of the radial velocity curve arising from the planet is faintly visible even to the eye. It’s interesting to go in and find the best-fit planetary model…

Follow Ups And other items…

Image Source.

It’s very gratifying to see an increasing number of people logging in to the Systemic Backend, and downloading the console. We’ve also been getting a lot of good feedback from users, which we’ll be incorporating into updated versions of the software.

Several people have noted that the backend is currently assigning chi-square values of zero to uploaded fits! We’re highly aware of this problem, and it likely stems from the fact that we may be exceeding our CPU allocation at our ISP. The back-end code integrates all submitted fits to verify the chi-square statistic for purposes of ranking. For submitted systems with long time baselines and short-period planets, these calculations can wind up being fairly expensive. We’ll let you know as soon as this issue gets resolved. In the meantime, it’s fine to submit fits, but if you get a good one, please save a copy in your own fits directory for the time being.

We’ve been getting a lot of entries for the Challenge 003 system. At the end of this week, I’ll tally up the results, so if you’ve got a fit to submit, go ahead and send ‘er in (using the e-mail address listed on the web-page given in the print version of the October Sky and Telescope). It’s fine to submit multiple fits — I’ll use your best one to determine the final ranking. The challenge 003 system represents an interesting dynamical configuration of a type not yet observed for planets in the wild, and so it’ll be very interesting to see what people pull out. Look for Challenge 004 to appear this weekend on the downloadable console, and shortly thereafter, warm up those processors for the advent of the 100 star Systemic Jr. release.

Yesterday’s post is generating an interesting and vigorous discussion thread. Jonathan Langton and I were hopeful yesterday that his benchmark Cassini-State 1 simulation might show an appropriately asymmetric light curve when viewed from lines of sight inclined to the planetary equator (as is the case for the Ups And observations). Frustratingly, however, when the model light curves are actually computed, they wind up drearily sinusoidal, and the phase offset is independant of viewing inclination:

We’re holding out hope, though, for Cassini-State 2. In that case, there are two angles to vary (the orientation of the pole in the orbital plane, and the viewing inclination) and so it may well be possible to dredge up a good fit to the data. After-the-fact parameter tweaking, however, is highly unsatisfactory! I’m looking very much forward to seeing more data sets like Ups And’s. In particular, HD 189733, should give a very nice full-phase curve, and further down the line HD 80606 should be even more interesting.

extrasolar trojans

Image Source.

UCSC just put out a press release on the Systemic Project, so if you’re a first-time visitor to oklo.org, welcome aboard. You’ll find information about the project in the list of page links just to the right.

Last week, during my visit to Harvard CfA, I talked to Eric Ford, who has been exploring the idea of searching for trojan companions to extrasolar planets. He pointed out that the discovery of a body in a trojan configuration with a known extrasolar planet would provide an important test of theories of hot Jupiter formation. Here’s a link to his paper.

One way to make a hot Jupiter is to form the planet through the standard core-accretion method at a large radius in the protostellar disk. In this scenario, a newborn gas giant planet starts as a core of rock and ice, which grows to a size of 5-10 Earth masses and begins to rapidly accrete gas from the surrounding nebula. As the planet increases in size, it begins to clear a annular gap in the parent disk. Hydrodynamical simulations (such as the ones reported here, and reproduced in the illustration below) show that L4 and L5, the so-called trojan points located 60 degrees ahead and 60 degrees behind the forming planet, are the last regions of the gap to be cleared out.

It’s possible that co-orbital planets can form from the slow-to-clear material at L4 and L5. When the gas is gone, these objects will remain in stable trojan orbits.

If a pair of planets is caught in a trojan configuration, then they will migrate inward together through the disk, and the migration process will not cause them to become dynamically unstable. Eric points out that the observed presence of a trojan companion to a hot Jupiter would thus be evidence that the hot Jupiter arrived at its short-period orbit via migration. Other possibilities for forming hot Jupiters, such as dynamical instability followed by orbital circularization, do not allow for trojan companions.

A trojan pair of planets presents an interesting conundrum for planet hunters. Normally, a single planet on a circular orbit goes through its radial velocity zero point at the moment when the planet lies on the plane containing the line of sight from the Earth to the parent star. If we have a trojan, however, a planetary transit will be offset from the radial velocity zero point, which is associated with the orbit of a “ghost body” that combines the gravitational effect of the primary planet and its trojan companion. Using the console, try obtaining a two-planet perfect trojan (60 degree separation) fit to a well-known hot Jupiter data set such as that for HD 187123. You’ll find that it’s perfectly possible. The resulting configurations have utterly indistinguishable radial velocity signatures.

Trojans can be detected, however, if the primary planet happens to transit. The presence of the trojan companion can be inferred by measuring the lag between the center of the transit and the zero crossing of the radial velocity curve. For planets with an equal mass ratio, this would amount to a full 1/12 of an orbital period (6 hours for a 3-day orbit).

Which brings up an interesting project for transitsearch.org observers. Most of the known hot Jupiters have been checked photometrically for transits. These transit searches, however, are performed in the time window surrounding the radial velocity zero point. In the (admittedly unlikely) case that some of these objects are trojan pairs with near-equal mass ratios, the transits would have been missed using this approach. To fully rule out transits, one should cover the full 1/6th of an orbital period surrounding the nominal predicted transit time…

And inside the second envelope…

Image Source.

First, a thank-you to everyone who submitted a fit to the second systemic challenge. I just loaded all the fits into the console and evaluated the chi-squares (with integration turned on). Jose Fernandes, of Lisbon, Portugal, submitted the winner, and will be receiving the $149.99 sky atlas from Sky and Telescope.

Jose’s fit has a reduced chi-square statistic of 3.94, and is comprised of three planets:

The outer two bodies have masses 1.58 and 0.5 times that of Jupiter, with eccentricities of 0.58 and 0.14. They share a common period of 362 days. The fit also has a tiny inner planet with a mass just under 3% that of Jupiter and a period of 50 days. This little guy improves the fit by wriggling the radial velocity curve up and down to statistically grab more points.

The system that actually generated the data was quite similar:

There are two equal-mass planets with masses 1.04 times that of Jupiter, with eccentricities of 0.7 and 0.2. They share a common period of 365 days. The 50-day planet in the winning fit was spurious, as is often the case when a model planet has a mass that is far smaller than its companions.

This system is an example of a one-to-one eccentric resonance. It is based on a system that was discovered by UCSC physics student Albert Briseno in one of the simulations that he ran for his undergraduate thesis, and it was formed as the result of an instability in a system that originally contained more planets. The system experienced a severe dynamical interaction, which led to a series of ejections. After the last ejection, two planets remained. They share a common orbital period, and gradually trade their eccentricity back and forth. Their interaction gives a strong non-Keplerian component to the resulting radial velocity curve for the star, which makes this a tricky system to fit. While the system might seem absurdly exotic, it’s recently been suggested by Gozdziewski and Konacki that HD 82943 and HD 128311 might have their planets in this configuration (you can of course try investigating this hypothesis for yourself with the console). Their paper is here.

The challenge 002 system is an example of a general class of co-orbital configurations in which the two bodies constitute a retrograde double planet. If you stand on the surface of either world, the other planet appears to be making a slow retrograde orbit around your moving vantage as the libration cycle unfolds over several hundred orbits.

In tomorrow’s post, we’ll stay on the topic of co-orbital planets, and look at some interesting new work by Eric Ford on the possibility that we might soon be able to observe planets in Trojan configurations. Two planets in a Trojan orbit librate around the points of an equilateral triangle in the rotating frame. Indeed, when such an arrangement occurs, it’s possible that a particularly interesting dataset might have the capacity to launch a thousand fits.

[For more about 1:1 resonances, see this post and this post. For a discussion about the audio wave forms that they produce, see this post.]

Some updates

Image Source.

I’ll be gone on a trip to the Harvard CfA for the next several days. While I’m there, I’ll be giving a colloquium talk, and in addition, I’ll be trying to extract all the latest research news items from the CfA’s large group of exoplanet researchers. That’ll likely give me some stuff to write about in upcoming posts.

We’ve now closed the Systemic Challenge 002 contest, and I’ll tally up the results on the plane ride home. Look for a post this weekend that will explain what’s going on in the Challenge 002 data set. Eugenio has cooked up a great batch of RVs for the Challenge 003 system, and we’ll be releasing them this coming weekend.

Note that the dates of the challenges are slipping from what was announced in the S&T article. There’ll still be a total of four systems, but the contests will run over two months rather than one as originally planned. As soon as the contests are finished up, we’ll release the “Systemic Jr.” set of 100 trial systems. Based on our experience with these systems, we’ll make any necessary modifications to the simulation profile, and then we’ll be set to start the long-promised full Systemic simulation. In the meantime, keep submitting fits! I’d really like to see the chi-square come down on a dynamically stable configuration for 55 Cancri.

In other news, we’ve now got confirmations for both WASP-1b and WASP-2b.

On Monday, Mike Fleenor, of Volunteer Observatory in Knoxville Tennessee wrote:

I observed a complete transit of WASP-1b last night under very good conditions. My LC shows mid-transit very close to your predicted center. Details are available here.

Last weekend, Joe Garlitz from Elgin Oregon wrote:

Last night (Fri/Sat) I tried for WASP2 and got some data that looks promising. The data is very noisy and I would not feel comfortable about presenting it without some other confirming (hopefully someone else got data) observations.

I have attached a .jpg image of the data chart. The data is really forced to get any kind of “curve”. The solid line represents a running average over 16.25 minutes, 13 data points.

The individual images are 65sec at an interval of 75 sec. The scope is 200mm @ f/8 with a Cookbook 245 CCD, no filters.

Here’s his lightcurve:

Today, Geir Klingenberg from Norway checked in with a confirmation of Garlitz’s result (which he obtained remotely from a telescope in New Mexico:

Hi Joe,

I observed the ingress of this WASP-2 transit, see here.

Seems to fit your data nicely.

I used a robotic telescope at GRAS: 0.3m SCT @ f/11.9 and a FLI IMG1024.

Way to go, guys!

speculations

Image Source.

Hey Everybody, if you’ve been working on your fits to the second Systemic challenge system, send them to the e-mail address listed on the web-page given in the Sky and Telescope article.

I’ve been hearing many rumors floating around that there’s going to be a big planet announcement next week. Unfortunately, oklo.org has not yet joined the privileged ranks of the mainstream science press, so I haven’t been privy to any advance looks at the result that’s gonna come off the wire. I did hear, though, that it’s going to be an STScI announcement, so I did a little anticipatory detective work.

STScI runs HST, which means that the result will be the product of Hubble observations. In order to make Hubble observations, one needs to manage to get a block of fiercely competitive Hubble time, which means you need to write a successful Hubble proposal. The abstracts of winning Hubble proposals are posted publicly on NASA ADS. A quick search yields the following accepted proposal abstract (Proposal ID #10466), submitted by Dr. K. C. Sahu:

We propose to observe a Galactic bulge field continuously with ACS/WFC over a 7-day period. We will monitor ~167, 000 F, G, and K dwarfs down to V=23, in order to detect transits by orbiting Jovian planets. If the frequency of “hot Jupiters” is similar to that in the solar neighborhood, we will detect over 100 planets, more than doubling the number of extrasolar planets known. For the brighter stars with transits, we will confirm the planetary nature of the companions through radial- velocity measurements using the 8-m VLT. We will determine the metallicities of most of the planet-bearing stars as well as a control sample, through follow-up VLT spectroscopy. The metallicities of the target stars range over more than 1.5 dex, allowing for a determination of the dependence of planet frequency upon metallicity–a crucial element in understanding planet formation. We will be able to discriminate between the equally numerous disk and bulge stars via proper motions. Hence we will determine, for the first time, the frequencies of planets in two entirely different stellar populations. We will also determine for the first time the distribution of planetary radii for extrasolar planets for both these populations. Parallel observations with NICMOS will provide ultra-deep near-infrared images of a nearby bulge field, which will be used to determine the stellar luminosity and mass functions down to the brown-dwarf regime. The data will also be useful for a variety of spinoff projects, including a census of variable stars and of hot white dwarfs in the bulge, and the metallicity distribution of bulge dwarfs.

I looked at Sahu’s web page at STScI, where he writes:

At present, my research is mainly focused on a large HST program which involves monitoring of about 300,000 stars towards the Galactic bulge using the Advanced Camera System (ACS) on board HST, to search for extra-solar planets. The results are due to appear in the October 5, 2006 issue of Nature.

So clearly, the ACS data have been reduced, and it’s an excellent bet that they’re planning to announce the transit candidates that have emerged from their 7 days worth of ACS photometry. The number of transits to be announced is almost certainly more than two. This week’s announcement of WASP-1b and WASP-2b certainly didn’t produce a noticeable media splash, so there must be a lot of planets in the announcement. And given the past history of HST microlensing planet detections, I bet it’ll be the case that some of the parent stars of the soon-to-be-announced new transiting planets have indeed undergone a fairly rigorous spectroscopic follow-up with the VLT.

I think that spending a whole week of ACS time to stare at stars in the galactic bulge is a fairly worthwhile use of the HST (although I bet a lot of extragalactic astronomers might disagree). Here’s my take: In the mid-1990’s, it was believed that the stars of the galactic bulge are very metal-rich. In 1994, for example, McWillian and Rich 1994 reported an average bulge star metallicity of 0.2 “dex”, that is, ~60% greater than the solar value. More recently, however, Fulbright et al. 2006 have revised the average metallicity of the bulge downward to a value of -0.1 dex (~80% of the solar value). It thus appears that the metallicity distribution of the stars in the bulge is roughly similar to the metallicity distribution of stars in the solar neighborhood.

We know from Debra Fischer and Jeff Valenti’s work that the rate of short-period giant planet occurence is a strong function of stellar metallicity:

the planet metallicity correlation

All other things being equal, we can use the above diagram to inform an estimate of the number of planets that Sahu and company will announce. The hot Jupiter occurence rate in a solar-neighborhood type metallicity population is of order 0.7%. About 10% of hot Jupiters will be observable in transit. About half of those transits will be clobbered by the effect of a binary companion sharing the pixel and driving the detection below threshold. For a 7-day survey, about 60% of the hot Jupiters will actually get picked up, given constant coverage and good control of detector systematics (which HST certainly has). This means that Sahu should see (167,000)x(0.007)x(0.1)x(0.5)x(0.6)=35 transiting planets.

The problem, however, will be that there are many events which will look like planet transits, including grazing eclipsing binary stars, transiting M-dwarf stars, and the surprisingly common situation where a background eclipsing binary star shares the pixel with a foreground target star, a so-called blend situation. Dave Charbonneau and his collaborators have written extensively about all of the different pitfalls that can cause a wide-field transit survey to turn up false positives.

So my guess is that there will be of order 200 transit candidates in the ACS data for 167,000 stars. The brightest and most promising of these will have been sent to the VLT for spectroscopic follow-up. If the sensitivity limit of the survey (as stated in the proposal abstract) is V~23, then the candidate stars will likely have V~20-21. Even with the VLT, it’s tough to get accurate radial velocity measurements for stars this dim. So a lack of an observed binary stellar companion will probably be taken as a confirmation of the presence of a planet. (This is all complete speculation on my part.) Going even further out on a limb, my guess is that they have ~100 stars that show transit signatures, and which do not have a spectroscopically detectable binary stellar companion. Although it’ll be hard to further sort the wheat from the chaff, I’ll harbor a guess that 1/3 of the planets that will likely be announced are bona-fide.

Assuming that this is what actually occurs at the press conference, then we’ll have a very interesting result — not so much about the planets (which will be hard to characterize owing to the dim parent stars) — but because of what it tells us about the formation of the galactic bulge. Right now, there are several competing theories for how the bulge formed. One possibility is that scattering of stars by the Milky Way’s galactic bar has populated the Milky Way’s bulge with stars. Another possibility is that the bulge stars are the result of many disrupted globlular cluster or dwarf-galaxy like objects.

A measurement of the planet population of the bulge stars can allow us to distinguish between these two possiblities. If the planet occurance rate is similar to the galactic neighborhood (which I’m guessing will be the gist of the press conference) then the bulge stars are likely to have formed under low-density conditions. This would favor a bar-scattering type of scenario. If the planet occurence rate is zero or very low (which is unlikely, given that they are having a press conference) that would imply that the stars formed in a high-density environment. A crowded star formation leads to a ultraviolet ionizing radiation field that makes it difficult for planets to form and then migrate inward to become hot Jupiters.

There was a remarkable study done with HST in the late 1990s, and published by Gilliland et al. 2000. HST obtained a 8.3-day photometric time series for 34,000 stars in the globular cluster 47 Tucanae. The data, when reduced, show a total absence of transiting planets. This result shows the power of both the environment variable (the 47 Tucanae stars formed in an intensely irradiated region of star formation) and the metallicity variable (the metallicity of the 47 Tucanae stars is about 20% the solar value).

Finally, it’s always good to look at costs. According to the Wikipedia, the total cost of building, launching, servicing, and running HST has been of order 6 billion dollars. It started working as planned in 1994, and will thus have ~15 years of fully functional use. The seven days of ACS time were therefore worth 7.6 million dollars. This is comfortably more than the cost of building a special-purpose telescope to probe the terrestrial planets that are almost certainly orbiting Alpha Centauri B. (For more information, see these oklo.org posts: 1, 2, 3, 4, 5.)

HJD

These thumbnails show 42 of 56 photos taken during the interval from 6:56:27 PM to 7:00:26 PM CDT on September 16th, 2006, at spacing of roughly 3.2 seconds per frame. We were northbound on Interstate 57, north of Tuscola, Illinois.

I’ve processed the frames into animations, which can be accessed in mov and mp4 formats: tuscola.mov (200 kB) and tuscola.mp4 (600 kB). There’s an interesting sense of high-speed motion imparted by the differential blur and the decreasing altitude of the Sun above the horizon. I used a zoom factor of 10x, and was aided by the extremely level landscape. It was very flat because we were just north of the maximum southern extent of the Wisconsinan glaciation, which retreated just 13,000 years ago.

The animation demonstrates that just south of 40 degrees north latitude, the duration of Sunset near the equinox is just under three minutes. As I watched the Sun go down, I was thinking about the fact that the Earth’s motion through its orbit is creating transits observable (in September) to observers located on planets orbiting specific stars lying in Pisces.

Here on Earth, observations of transiting extrasolar planets are mediated by a complex beat pattern between the diurnal and seasonal cycles of the Earth, and the alien periodicity of the transiting planet. Assuming clear weather, in order to catch a complete predicted transit it needs to be dark, and at least a transit duration before dawn. In addition, the target star needs to maintain a sufficient altitude above the horizon during the course of the transit.

These constraints have restricted the aggregate of known transits to objects with periods of 4 days or less. From a single location on Earth, it’s very hard to find and confirm transiting planets with longer periods. With a global network, however, the problem is more manageable, essentially because it’s always 5pm somewhere. Several years ago, we published a detailed analysis which shows quantitatively how a network of small telescopes gains in advantage over a single large telescope at a fixed location as the planetary period increases.

and then there were fourteen…

In June 2002, I saw Keith Horne give a review talk at the Scientific Frontiers in Research on Extrasolar Planets Meeting at the Carnegie Institute of Washington. He showed a slide (an updated version of which is here) that listed 23 planetary transit surveys that were in operation at that time. He had asked the investigators running each survey to send him the number of new transiting planets per month that could be expected to turn up. The grand total rang up to a whopping 191 fresh planets per month, or 2,292 planets per year.

For a number of reasons, those numbers haven’t quite panned out, but it nevertheless finally looks like we’re entering a phase where the planetary yield from wide-field transit surveys is starting to ramp up dramatically. Today’s astro-ph mailing has a paper by Collier Cameron et al. entitled “WASP-1b and WASP-2b: Two new transiting exoplanets detected with SuperWASP and SOPHIE”, describing the discovery of P=2.15 d and P=2.52 d planets transiting ~12th magnitude stars. As of this month, astronomers have been hauling in transits at a rate of one per week.

Dave Charbonneau at CfA dropped me an e-mail this morning:

Great chance to catch WASP-1 tonight from the western US. We will pursue it from Mt. Hopkins and Palomar, but thought you might want to give a heads up to transitsearch.org. This one is very much in need of a great light curve, as the current estimates of the planetary radius range from “smallish” to “huge”, with an error bar that is depressingly large.

He’s definitely right about all that. Multiple photometric data sets will be of considerable use in constraining the system parameters. It’s also going to be very important to get a better handle on the properties (Mass, Radius, and metallicity) of the WASP-1b and 2b parent stars. We’d really like to know how these two new planets fit into the overall trends that are starting to emerge among the aggregate of transiting planets.

Ephemerides for both of the WASPs have been added to the transitsearch.org candidates table, and the (rather meagre) published tables of radial velocity measurements have been added to the Systemic back-end. Given the short orbital periods, I don’t think it’ll be very long at all before small telescope observers start producing confirmation light curves.

lightcurves

Image Source.

As we work to get the systemic collaboration off the ground, I’ve been letting transitsearch.org coast along on basically its own devices. That will change fairly soon as we incorporate the transitsearch.org site into the oklo.org backend. This will allow for (among other things) creation of transit ephemeris based on submitted fits, and a tighter collaboration among observers.

In the interim, there’s an important opportunity coming up on October 20th, 2006 for transitsearch.org observers to see whether the highly eccentric planet HD 20782 b can be observed in transit. The a-priori probability is 3.6% that we’ll make a huge (and I mean big deal) discovery. Here’s a link to the oklo post from last April describing the system. I’ll be sending out a campaign notice to the transitsearch.org e-mail list shortly, and I’m hoping that AAVSO will want to collaborate on this campaign as well.

A large number of amateur and small-telescope observers have been catching transits recently. Here’s an overview of some of the results that have showed up in my in-box over the past two months:

Last year, transitsearch.org got an important opportunity to follow up on a high-probability transit candidate. The target was the P=3.34 d planet in the close triple star system HD 188753 that was announced by Konacki, 2005 and which received quite a bit of notice in the press.

Konacki’s planet, which has a minimum mass of 1.14 Jupiter masses, and a predicted radius of ~1.1 Jupiter radii, orbits a 1.06 solar-mass star (HD 188753A) at a distance of ~0.05 AU. The star A is in turn separated by 12 AU (e=0.50) from a binary pair (HD 188753B “a” and HD 188753B “b”). The binary pair B consists of stellar components with 0.7 and 0.9 solar masses in a 155-day e=0.1 orbit (separation of 0.67 AU). The presence of a hot Jupiter orbiting HD 188753A was very surprising, because the presence of the binary B leads to severe difficulties for conventional planet formation theories.

Observations in 2005 by Ron Bissinger and other transitsearch.org observers indicated that it is very unlikely that HD 188753A “b” is transiting (the a-priori probability was 11.8%). Further confirmation of a lack of transits came this July from Joe Garlitz of Elgin Oregon, who writes:

Attached is a chart made from data on HD 188753 taken from 04:45 to 09:30 July 21 [UT]. There is no suggestion of a transit during this time within the capacity of this data. It is difficult to get a good data set since there are no stars within the field at a magnitude similar to HD 188753.

Garlitz’s full figure is here, and his website is here.

One disadvantage of having 200-odd planets rattling around in the planet catalog, is that it’s getting hard to keep all the HD numbers straight. HD 188753 doesn’t show transits, but HD189733 most dramatically does. On July 30th, Donn Starkey, of Auburn, Indiana sent a nice light curve of HD 189733 during the JD 2453946.7 transit:

More detail regarding Starkey’s results can be found on his website.

On August 27th, I received a dispatch from Veli-Pekka Hentunen of Varkaus Finland. Summer has finally wrapped up in Finland, and Taurus Hill observatory (featured in this post from last May) is again open for business:

Last weekend, we began to continue exoplanet transit observing after the long Finnish light summer. On the night of August 26-27 w observed our first XO-1b transit at the Taurus Hill Observatory, Varkaus (obs. code A95). We were able to catch only about half of the entire transit because the object was quite low in the north-western sky, and the altitude decreased from 30 to 15 degrees during the course of observation. Our light curves and observing information are given on our English website.

In a follow-up e-mail on September 17th, Hentunen reported that they had observed a full transit for HD 189733 on the night of September 16th-17th:

Starting on September 9th, Tonny Vanmunster, Kent Richardson, and Ron Bissinger all reported observations of the newly discovered TrES-2 transit. Tonny and Kent’s observatons are detailed in this oklo post, whereas Ron’s TrES-2 light curve looks like this:

Don Carona at Texas A&M also sent a light curve of a TrES-2 transit, obtained (under less-than-ideal weather conditions) from the Physics Dept. at College Station. Here’s an unbinned excerpt from his reduced high-cadence time series:

Notice the the lack of a flat bottom for the TrES-2 transit (which is more obvious to the eye when the data is binned). TrES-2 crosses the star with a high “impact parameter”, which means that the planet does not occult the central portion of the star as seen from Earth. Stellar Limb Darkening is responsible for the remarkable smoothness of the dip.

On September 19th, Bob Buchheim of Altimira Observatory sent a very nice HD 189733 lightcurve:

Along with the photometry, he sent a report of an entirely new strain of transit fever:

Last night I monitored HD189733 for a photometric transit signature. A bit of an embarassing story: I noticed that it was nicely placed and “in window”, so I set up the telescope and went to bed … but I forgot to check if transits had already been detected for this star. Imagine my surprise at the resulting deep transit signature! (See attached graph). Oh, well, now that I’ve checked, I see that I’m a year late with this “discovery”.

Bob’s experience reminds me that I’ve got to update the various results pages for the transiting candidates. The transitsearch results page for HD 189733 b reports (erroneously, and by default) that “No photometric transitsearch has yet been reported for this system”. Yikes!

Finally, just a few minutes ago, I got an e-mail from Arto Oksanen, who was the first amateur to observe an HD 209458b transit (on Sept. 16th, 2000). Six years later, it looks like he’s also the first amateur to observe HAT-P-1b

I observed the end of transit of HAT-1b last night at Hankasalmi Observatory, Finland. The weather was not very good, but the egress was well visible. The observing instrument was a 40 cm RC telescope. I used V-filter with SBIG STL-1001E CCD.

Oksanen’s light curve is plotted is at this link, and is reproduced just below:

Oksanen notes that the egress seems to occur 30 minutes early relative to the published ephemeris. This could well be the case. The longer the time baseline for transit observations, the more accurate the ephemeris become. Small-telescope observations have an important role to play in this regard.

The golden ratio

It was gratifying to watch the first systemic challenge unfold.

After a week of accepting fits, we tallied the entries and determined that Chris Thiessen had obtained to the lowest submitted chi-square. Way to go Chris! Eugenio then added the “challenge001” data set to the systemic backend, so that users can continue to improve and submit fits.

So what was the underlying synthetic planetary configuration that generated the data set?

Both Eugenio and I have had a long-running interest in the GJ 876, a 15-light year distant red dwarf star that is now known to harbor at least three planets. The two outer worlds in the system, which were discovered in 1998 and 2001, are in 2:1 resonance, and form the classic example of a configuration that demands a self-consistent (as opposed to Keplerian) model. Last year, Eugenio led the discovery and characterization of a third planet in the system, which has a mass only 7.5 times that of Earth, and orbits the star every 1.94 days. (Here’s a link to the NSF press release for Rivera et al. 2005.)

We’ve been looking into the possibility of detecting another planet in the system, and in order to do so, we’ve been studying synthetic data sets that contain the three known planets, as well as a fourth, potentially habitable planet in a potentially habitable orbit. The following table gives the parameters of our hoped-for system (which, like the real system, has its invariable plane inclined by 40 degrees with respect to the line of sight.)

(JD 2452490)
Parameter Planet 1 Planet 2 Planet 3 Planet 4
Period (days) 1.937747 7.106642 30.45123 60.83227
Mass (M_Jup) 0.025101 0.016193 0.791650 2.531229
Mean Anomaly (deg) 308.84845 169.44032 312.3738 159.1070
eccentricity 0.000000 0.000000 0.262795 0.033979
omega (deg) 0.000000 0.000000 195.8324 191.9573

The first 155 points in the challenge data set used the actual observing times given in Rivera et al 2005. The remaining 32 points were generated using the version of Eugenio’s Keck_TAC program that we use to produce the systemic synthetic data sets. We then subtracted off the the first epoch time from all 187 observing times and multiplied each of the resulting times by the golden section, 1.618033989. This gives a system that has the dynamical characteritics of the real GJ 876 system, but with orbital periods that are all 1.618 times longer.

After setting up the uploads page on the backend, Eugenio uploaded the best fit that he was able to obtain, which had a chi-square of 3.13. A lot of computation went in to getting this fit, which took several days on a fast desktop machine.

Amazingly, the next day, user Roseundy submitted an even better fit,

which brought the chi-square down to 2.82, with the following comment:

Arrrggghh!!!!!!!! I had this fit on Sep 13, but I thought the ChiSq was too high to bother to submit. Lesson learned.

Eugenio and I were quite excited. Systemic users have clearly gotten at least as good at fitting with the console as we are, and we have been thinking carefully about the problem for quite a while. In the comments section on Roseundy’s fit, Eugenio wrote:

Hi Roseundy, That is awesome work!! All the challenge systems will be based on some known model, possibly a random draw, some noise, and possibly other effects. The random draw and the noise complicate the situation for the modeler (me), so that knowledge of the model will not always result in the best fit. Actually, your result is a major success for the idea behind the systemic collaboration — distributing the process of fitting radial velocity data sets. Because I really don’t know precisely how the random draw and the noise affected the model, it may still be possible to get even lower chisq values. I encourage everyone to continue fitting this system (as well as others). It does require patience and perserverence.

Chris Thiessen wrote:

Roseundy, I’m very impressed. The two major planets have such different Keplerian and integrated fits that I was never able to get them to work well together. How did you get the two planet solution? I’m not sure I would have let the 48 day planet develop that much eccentricity if I’d seen a trend. Maybe I missed out that way. Great work!

Whereupon Roseundy revealed the secrets of his fitting method:

Once I saw how close the planets were, I realized I needed to work with integration turn on. This, of course, slowed things down painfully. To make progress, I cut down the dataset (the middle third of the velocity data) and played with that until I got a good (chi^2 of 7 or so) fit. I backed that out to the full data set (very painful) and then added additional planets based on the residuals. I polished until I got the fit you see. I’m sure it can be improved, but I lost patience with it. I would like to see three improvements to the console to make this easier in the future: 1. be able to subset the data 2. be able to select which planets are to be integrated together, using Keplerian calculations for the rest. this would help with systems where only a few planets substantially interact with each other 3. (my vote for the most important) a natively compiled console. java byte code may be portable, but I don’t it’s very optimized. Having optimized binaries (x86 on Linux preferably) would be a win, I think.

We agree. After the next release of the console, I think it would be a good idea to migrate to a strategy where the systemic community of users can work on the console code open-source style. This is clearly another area where a distributed attack will get important and interesting results.

In any event, thanks to everyone who has been reading the oklo blog and collaborating in the backend. We’ve had over 6,000 unique visitors so far this month, and the project is really starting to show promise.

A HAT trick

inter tidal

Image Source.

Chalk another transiting exo-planet up on the board. In a preprint released today, Gaspar Bakos and his colleagues in the HATnet project are announcing HAT-P-1b, a large-radius, low-density planet transiting one member of a relatively nearby, relatively bright solar-type binary star.

HAT-P-1b (which orbits the star BD+37 4734) is quite interesting for several reasons. Its 4.46529 day orbit is the longest period yet detected for a transiting extrasolar planet, and its measured radius of 1.36 Jupiter radii is alarmingly larger than the baseline theoretical prediction. The planet contains 0.53 Jupiter Masses, and has a surface temperature near 1100 K, so our models predict that it should have a radius of 0.94 Jupiter radii if it contains a 20 Earth-mass heavy-element core, and a radius of 1.09 Jupiter radii if it’s made of pure solar-composition gas. It’s thus roughly 20-30% larger than it “should” be, which means that something is providing it with a very significant source of extra interior heat.

The large radius of the planet means that the transits exhibit a ~1.5% photometric depth. Deep transits make it easier to obtain data with high signal-to-noise, which means that we can look forward to very accurate follow-up measurements for this system. The presence of a nearly identical companion star at a separation of 11 arc seconds should also help observers obtain good differential photometry. The star is up now, and its well-placed for Northern Hemisphere observers. I don’t think it’ll be long before we see confirmations rolling in from small-telescope observers worldwide. If you’re interested in observing it, the ephemeris table is here.

Where could the extra source of heat be coming from? One possibility is tidal dissipation related to the circularization of an eccentric orbit.

The theory of tides can rapidly slip into thousands of pages of detailed mathematical analysis. Many of the interesting ideas, however, are close to the surface. In the introduction to his still-useful 1898 popular book, “The Tides”, Sir George H. Darwin, the son of the naturalist, and Plumian Professor at Cambridge, wrote:

A mathematical argument is, after all, only organized common sense, and it is well that men of science should from time to time explain to a larger public the reasoning behind their mathematical notation. To a man unversed in popular exposition it needs a great effort to shell away the apparatus of investigation and the technical mode of speech from the thing behind it.

I would actually argue that the situation is quite the opposite. I think it’s easier and better to get a colloquial, heuristic understanding first, and then make an attempt to put the ideas on a sound mathematical basis.

For a planet that (like Hat-P-1b) has an orbital period of less than a month or so, it’s expected that tidal forces will rapidly bring the planet into synchronous rotation, in which the planet spins once on its axis every orbital period. For a circular orbit, this means that the planet always keeps one face to the star, just as the Moon keeps one side toward the Earth. If the orbit is eccentric, however, the planet will not manage to keep one side directly facing the star. Because the planet spends more time at the far point of its orbit, it does more “turning” there, and remarkably, it turns out that the planet always keeps one face pointed toward the empty focus of its elliptical orbit. From the point of view of the star, a fixed point on the planet is seen to librate. The Moon’s orbit is slightly eccentric, and so we can see this effect in time-lapse animations of lunation. See here and also (if you’re not inclined to motion sickness, here).

The tidal bulge of the planet, on the other hand, is forced to always point toward the star, as it’s the star’s gravity that is producing the differential gravitational attraction. This means that once per orbit, the tidal bulge is rocked back and forth across the planet, which produces serious internal heating. The size of the bulge also increases and decreases once per orbit due to the varying distance between the planet and the star, and the resulting oscillation also contributes to the amount of internal tidal heating.

how tidal heating works

The amount of tidal energy deposited in the planet increases with the square of the orbital eccentricity. A reasonable model for the physical properties of HAT-P-1b indicates that an eccentricity e=0.09 is adequate to generate enough tidal heating to expand the planet to its observed size of 1.36 Jupiter radii. The problem, is that the orbit should circularize on a timescale of less than 1 billion years, whereas the system seems to be about 4 billion years old. Therefore, if a significant orbital eccentricity exists, then there must be a mechanism to maintain the eccentricity. The best candidate is another planet further out in the system.

We can take a quick look to see whether such a situation holds water. A second planet in the system will exert gravitational perturbations of HAT-P-1b, which will cause its eccentricity to vary with time. The picture to have in one’s head is to imagine that the planets are viewed on a timescale that is much longer than an orbital period. If one takes the long view, the motion of the planet is effectively blurred out along the orbit, and one can model the planet as an elliptical wire of varying mass density — heavy near apastron where more time is spent, and light near periastron where the planet spends less time. The interaction between the two planets can then be modeled as the interaction between two flexible elliptical wires. When one does this, and ignores the moment-by-moment motion of the planet, one is making a “secular approximation”. Secular theory was developed to a high art in the 1770s by Laplace and Lagrange, and we can make use of their work to quickly look at how the eccentricities of two mutually interacting planets vary with time.

Over at the transitsearch.org, I have a program which computes a 2nd-order secular theory for each of the known multiple-planet systems, and plots the resulting eccentricity variations as part of the candidate information table . (To see the plots of the secular variations, click on the “planet column” for a multiple planet system such as Upsilon Andromedae).

An advantage of using the secular approximation to the dynamics is that one can quickly scan through a range of planet-planet configurations and find out what the perturbative interactions look like. If I add a second planet to the HAT-P-1 system with a period of 50 days, a mass of 0.06 Jupiter masses, and an orbital eccentricity of e=0.30, I get the following long-term variation in eccentricities, in which the eccentricity of planet b has a time-averaged value close to e=0.09:

possible secular variation

Is it possible to hide a second planet in the system while remaining consistent with the (still sparse) set of published radial velocity measurements? The downloadable console is ideally suited to quickly answering such a question. It turns out that it’s very easy to get a perfectly adequate 2-planet fit to the data in which a hypothesized perturbing outer planet is capable of maintaining a time-averaged eccentricity e=0.09 for the inner planet. One such fit looks like this:

possible secular variation

corresponding to a system configuration that looks like this:

possible secular variation

It would be exciting if a planet like the one in the above diagram (or its dynamical equivalent) could be detected. This would tell us that we’re on the right track in obtaining a better understanding of the wide range of observed radii among the known transiting planets. Probably the fastest way to detect the perturbing planet is through accurate timing of the intervals between successive transits. If an outer planet is tugging on the inner planet, then the orbit will fail to be perfectly periodic, and variations will be observed in the amount of time that passes between transits. Matt Holman and Norm Murray have written a paper that describes how this works. They give a rule-of-thumb equation for the transit-to-transit variations that one can expect. For a planet similar to HAT-P-1b, with semimaor axis a1 and period P1, and a pertubing planet with simimajor axis a2 (where a2>a1), period P2 and mass M2, they find that the typical variation of the interval between successive transits is given by

where

For HAT-P-1b and HAT-P-1c (as hypothesized above) delta T works out to about 5 seconds. Variations of this magnitude are readily detected from the ground, and a number of research groups will probably jump right on this problem.

HD 208487

Image Source.

An relevant paper showed up on the astro-ph preprint server this morning, “A Bayesian Kepler Periodogram Detects a Second Planet in HD 208487” by P. Ç. Gregory of the University of British Columbia.

Gregory employs a technique known as the parallel tempering Markov Chain Monte Carlo algorithm to argue that the HD 208487 data set contains two planets. The first planet (which was previously announced by Tinney et al. 2005, and confirmed by Butler et al. 2006) has a period of 130 days and a minimum mass 37% that of Jupiter. The second planet in Gregory’s model lies out at a period of 908 days, and has 46% of Jupiter’s mass.

Interestingly, the console does not recover Gregory’s parameters precisely, but it does find a fit that’s extremely similar. (I just uploaded the fit to the systemic back-end.) The radial velocity reflex curve looks like this:


wheras the planetary configuration (at the moment when the first radial velocity data point was obtained on Aug. 8th, 1998) looks like this:

It’s interesting to look at the fits for the latest HD 208487 dataset that have been submitted by participants in the systemic collaboration. At the moment, there are six different fits:

On September 4th, mikevald submitted a 2-planet fit that is a close analog of the one published by Gregory. In the last several days, dstew and andy have also turned in fits that have essentially the same configuration as obtained by Gregory. That’s definitely cool.

In addition to the five fits that look like the Gregory configuration, with the outer planet at a period of P~1000 days, there’s also a completely different take on the system that was submitted this morning by Olweg. In the Olweg fit, the second planet lies interior to the known planet, and has a period of only 29 days. The chi-square is less than one, indicating a slight degree of overfitting. When overfitting occurs, it can easily be remedied by a slight random perturbation of the parameters. It’s very interesting that this fit was completely missed by the Bayesian Kepler Periodogram, so I thought I would have a closer look at Olweg’s model system.

The Olweg radial velocity curve is radically different from the Gregory fit:

The 28.68 day inner planet has a mass of 0.16 Jupiter masses (about 50 Earth masses) and travels on an orbit of modest (e=0.18) eccentricity. There’s a fair amount of planet-planet interaction in this system over the time scale of the radial velocity observations. By the time the fit reaches the end of the data set, there’s a noticeable difference between the keplerian model fit and a self consistent (integrated) model fit:

The system is stable, however, when I did a short test integration of 100,000 years. The secular interaction between the two planets causes the two orbits to execute a complicated dance over a timescale of several thousand years, with the periastron angle of the inner planet orbit mostly librating around an anti-aligned configuration.

As I’ve remarked in an earlier post, we’re currently in the progress of upgrading the downloadable console so that it will be capable of computing estimates of the uncertainties in the orbital elements of a fit. A good way to generate uncertainties in this context is to use the so-called bootstrap method. In the bootstrap, one re-draws the original radial velocity data set with replacement, thus producing alternate realizations of the data in which a fraction of the points appear more than once, and in which a fraction do not appear at all. One then fits to these new datasets, thereby building up distributions for each orbital element. (For more detail, see this paper, which describes in detail how this procedure was applied to the radial velocity data set for HD 209458.) When I run a self-consistent bootstrap analysis based on the Olweg fit, I get the following mean values and standard deviations for the parameters:

This fit is thus quite well constrained, and is a completely viable competing model for describing the hd208487 planetary system. I think the situation here really underscores the value of the systemic collaboration. Many radial velocity data-sets can be fitted by completely different models that offer equally robust fits to the data, while simultaneously maintaining small uncertainties on their bootstrap-estimated parameters.

So how do we know which HD 208487 system (if either) is correct? I’m hoping that the Monte Carlo simulation that will make up phase II of the systemic project will give a great deal of insight into when a particular orbital model can be deemed secure.

TrES-2 follow-up

The transit game is getting to be a competitive global business. No sooner is a new transit announced than amateur astronomers worldwide are on the sky to obtain follow-up observations. Tonny Vanmunster, of Landen Belgium and Ron Bissinger of Pleasanton California are generally among the first to check in with confirmations. Vanmunster nailed TrES-1 a mere week after its announcement in 2004. Last summer, Bissinger caught HD 149026b on literally the day it was announced. In the case of TrES-2, which was announced yesterday, it looks like Vanmunster has snagged the prize. “What’s up, Cali?”

[Actually, it was both cloudy and the middle of the day in Pleasanton while Vanmunster was on the sky. But there’s a transit tomorrow night, Sept. 10/11 PDT, that Ron’ll likely catch.]

Here’s Vanmunster’s light curve. The transit was in progress at dusk in Belgium, so he was able to observe only the latter part of the event.

Vanmunster writes:

Here are some technical details : observations were made at CBA Belgium Observatory, using two 0.35-m f/6.3 Celestron telescopes, each equipped with an SBIG ST-7XME CCD camera. I simultaneously made unfiltered and R-band observations (hence the 2 telescopes). The included light curve is unfiltered, and each dot in the curve is the average value of 5 successive observations (binned). The gray lines show the standard deviation (about 4 millimag on average). Exposure time was 15 to 20 sec.

The egress is very evident in the light curve, and happened right at the predicted time. The transit depth was approx. 0.0155 mag, which again corresponds well with the value published in the discovery paper.

Follow-up observations such as the ones made by Vanmunster and Bissinger can be very scientifically useful. For example, Vanmunster’s 2004 observations allowed us to get an improved estimate of the TrES-1 planetary radius, and he co-authored a journal article with us on that topic. Both Vanmunster and Bissinger were involved in the discovery of X0-1, and both are co-authors on the recent Shankland et al. paper which I’ll talk up in an upcoming post.

TrES-2

TrES-2

Image Source.

When I teach Astronomy 101, I like to brag about my weight early and often during the class. For example, when I introduce the concept of energy, I’ll tell the students, “Let’s say you have a guy like me. You know, six foot three, 285 lbs (129 kg)… pause… If I’m running down the street at 9 meters per second, then my kinetic energy is 10,449 Joules.”

The first time that I floss my weight, there’s usually a slight rustle through the lecture hall, but generally nobody says anything. Students in the back row glance up slightly startled from their online poker games, then adjust their hoodies and ante up for the next hand.

As the quarter progresses, I’ll find other opportunities to claim an outrageous heft. “Take me, for example, I weigh 287 lbs… pause… solid muscle.”

Usually, that line finally gets a rise out of someone, “You don’t weigh 287!” they’ll blurt out, “You’re more like 150!”

“Are you challenging me?” I’ll roar, “Anyone want an F on the next exam?” Nervous laughter. Eventually, a few more classes in, everyone just rolls their eyes when I remind them of my outrageously high mass.

Eventually, when I get all the way out to the galactic scale, I reach the topic of dark matter and I can cash in on the long set-up. “Look at that rotation curve!” I’ll say, “The orbital velocities of the galaxies in this cluster suggest that there’s many times more mass present than we can observe in the form of stars. It’s like [pause] It’s as if some guy who looks like he weighs 160 steps on the scale and it turns out that he actually weighs 285.”

They laugh and the joke works because we’re able to look at a person and make a mental estimate of their mass. When it comes to extrasolar planets, however, judging mass by size has proved to be effectively impossible. If you are in the vicinity of a hot Jupiter, and are able to measure its radius, you’ll have little basis for judging how massive it is. That is, the mass-radius relation for hot Jupiters isn’t a single-valued function, and we don’t know why. Indeed, understanding the radii of the known transiting planets is one of the most currently interesting exoplanet research topics.

I’ve written several oklo posts about the size problem for the short-period extrasolar planets [see here, here, here, here and here]. In a nutshell, within the aggregate of transiting exoplanets that orbit stars bright enough for high-precision follow-up, there’s a full range of size discrepancies. HD 149026 b is much smaller than would be predicted for a standard-issue Jovian planet of its mass and temperature. TrES-1 has a radius that agrees very well with the theoretical predictions. HD 189733 is somewhat on the large side, and HD 209458 b, famously, is much larger than predicted. [In tomorrow’s post, I’ll give an update on the hydrodynamical simulations that we’ve been doing with the goal of eventually sorting out whether HD 209458 b is caught in Cassini state two.]

It’s therefore still a big deal whenever a new transit is discovered in association with a bright parent star. Today, the TrES collaboration, (who bagged TrES-1 back in ’04) are rolling out a new transiting planet — TrES-2.

TrES-2 is a more-or-less standard-issue hot Jupiter. At 1.28 Jupiter masses, it’s a little more massive than the average short-period planet, and its orbital period of 2.47 days is slightly shorter than the 3-day average period exhibited by this class of objects. The TrES-2 parent star is very similar in mass, radius, and temperature to the Sun. It lies in Lyra, and has a V-band magnitude of 11.4 (making it ideal for follow-up observations by amateurs — check out the transitsearch.org ephemeris table here).

Turns out that TrES-2 is on the large side. Our theoretical models predict a radius of 1.07 Jovian radii if the planet has a core, and 1.11 Jovian radii if it is core-free. The measured radius is 1.24 Jovian radii, with a lower error bar of 0.06 Jovian radii. The planet is thus a bit more than 2-sigma larger than the core-free model, and provides evidence that the mechanism responsible for providing extra heat (and expansion) to these planets is a relatively generic and commonplace phenomenon. It’s hard to invoke special purpose explanations for HD 209458 b’s radius when there’s a slew of other transiting planets that suffer a similar bloat.

One reason I like transiting planets is that they can be drawn to scale with their orbits and parent stars. In TrES-2’s case, the geometry looks like this:

TrES-2 system to scale

With Illustrator’s scale tool, it’s easy to insert TrES-2 into our planetary police line-up:

Five for the show

Curiously, the TrES-2 paper makes no mention of the metallicity of the TrES-2 parent star. The metallicity is of great interest because it will allow a test of the Guillot et al. hypothesis that the planetary radii are the result of a concentration mechanism that greatly amplifies the overall solids content of short-period exoplanets that orbit high-metallicity stars. I asked Dave Charbonneau if his team had anything up their sleeve in the metallicity department. He told me that they haven’t had time to get an accurate measurement, and that the number will be released in a follow-up paper.

Amazingly, TrES-2 lies in the field of view of the Kepler Mission. This means that the Kepler satellite will make repeated high-precision measurements of the TrES-2 light curve, with a photometric precision of about one part in 10,000 and a cadence of 15 minutes. This data will allow for very accurate determinations of the durations between transits. By observing small variations in the orbital period, you can detect other bodies in the system, in many cases with masses down into the terrestrial regime. The process by which this is done is highly analagous to the multiparameter fitting process that one uses when running the console, with transit intervals playing an analogous role to the usual radial velocity measurements. Once we get our plate cleared of current console improvements — integrator, bootstrapper, multi-threading, etc. etc., we’ll reconfigure it to enable a look at planet detection via transit timing.

New Texas V’s

Image Source.

Data data data. Robert Wittenmyer and his colleagues at the University of Texas have just posted a paper on astro-ph that contains a slew of new radial velocities for several famous planet-bearing stars, including 47 UMa, 14 Her, and 16 Cyg B. The velocities are all tabulated in the paper, so we’ll have them up on the systemic backend very shortly. [I’ll post a comment to this post when they’re up on the site. If you’re totally gung ho to get them right away, you can extract them from the posted latex file at astro-ph, and then add them manually to systemic’s datafiles directory.]

We always try to add new radial velocity data sets as soon as they become publicly available, and lately, these updates have been occurring roughly once per week. For the time being, the simplest way to get your fresh V’s is to rename your old systemic directory, and then download a new console. When the new console and catalog data are downloaded and unzipped, you can copy any previous fits and soundfiles that you’ve created into the new fits and soundClips directories.

The data in the Wittenmyer paper come from both the Harlan J. Smith 2.7-meter telescope and the Hobbey-Eberly 9.2-meter telescope. The cadence of the Smith telescope observations typifies the usual pattern of radial velocity survey data. The individual points are spaced essentially randomly in time, with many days separating each point. The Hobbey-Ebery data, on the other hand, are quite different. These data are much more densely sampled, and many nights contain several velocities in succession. In many stretches, the star is observed every few nights. This pattern results from queue-scheduling, which enables very intensive monitoring of systems that are of particular interest. I think queue scheduling is the wave of the future, and in the systemic simulation, we’ll have many synthetic data sets whose cadences correspond to the queue-scheduled approach.

The most prominent planet orbiting 14 Her has been known since the late 1990s. This world, known as 14 Her “b”, has a minimum mass about 4.6 times that of Jupiter, and a period of ~1770 days. If it were in our solar system, it would orbit in the asteroid belt. The parent star 14 Her is about 90% as massive as the Sun, and is more than twice as metal-rich. Given the planet-metallicity connection, it’s absolutely no surprise that 14 Her has a heavy-duty planetary system. I bet that 14 Her “b” has a very interesting system of satellites.

It’s pretty clear from the one planet fit that 14 Her “b” is not the only planet in the system, and over the weekend, several systemic users have submitted interesting fits to the data that reduce the chi-square by adding a second planet. For example, on August 30, user mikevald uploaded a two-planet fit in which the second planet, 14 Her “c”, has a period of 6159 days and an eccentricity e=0.52. This model currently fields the lowest chi-square statistic of any of the submitted 14 Her fits. The orbits in this best-fit system are crossing, however, indicating that the model may not be dynamically stable over the long run. On September 5th, allanfloering submitted a fit with nearly as good a chi-square, in which the outer planet has a 14,669 day period and an eccentricity e=0.09. Allanfloering’s world, if it exists, lies 11.77 AU from 14 Her, out at a Saturn-like distance.

Wittenmyer et al. show that the addition of their new 14 Her data suggests that 14 Her “c” has a period of order 6900 days, albeit with a low eccentricity. In their models, “c” and “b” may be participating in 4:1 resonance. A quick fit on the console with the Wittenmyer et al data included gives a radial velocity curve that looks like this:

corresponding to a planetary configuration that has an outer planet with a modest eccentricity e=0.20.

As soon as the data go up on the site, feel free to try working up improvements. It will be interesting to see how many fits to the full 3-telescope data set are participating in 4:1 resonance.

Web 2.0

fenceposts at ucsc

Hey ya’ll, there’s a whole lotta fittin’ goin on out there in the back 40.

Seriously, though. We’re really seeing a great response from users who are contributing their efforts. Nearly 200 people have registered on the back-end during the past few days, and over 750 different radial velocity fits have been uploaded. Hopefully we’ll see that work continue to flow in, and everyone has been showing admirable patience as we smooth out the inevitable rough spots which began to show up as soon as we had a surge of real users on the site.

If you’re arriving by way of the Sky and Telescope article, you’ll notice that the full universe of 100,000 synthetic stars is not yet listed on the systemic backend. During September, we’re still carrying out the first phase of our planned research effort, which consists of accumulating a wide variety of fits to the full collection of actual, published radial velocity data sets. Very soon, we will have accumulated enough fits to be able to present a dynamic, interactive catalog of candidate planets. A query-based dynamically generated planetary catalog will allow a variety of very interesting questions to be answered. For instance, by how much can one deflate the famous eccentricity-period diagram, while still demanding a prespecified goodness-of-fit for all of the candidate planets?

generated at exoplanet.eu

At the moment, such questions are hard to answer, because (other than here at oklo) there is no consolidated repository of radial velocity data and associated self-consistent fits.

In order to make dynamically generated planet catalogs scientifically useful, we’re going to have to provide several more tools to the users. As I mentioned yesterday, the console will soon be multi-threaded, which will make it easier to use for high-performance work. In the interim, however, you can have the console print a stream of diagnostic messages by launching it from the command line. For example, on linux or OSX architectures, open a terminal (shell), cd to the systemic directory, and type java -jar systemic.jar at the prompt . The diagnostics provide a running update of the progress of the console as it produces fits to the data set.

We’ll also soon be providing a long-term integration window that will allow users to verify that their model systems are dynamically stable. It’s alarmingly easy to find multiple-planet fits to radial velocity data sets that have low values for the reduced chi-square statistic, but in which the planets experience dynamical disasters (collisions, ejections, close encounters, etc.) on a time scale that is short in comparison to the known age of the parent star. Indeed, most of the candidate stars in the back-end catalog are more than 2 billion years old. Young stars tend to be rapidly rotating, which broadens their absorption lines and makes radial velocity measurements less accurate. Rapidly rotating stars also tend to have elevated levels of magnetically driven chromospheric activity, which adds additional noise to the velocity estimates.

And finally, the console needs to provide error estimates on the orbital parameters that it generates. This is best done using the so-called bootstrap method, which we’ll discuss in an upcoming post.

consolidation

Image Source.

Wow! The American Scientist and Sky and Telescope articles are clearly getting the word out. We’ve been seeing a significant increase in traffic on the oklo.org site, both in terms of visits (yellow bars) and bandwidth and page views (green and blue bars). The bandwidth increase is especially gratifying. It reflects the fact that many users are registering on the back-end, downloading the console, and submitting fits. As I write this, new and interesting fits for a variety of different radial velocity data sets are rolling in to the star catalog. Our goal of fostering original, public-participation exoplanet research is starting to be realized, and I want to thank everyone who’s lending a hand.

Late August stats.

If you’re a first-time visitor to the Systemic Project website, please read the blog entries that were posted prior to this entry. They contain the information you need to start participating, and they give an overview of the current project status. If you are a return visitor, please have a look at the updated back-end. Stefano has made a number of code and design improvements that streamline the workflow and make the site easier to navigate.

On to some planet issues. The Mu Ara (HD 169061) system, which contains four known planets, is shaping up to have significant implications for the systemic project. Intense interest in the system has been spurred by a recent paper from the Swiss group (Pepe et al. 2006) that presents a self-consistent 4-planet model. Pepe et al.’s orbital fit (given in their Table 1) provides an excellent match to the radial velocity data sets, but when they carried out a long-term integration of the system, they found that the gravitational interactions between the planets lead to catastrophe after 76 million years. The parent star Mu Arae has an estimated age of 6.4 billion years, so clearly we don’t yet have a full understanding of what’s going on with this system.

The discord within the Pepe et al. model is provided by the two middle planets, one of which has a 310 day orbit, and the other which orbits in 643 days. The planets are on the edge of the 2:1 mean motion resonance, with the practical consequence that they experience a strongly chaotic orbital evolution. The orbits change eccentricity and orientation on a timescale of only decades:

I’ve made a movie that tracks the evolution of the orbits over 528 years. Here are links to a .mov version (288 kB) and an .mp4 version (1.5 MB). It’s clear from the movie that the interaction is both complicated and unpredictable. The planets display no catastrophic excursions on the 500 year timescale of the movie, but eventually, they experience orbit crossings leading to a likely ejection of the inner 0.5 Jupiter mass planet.

The Mu Ara dataset HD169061_B06P06CH on the console back-end combines both the Pepe et al. data as well as the most recent data from Butler et al. 2006. I’m hoping that someone can get a stable, self-consistent, low chi-square fit to this combined data set. Such a fit would give the best available view of what’s going on with the system, and would underscore the scientific relevance of the systemic project.

The mu Arae four

flowerstalk

Image Source.

With the verdict in on Pluto, we here at oklo.org will have to revert to sober, scientifically rigorous posts on extrasolar planetary systems to keep our readership and ad rates up. And as soon as I can figure out how to make WordPress launch those “swing for the fences” pop-ups from our site, we’ll be increasing our revenue stream even more.

American Scientist has just published my article on planet formation and extrasolar planets in their September/October issue. The article wraps up with a description of the systemic console, and the systemic collaborative research project. If you’re an American Scientist reader visiting oklo.org for the first time, welcome aboard!

Several posts back, I put up a brief description of the immediate goals of the Systemic collaboration:

The Systemic collaboration is proceeding in three steps. In the first step, which is ongoing, we’ve been gathering all of the radial velocity data that have been published for known planet-bearing stars. These data sets are included in the downloadable systemic console, and the systemic back-end allows participants to upload their own planetary fits to this data. We want to use the data to create a uniform catalog of known planetary systems.

In the second and third phases of the systemic project, we’ll be studying synthetic data sets that have been produced using our own algorithms. “Systemic Jr.” will launch at the beginning of September, and will contain 100 synthetic data sets, four of which will be special challenge systems. The Systemic Challenge, sponsored by Sky and Telescope will be explained in more detail, and will be available at a link on their website. The challenge systems will be released on September 3, 10, 17, and 24, along with a specific set of contest rules. The first person to crack each of these systems will recieve a paperback edition of the Millennium Star Atlas (a $149.95 value). In order to prepare for the contests, go ahead and download a copy of the systemic console, and work through tutorials one, two, and three. A full technical manual for the console is in the works, and will be ready for download quite soon.

Later this Fall, when Systemic Jr. wraps up, we’ll launch the full Systemic simulation. A lot more on this will be posted in the weeks ahead. Our overall goal is to obtain an improved statistical characterization of the galactic planetary census.

The most interesting serious-planet news from the past week has been the paper by the Geneva Extrasolar Planet Search Team that releases an updated radial velocity data set for the nearby solar-type star Mu Arae (also known as HD 160691). As discussed in this post, the console can be used to quickly uncover and characterize the orbits of the four planets that have been announced for the system.

The mu Arae system is remarkable because the two middle planets (with periods P~300 days, planet “d”, and P~640 days, planet “b”) experience strong mutual gravitational interactions during the 5-year time period that the system has been observed. The presence of strong interactions indicates that a model for the system built from independant Keplerian orbits cannot provide a fully realistic fit to the system. In order to build a fully self-consistent fit, one must find an N-body model. The systemic console has this ability, which is enabled whenever the “integrate” box is checked.

N-body integrations are much more time-consuming to compute than simple evaluations of Keplerian fitting functions. The performance of the console thus slows down considerably when integration is enabled. (Note also, that this post now becomes a bit technical. If it sounds like gibberish, you can either skim the next few paragraphs, or, better yet, work through the tutorials on the use of the console.)

Continue reading

Muarainos

lift your skinny fists like antennae to heaven

Image Source.

Some things don’t change. Even back in 1846, the planet detection business in our solar system was a rough-and-tumble game. No sooner had Urbain Jean Joseph LeVerrier announced his prediction of the existence and position of Neptune, and had it dramatically verified by Galle and d’Arrest, than the British tried to jump all over the discovery and claim priority for Adams! Not to mention that tricky issue of names. LeVerrier tried various jostling maneuvers with the French Academy to try to get his planet named after himself, but his machinations were unsuccesful and Neptune stuck.

At least LeVerrier didn’t have to wrangle with Nineteenth Century player haters rushing to either (1) strip his newfound world of its planet status, or (2) consign it to the marginalia of the solar system. Neptune packs 8,065.34 times the mass of Pluto and 68,286.7 times the mass of Charon. It’s a planet with a capital P.

Here’s what I find amazing. The dramatic tension of the Prague IAU meeting apparently hinges on the future nomenclature for 2003 UB-313 and its ilk. Even the New York Times, the United States paper of record, makes the episode seem like one of the scientific Big Deals of the year. Oklo dot org manages to climb out of its summer visitors slump on the basis of two chatty posts on the Pluto debate. While all this is going on, an amazing multiple-planet system orbiting the nearby solar-type star HD 160691 receives a new planet and a dramatically improved characterization, and hardly anyone notices.

The downloadable systemic console and the systemic back-end contain several data-sets for HD 169061. The exact data set used by the Geneva group in their astro-ph paper from yesterday is listed in the system menu as HD160691_M04P06CH. (No sooner had I laboriously typed in the table from the .pdf file than Eugenio pointed out that one can simply copy-paste from the text file source on astro-ph. Doh!)

The data used by the Geneva group comes from three telescopes. It includes AAT data from McCarthy et al. 2004, as well as older data from Coralie and new, extremely high-precision data from HARPS. The console therefore loads with three offset sliders.

Continue reading

Roll your own.

succulent

Image Source.

The October 2006 issue of Sky and Telescope is just hitting the stands. It contains a feature article — Virtual Planet Sleuths — on the usage of the console and the Systemic collaborative project. If you’ve read the Sky and Telescope article, and are a first-time visitor to oklo.org, welcome aboard!

The Systemic collaboration is proceeding in three steps. In the first step, which is ongoing, we’ve been gathering all of the radial velocity data that have been published for known planet-bearing stars. These data sets are included in the downloadable systemic console, and the systemic back-end allows participants to upload their own planetary fits to this data. We want to use the data to create a uniform catalog of known planetary systems.

In the second and third phases of the systemic project, we’ll be studying synthetic data sets that have been produced using our own algorithms. “Systemic Jr.” will launch at the beginning of September, and will contain 100 synthetic data sets, four of which will be special challenge systems. The Systemic Challenge, sponsored by Sky and Telescope will be explained in more detail, and will be available at a link on their website. The challenge systems will be released on September 3, 10, 17, and 24, along with a specific set of contest rules. The first person to crack each of these systems will recieve a paperback edition of the Millennium Star Atlas (a $149.95 value).

Later this Fall, when Systemic Jr. wraps up, we’ll launch the full Systemic simulation. A lot more on this will be posted in the weeks ahead. Our overall goal is to obtain an improved statistical characterization of the galactic planetary census.

In the Sky and Telescope article, I made a rather bold claim that by using the console, it’s possible to find an as-yet unannounced planet around more than a dozen different stars. The 55 Cancri data set, for example, is an excellent place for aspiring planet hunters to try their hand.

The feasibility of detecting planets in the published data sets was illustrated dramatically over the past week. On August 14th, Krzysztof Gozdziewski, Andrzej Maciejewski, and Cezary Migaszewski posted a preprint on astro-ph which describes their detection of a fourth — then unknown and then unconfirmed — planet orbiting HD 160691 (also known as mu Ara). They detected the planet using their own software, which has a similar set of capabilities to the systemic console, and they used the dataset provided by the recent Butler et al. 2006 catalog paper. They found an orbital period of P~307 days for the planet, a nearly circular orbit, and a mass of 0.5 Jupiter Masses.

Today, on astro-ph, the Geneva Radial Velocity Search team published a paper with an updated set of radial velocities of HD 160691 which were obtained with the HARPS instrument at La Silla. In the abstract of their paper, they write: “We present the discovery of mu Ara d, a new planet on an almost circular 310-days period and with a mass of 0.52 Jupiter Masses”.

So there you go, folks! The planets are in the data sets. You just need to download the console, fire it up, get a good fit, and submit it to the Systemic back-end.

[Note: It’s not clear what (if any) “credit” Gozdziewski et al. will get for their discovery. I don’t want to proffer an opinion on who should get credit in a case like this, mainly because I really don’t care. The Systemic backend includes a public-record chronological list of submitted fits for each radial velocity data set. If you turn up a planetary configuration that later gets confirmed by one of the radial velocity teams, you’ll get the personal satisfaction of knowing you knew about the planet first. What you almost certainly won’t get, however, is official credit for the discovery, or the right to name the planet, etc., etc.

For the synthetic planets in phases 2 and 3 of the Systemic collaboration, however, the discoverers will receive official credit, and they will have the right to name the planets if they choose to do so.]

Thresholds

mandarin sunlight

Image Source.

Last week, I started a series of posts that will examine the feasibility of detecting a habitable terrestrial planet orbiting Alpha Centauri B. We want to do this from the ground, using the proven radial velocity technique. Our strategy will be to build a ~1 meter telescope in (probably) Chile with a high-precision spectrometer. The telescope will be used exclusively to obtain velocities of Alpha Centauri B, night after night, whenever the star is above the horizon, and whenever the weather is good.

At La Silla, Alpha Centauri never quite sets below the horizon. From roughly October through December, however, the star is generally too low in the sky to be adequately observed. This generates a yearly periodicity in a simulated 5-year radial velocity time series:
Alpha B time series
(Note that in the original version of last week’s post, I posted an incorrect file version of this figure. The plot has now been replaced in the post with the correct plot.)

The 96076-point time series shown above was generated by Eugenio under the assumption that we can obtain the same radial velocity precision that the HARPS spectrograph obtained on HD69830 (which is a near-twin to Alpha Centauri B). The average radial velocity error is 0.8 m/s, and the observing cadence is 200 seconds. The periodogram shows crystal clear evidence of three of the four terrestrial-mass planets in the simulated system.

alpha B periodogram 1

The large peak in the periodogram at P=347 days corresponds to a planet with half an Earth mass. The two interior peaks are produced by planets with masses similar to Mars. If the planetary masses are doubled, that is, if the largest planet in the system has one Earth mass, then the evidence from the time series is even more overwhelming (the data set is available on the downloadable console as AlphaCenB_m2Y5):

alpha B periodogram 2.

Now I know that scientific progress is the important issue at stake here, and I’m very excited about the upcoming Kepler mission, and the fact that it will be detecting Earth-sized planets in the habitable zones of 12-14 magnitude stars. That’ll be cool. Nevertheless, we’d like to beat Kepler to the punch. We’d like to bag the first habitable Earth-mass planet from the ground. Can we do it?

Kepler is currently scheduled for launch in October 2008. To be confident of an Earth-mass planet in the habitable zone of one of their target stars, they’ll need to see four successive transits. This means that a reasonable date for their big press conference is Dec. 21, 2012. That gives us six years.

There’s a big difference between noisily posting synthetic observations on a blog, and actually observing Alpha Centauri with a purpose-built ~5 million dollar dedicated telescope in the Southern Hemisphere. It’s safe to say that we won’t be seeing first light a year from now, and therefore we won’t have a five-year data stream by the time the current long count is up.

On the other hand, the above periodogram for the Earth-mass planet constitutes an incredibly strong detection. We can be confident in the presence of the planet with considerably less data.

So consider the following example. Let’s say that instead of obtaining HARPS-like 0.8 m/s precision, we’re only able to get 3 m/s precision. This could be the result of Alpha Centauri B showing more short-term jitter than expected, or because we don’t have enough dough to commision an absolutely state-of-the-art spectrometer. Let’s also assume that we only observe for two years rather than five. In this case, the periodogram looks like this:

alpha B periodogram 3

We’ll definitely need to do a proper statistical analysis, but from appearances alone, “chi-by-eye”, the planet is clearly still there at the many sigma level.

Earth. Ground. Inexpensive. Soon.

canteloupe terrain

Image Source.

Everything that we know about planet formation indicates that both Alpha Centauri A and Alpha Centauri B should be accompanied by terrestrial planet systems. Long-term integrations show that the dynamical environment is stable. Simulations using the Wetherill-Chambers method show that the accretion of terrestrial-sized bodies should proceed with an equal or greater ease than was the case in our own solar system. The metallicity of Alpha Centauri is significantly supersolar, which points toward the availability of plenty of raw material for forming terrestrial planets.

The terrestrial planets orbiting Alpha Centauri A and B were likely assembled from dried-out planetesimals. Pertubations from Proxima, however, would have stirred up Alpha Centauri’s circumbinary analog of the Kuiper belt, providing a mechanism for the delivery of volatiles to terrestrial bodies orbiting A and B.

In a string of posts last month [most recent here], we laid out the case for the existence of terrestrial planets in the Alpha Centauri system. We argued that if one of these planets has an Earth-mass and a habitable orbit, then it is detectable with a flat-out effort by the HARPS spectrograph. We based our argument on the fact that HARPS was recently used to produce an amazing detection of three Neptune-mass worlds orbiting HD 69830 — an old, chromospherically quiet K0V star that is a near-exact twin of Alpha Centauri B.

This presents quite an interesting situation. HARPS, at La Silla, and the AAT in Australia are the only instruments in the world that currently could conceivably be used to make the detection. The APF telescope can’t see the Southern Sky, and the wider astronomical community would never allow one of the VLTs to be commandered for an all-out effort on one charismatic system. Furthermore, both HARPS and AAT are currently hard at work on large-scale radial velocity surveys. This means that [1] we’re unlikely to get scooped, and [2] we’ll have to build a special-purpose telescope if we want to explore the Alpha Centauri planetary system.

Eugenio and Aaron and I have begun a detailed feasibility study of a dedicated, state-of-the-art radial velocity campaign on Alpha Centauri B. So far, the results have been encouraging — nothing resembling a showstopper has turned up yet. The purpose of the next few posts is to report what we’ve learned so far. We’ll be posting data files so that interested readers can replicate (and if they want to, extend) our work using either their own routines or the downloadable systemic console.

We’re extremely lucky to have a metal-rich KOV dwarf star lying just 1.3 parsecs away. Alpha Centauri B is roughly 100 times brighter than any other equally desirable radial velocity candidate star. The presence of Alpha Centauri A on its 80 year orbit, however, poses a complication for the fitting procedure of radial velocities from B. This problem seems readily solvable, however, and we’ll examine it in much more depth in one of the upcoming posts. Here, we’ll assume that the long-term large-amplitude radial velocity signal arising from A has been correctly filtered out of the data.

Our first step, then, was to invent some terrestrial planetary systems. Our systems have been produced with a Wetherill-Chambers method accretion code, and are both dynamically stable, and organically farmed in the Alpha Centauri AB environment.

Once a terrestrial planetary system has been created, it is observed with Eugenio’s TAC code. The TAC code is provided with a location on Earth (we’re producing synthetic data from telescopes located at La Silla and at the South Pole), and the position of the target star on the sky. Based on the readout time for the HARPS spectrograph, we assume an observing cadence of 200 seconds. Radial velocities are obtained whenever (1) the simulated weather is clear, (2) the Sun is more than 102 degrees from the zenith, and (3) Alpha Centauri is at less than 2.5 air masses. With its declination of -60 degrees, Alpha Centauri is circumpolar at La Silla, which significantly improves its overall observability. Observational errors are drawn from a normal distribution implied by the RMS residuals to the HD 69830 fit. We’re proactively aware that this is only a first approximation. (Over at my other job, we’ve been spending a fair amount of time thinking about autoregressive conditional heteroskedasticity.)

After running the TAC code, we find that 96,464 radial velocities are obtained in a trial five-year observing session. That’s one helluva RV data set. The complete time series has been added to the datafiles directory of the downloadable systemic console. You can access it by selecting “other” from the bottom of the system menu and opening the file AlphaCenB_Y5.sys. Note that because of the large size of this data set, the console function will be very slow. Patience is required. If you want to use your own software, the time series is AlphaCenB_Y5.vels.

When 96,076 velocities are all displayed in the data window, the resulting plot shows the yearly modulation of observability:

Alpha B time series

If you zoom to the highest time resolution, you can see the blocks of radial velocities obtained on successive nights:

simulated high-resolution time series detail for Alpha Centauri B

The periodogram says it all:

periodogram of synthetic data for Alpha Centauri B

The peak at 351 days corresponds to a half Earth-mass planet. The three neighboring peaks correspond to smaller planets having masses on the order of Mars.

Aaron tweaked the code for the folding window so that large datasets can be usefully manipulated. When the data is folded at 351 days, the periodicity is ever so faintly visible. Thanks to Joseph Fourier, however, the planets are clearly, unmistakeably detectable in the periodogram.

folded synthetic alpha centauri B data

In the upcoming posts, we’ll talk in detail about the results of fitting to this data, and how the fit compares to the actual planetary system under observation. We’ll also look at modeling systematic error, non-gaussian noise, uncertainty, biases and so forth. These complications will inevitably erode the size of the peak in the above periodogram. Then we’ll implement a double-blind experiment on a set of 10 individual time series. Then we’ll talk about the confounding factors introduced by the binary companion. Then we’ll talk strategy.

still feel gone

Back in March, I wrote about how the systemic console could be used to locate a tentative second planet orbiting 51 Peg. The power in the residuals periodogram, and an extensive Monte-Carlo analysis show strong evidence for a Saturn-mass world in a habitable-zone orbit. I was thus quite excited on Saturday when the California-Carnegie group released a heavy-hitting catalog paper that includes (among many other interesting things) 256 re-analyzed Lick Observatory velocities for 51 Peg. These velocity data points are of high quality, with generally small errors.

After using the console to fit out 51 Peg b, the residuals periodogram for all the data still shows a strong secondary peak. The period has shifted, however, to 345 days, and the relative power has declined somewhat with the addition of the new Lick data:

When the residuals are folded at a 345 day period, there’s a visible hint of periodicity:

Note, however, that there are a huge number of points in the right-hand part of the diagram. These are primarily points taken at Lick during the Fall of 1995, just after the Swiss discovery announcement. There’s a scarcity of points near the middle of the diagram resulting from the near-match between 345 days and one year. The star can’t be observed when it’s near the Sun in the sky.

Using the console to get a 2-planet fit, the preferred mass of “c” is still about a Saturn mass, but the eccentricity has increased to e=0.59. This is a worrisome development. The system is still perfectly stable, and an eccentricity of 0.59 is certainly within the range exhibited by exoplanets. The problem is that the fit has adjusted itself so that the pronounced radial velocity swings of the outer planet tend to occur where there is no data.

The Lick data therefore seem to have taken some of the air out of 51 Peg c. It would be good to see whether there’s any hint at all of planet “c” if we consider just the Lick velocities. This is easy to do. Just delete the line containing “51peg_ELODIE04.vels” from the 51peg_B06L.sys file in the datafiles directory that comes with the downloadable console.

Don’t worry if you screw something up. You can toss out a busted console and download a fresh one because they’re free! The only problem with downloading a lot of consoles is that the Internet is not something you just dump something on. It’s not a truck. It’s a series of tubes. And if you don’t understand those tubes can be filled, and if they are filled, when you try to get your new console out, it gets in line and its going to be delayed by anyone that puts into that tube enormous amounts of Internets, enormous numbers of consoles.

When one looks at the Lick data set by itself, the one-planet fit has a required jitter of only 3.6 m/s. This is pretty well in line with the level of astrophysical non-planet noise that would be expected from a star like 51 Peg. There’s really nothing in the Lick-only data to suggest that the model needs a second planet. The strong 350-day residual periodicity is thus present in the Swiss data, but not in the Lick data. In particular, the residuals periodogram to the one-planet fit shows absolutely nothing of interest near 350 days

In my post from last March, I wrote that:

It could very well be true that the 356. day periodicity is due to a systematic effect in the data that has nothing to do with a planet. I would not be surprised at all if this is the real explanation. That is, the observational results might be subject to a small seasonally dependent effect produced by the telescope — as a straw-man example, the temperature of the instrument might have a slight effect on the measured radial velocity. The variation could also have an astrophysical source that has nothing to do with a second planet.

The latest data release from the Lick group certainly seems to favor this conclusion. A telescope-dependent effect is highly unlikely to be present in two independent data sets. The fact that the periodicity is present in only one set of data points toward and Earth-based, rather than a 51 Peg c-based explanation for the periodicity. In the older post, I also wrote that:

As a working scientist, I’ve found that about 95 to 97% of the seemingly publishable “discoveries” that I stumble across end up being spurious for one reason or another. Hope springs eternal, but it always pays to temper one’s enthusiasm!

Continues to be true.

data data data

mirror in the boardwalk please talk free

Saturday was an epic day for the radial velocity consuming public. Paul Butler and the California-Carnegie planet search team published a blockbuster paper in the Astrophysical Journal, and it looks like the first weekend’s gross is gonna be huge. The paper announces the detections of five new planets, and publishes re-analyzed and (in many cases) greatly expanded radial velocity data sets for no less than eighty three planet-bearing stars. The velocities are all available in machine-readable tabular form. No dextering, no unfolding, no typing, no postscript extractions. As an added plus, the paper also provides the latest estimates for jitter, mass, metallicity, and vsin(i) for all of the tabulated stars.

Needless to say, there’s a great deal of interesting data in this compendium. The updated 55 Cancri velocities, for example, should aid the characterization of a fully self-consistent model of that system. The slew of fresh velocities will be of great help in constraining the uncertainties in the transit predictions for planet bearing stars.

I dug right in to see how the 51 Peg system (described in a series of posts detailed here) is holding up. There are now 256 new and updated velocities from Lick Observatory to complement the 153 published Swiss velocities. The time-series shows a well-sampled mixture of long-term cadence and intensive monitoring.

all the 51 peg velocities

Needless to say, 51 Peg b is still present with a vengeance. The power spectrum of the combined 409-point data set has a certain overwhelming 4.231 day character:

power spectrum of all the 51 peg velocities

The data set phased at 4.2307 days shows a very nice sinusoid. About a thousand orbits have been folded down to make this plot:
all the 51 peg velocities folded together

So how does 51 Peg “c” fare in the new dataset? I’ll post an analysis tomorrow. If you’re impatient, though, you can use the downloadable console to investigate what the new data has to say.

extraterrestrial

thistle against a white background

Image Source

We’re working hard to keep the systemic project moving forward.

Eugenio, as of July 14th, has compiled and documented all of the published radial velocity data sets, and has been designing and developing the “KeckTAC” code, which will be a workhorse for systemic’s next phase. The published datasets are all available on the systemic systems catalog. Aaron has stripped the console down to its component parts, and he’s rebuilding it with new features, faster algorithms and a sleekly expandable architecture. Stefano has been tweaking the systemic backend [sign up and get fittin’, y’all -ed.], and will be arriving at UCSC in the Fall to do his Ph.D. research. We’re hoping that part of his thesis will be a statistical analysis of the final results of the 100,000 star systemic simulation.

When I was in graduate school, I spent a lot of time doing research on brown dwarfs (objects between 13 and 75 Jupiter masses that lie in the mass range between giant planets and red dwarf stars). At that time, circa 1992, no bona-fide brown dwarfs had actually been found, but the prospects for detecting them seemed reasonably good. My friend Todd Henry, who was a graduate student at the University of Arizona, and who was hunting for brown dwarfs using the speckle method, told me something that stuck in my mind.

“Face it, Greg,” he said, “the reason you’re interested in brown dwarfs is not because you’re interested in Brown Dwarfs — the reason you’re interested in brown dwarfs is because you’re really interested in planets, and brown dwarfs are just one stop away on the line.”

He was right.

A similar logic might apply today, “The reason I’m interested in giant planets is not because I’m really interested in Giant Planets — the reason I’m interested in giant planets is because I’m really interested in habitable terrestrial planets, and giant planets are one stop away on the line.”

Pollux

Image Source.

Several weeks ago, the planet count at the extrasolar planets encyclopedia notched up by one with the announcement by Artie Hatzes and his collaborators that Pollux (Beta Geminorum) is accompanied by a ~2-3 Jupiter mass planet on a 590 day orbit. This world has been under construction for a long time. The first published radial velocity data point for the star dates back to Nov. 15th, 1980, and Hatzes et al. brought 55 new radial velocities to the table to seal the detection. The planet was independently confirmed by Reffert et al., who (in a preprint posted July 7th) deliver an additional 80 high-precision velocities.

velocities for beta gem

All told, there are now seven published datasets, and all are available on both the on-line and downloadable versions of the console. When folded together, at a 593 (1.6 year) period, a full quarter century’s worth of radial velocity data show the planet quite nicely.

After the Sun, Pollux is the 17th brightest star in the sky. It’s prominently visible both because it’s close (34 light years) and also because it’s an intrinsically bright K0III giant star. Pollux is about 1.9 times more massive than the Sun, and is already coming to the end of its life. It has left the main sequence, and is beginning its long trek up the red giant branch of the Hertzsprung Russell diagram.

In last Saturday’s post, I wrote about predictions of the core-accretion hypothesis with respect to planet formation. The ability to quickly build a Jovian-mass planet depends on the surface density of solid material in the protostellar disk. A lot of solids leads to rapid buildup of cores, and hence the ability of planets to achieve rapid gas accretion before the protostellar disk dissipates. (The spiral wave-induced evolution of marginally gravitationally stable disks leads one to expect that disk masses will correlate with the masses of the central stars, see this paper for a lot more discussion.) All other factors being equal, one expects that Jupiter-mass planets will be rarer around stars that have significantly less mass than the Sun, and that conversely, Jupiter-mass planets will be more common around planets of somewhat higher mass than the Sun. (Note that for really massive stars, the luminosity of the star itself will rapidly photo-evaporate the disk, which will cause problems for giant planet formation via core accretion).

Unfortunately, it gets increasingly harder to apply the radial velocity detection method to Main Sequence stars that are considerably more massive than the Sun. The higher temperatures of these stars lead to weaker spectral lines. Weaker spectral lines make it hard to get really accurate radial velocities. Higher mass stars also tend to be fast rotaters, which further smears out the lines, and they are often subject to pulsations which can mimic the radial velocity signature of an orbiting planet. Above about 1.3-1.4 solar masses, it thus becomes hard to survey main sequence stars for planets.

Luckily, however, a trick can be used to assess the planet frequency for high-mass stars. As a star that has ~1.5-3 solar masses ends its main-sequence hydrogen burning life, its core begins to contract and its outer layers swell up and cool down. The atmosphere of the star then regains the wealth of spectral lines that can be used to make accurate radial velocity measurments, and hence detect planetary companions. The core accretion theory predicts that planet hunting around such giant stars should be a highly profitable enterprise.

The sand reckoner

shallow water caustics

Image source.

Four out of five astrophysicists surveyed recommend the core-accretion theory to those interested in planet formation theories.

Oklo regulars know that I lean toward core-accretion over gravitational instability as an explanation of the dominant mode of planet formation. I think that core-accretion does a superb job of explaining the planet-metallicity connection, and I don’t think that the initial conditions that underlie hydrodynamical calculations that show disk fragmentation are physically realistic.

The key aspect of core-accretion is that it is a threshold phenomenon. If a planetary core reaches a Neptune-like mass of ~10-20 Earth masses while there is still gas in the protoplanetary disk, then it will rapidly accrete that gas, and (in most cases) increase its mass by a factor of ten or more. On the other hand, if a core reaches a Neptune mass after the gas is gone, then the growth will cut off, and the core will end its days as a modest ice giant.

The amount of time that it takes for a core to reach the phase of rapid gas accretion depends sensitively on the amount of solid material that is available in the disk in the form of planetesimals. A disk with a high surface density of solids is capable of rapidly assembling a core, thereby forming a Jovian-mass gas giant quite quickly. Recent simulations suggest that an average protostellar disk surrounding a star of solar metallicity will lie right at the threshold of being able to manufacture a Jovian planet. This result gives a satisfying mesh with the observations. As stellar metallicity exceeds solar, the fraction of stars with detectable Jovian-mass planets increases very rapidly. Disks that form their Jovian planets early-on are better able to migrate them into the terrestrial region where they can easily be detected. Stars of solar mass and metallicity will tend to have giant planets that remained, like Jupiter, more or less where they formed. Stars with subsolar metallicity will rarely be accompanied by Jupiter-mass planets.

time to formation of a jovian planet as a function of surface density

In addition to explaining the planet-metallicity connection, core-accretion provides a number of other testable predictions. Our simulations suggest that a growing planet orbiting a star with 40 percent of the Sun’s mass will require more than 10 million years to “go Jovian.” After 10 million years, however, the gas in most protostellar disks is long gone. The core-accretion theory predicts, therefore, that low-mass red dwarf stars should very often be accompanied by Neptune-mass planets but should almost never have Jupiter-mass companions.

The surface density of solids in a protostellar disk is correlated with metallicity, and some heavy elements are more important than others. Oxygen, for example, in the form of water ice, is of fundamental importance for building cores. At given mass and overall metallicity, therefore, a disk that is naturally rich in oxygen should be better able to form Jupiter-mass planets. Silicon-rich disks too, should have an enhanced capacity for building gas giants.

208 nights, please

life on alpha Cen Bb

image source

The data from the Hipparcos satellite indicate that it’s very likely that Proxima Centauri is in orbit around Alpha Centauri. Proxima has not simply been caught in the midst of a stellar drive-by. It’s cool, certainly, that our nearest stellar neighbors are going along to get along, but is there any scientific importance in the fact that Proxima and Alpha are gravitationally bound?

The answer to this question is a definite yes.

If Proxima is in orbit around Alpha, then we can safely assume that the three stars formed together from the same giant molecular cloud. Therefore, all three have the same age and metallicity. Alpha Centauri A and B, furthermore, are among the best-studied stars in the galaxy; a query to Simbad on Alpha Cen returns a cool 311 citations during the 1983-2006 timeframe. The fact that they are so close and so bright means that very detailed and accurate models can be made of their properties. It’s been clear, for example, since the early 1970s, that the stars are more metal-rich than the Sun. The most recent determination (by Jeff Valenti and Debra Fischer) puts the metallicity at 0.19 “dex”, or 150% of the solar value. Other recent studies suggest even higher metallicities. A detailed modeling study by Eggenberger et al. 2004 finds an age for the stars of 6.52 billion years (plus or minus 300 million years). Proxima was 2 billion years old when the Sun and Earth formed, and it will outlast the Sun on the Main Sequence by 5 trillion years.

Metallicities for red dwarf stars are notoriously difficult to determine. Low-mass red dwarfs are cool enough so that molecules such as titanium oxide, water, and carbon monoxide are able to form in the stellar atmospheres. The presence of molecules leads to a huge number of lines in the spectra, which destroys the ability to fix a continuum level, and makes abundance determinations very difficult.

Recent progress on the red dwarf metallicity problem has been made by Bonfils et al. (2005) who employed a clever approach. They use the fact that when a red dwarf is a member of a multiple system (like Proxima) in which the primary star is more massive, then the metallicity of the red dwarf can be induced by measuring the metallicity of the primary star. Bonfils et al. found 20 nearby binary pairs where this trick was possible, thus giving them the metallicities of 20 red dwarf stars. They then developed an empirical metallicity calibration for red dwarfs based on easily measured photometric indices. Using this technique, they were able to estimate that GJ 876 has a metallicity of +0.02 dex, very close to the solar value. (The fact that GJ 876 is not particularly metal-rich makes one wonder how it managed to put together such an off-the-hook planetary system, but that’s a different topic.)

With Proxima bound to Alpha, we know that its metallicity is ~0.2 dex, which will provide a very important new point of improvement for calibrations based on the Bonfils et al. technique. Of the 20 stars in the Bonfils calibration, only five were above solar metallicity, and only one (GL 324) is as metal-rich as Proxima. Looks like Proxima has provided yet another opportunity for a class project for this Fall.

Just about everyone wants Alpha Centauri to harbor habitable planets. The fact that Proxima is gravitationally bound to Alpha will help make this a reality.

Given what we know about planet formation, it’s extremely likely that there are terrestrial planets in orbit around both Alpha Centauri A and Alpha Centauri B. Simulations by Wiegert and Holman (1997) show that the habitable zones of both planets are likely dynamically stable. Elisa Quintana and her collaborators (2002) have carried out accretion calculations that indicate that terrestrial planet formation should proceed very easily around both stars (with 3-5 terrestrial planets expected for each). Because the metallicity of Alpha Centauri is higher than the Sun, the naive expectation is that these planets should contain of order two times as much mass as our own terrestrial planets.

At first glance, one expects that the Alpha Centauri planets will be very dry. The period of the AB binary pair is only 79 years. The orbital eccentricity, e=0.52, indicates that the stars come within 11.2 AU of each other at close approach. Only refractory materials such as silicates and metals would have been able to condense in the protoplanetary disks around Alpha Centauri A and B. To reach the water, you need to go out to the circumbinary disk that would have surrounded both stars. With only A and B present, there’s no clear mechanism for delivering water to the parched systems of terrestrial planets.

Enter Proxima. With its million-year orbit, it has gone around Alpha roughly 6500 times. The periodic perturbations induced by its close approaches will dislodge comets from the outer circumbinary regions, and send them sailing in to smack the terrestrial planets, delivering the much-needed water and mass-extinctions. Detailed simulations need to be done to look into this process (yet another Proxima-inspired class project).

I’m willing to bet a hundred dollars that the Alpha Centauri Ab and Bb exist, and that these planets are reasonably close (or inside) the habitable zones. How can we confirm the existence of these planets?

The spin axis of Alpha Centauri A is aligned with the angular momentum plane of the AB binary, which indicates that the planets will almost certainly orbit relatively close to the binary plane as well. The binary plane is inclined by 11 degrees with respect to our line of sight (79 degrees with respect to the plane of the sky) and so transits are a long-shot.

What about radial velocities? For sake of example, let’s assume that there’s a 2 Earth-mass planet in a habitable orbit around Alpha Centauri B. The habitable zone for B lies at 0.75 AU, which corresponds to an orbital period of 250 days. Assuming a circular orbit, and adopting and i=79 degree orbital inclination, the radial velocity half-amplitude is 10.6 centimeters per second.

In a series of posts in May, I looked in detail at the Swiss discovery of three Neptune-mass planets in orbit around HD 69830. These detections were based on 74 high-precision radial velocity measurements of a K0V star that is essentially identical in age and mass to Alpha Centauri B. HD 69830 “d”, the most distant planet in that system, induces a half amplitude of K=220 cm/s, with an error of 19 cm/s.

Given that HD 69830 d was detected with 74 measurements, Poisson statistics indicate that 484 times more observations will be required to detect our putative 2-Earth mass Alpha Centauri B “b” with a similar level of confidence. That means 35,816 RV data points, which means 35,816 individual spectra, which is a lot.

Surprisingly, however, such a program is not totally outside the realm of possibility. Because of its extreme proximity, Alpha Centauri B is a bit more than 100 times brighter in the sky than is HD 69830. This means that for a given signal-to-noise, a spectrum for Alpha Centauri B can be obtained 100 times faster than a spectrum of HD 69830. The crucial limiting factor to obtaining observations of Alpha Centauri B will be the readout time for the CCD. If I am interpreting the HARPS instrumental web pages correctly, this readout time for a high-resolution spectrum is 197 seconds (if someone is in the know on this, please post a comment). A reasonable observation cadence, then, seems to be about 210 seconds per observation, meaning that Alpha Cen B b can be detected on HARPS using 208 dedicated 10 hour nights.

Repo Man

Everything takes longer than you think it’s going to take.

I thought it would be a relatively straightforward task to collect and assemble all of the published radial velocity data sets together in a uniform format. Turns out (as is often the case) that I was overly optimistic. It’s been a major effort to get an authoritative radial velocity catalog into shape. Eugenio, however, has been extremely persistent and methodical, and the job is now essentially done. Datasets for 155 stars accompanied by published planets are now available on (1) the downloadable console, (2) the web-based console, and (3) on the systemic back-end. Many of these data sets are now available in ASCII format for the first time; Eugenio made extensive use of the Dexter applet to extract data from papers in which the radial velocities have been hitherto published only as plotted points.

As far as systems with published planets that are not on the console go, we’re definitely scraping the bottom of the barrel. This morning, Eugenio sent me an update on where he’s at with the last dregs. Basically, there are a dozen planet-bearing stars that still need to be added to the console. In most of these cases, we either can’t find any listing of data, or the data is available only in the form of a phased plot that can’t be disentangled:

0. HD114762: the two references I was able to find have (or appear to have) no uncertainties since the “planet” is likely a brown dwarf, I’ll still skip this one for now.

1. HD41004: hierarchical quad system: A(K star)-2.5 M_J/B(M star)-BD. Swiss give table of velocities for both A and B but no uncertainties.

2. Tau Bootes: This still looks like a hopeless cause.

3. GL86: phased velocities only.

4. HD11964: missing data?

5. HD122430: missing data?

6. HD196885: missing data?

7. HD34445: missing data?

8. HD59686: Only announced at American Astronomical Society Meeting; Still listed as Mitchell et al. 2004, ApJ, submitted.

9. HD73256: phased velocities only (do not confuse with HD 73526).

10. HD89307: missing data?

11. Tres-1: Phased velocities only.

Without a doubt, there are some easy as-yet unannounced and as-yet unpublished planets ripe for the picking off of the console menu. Two months ago, I wrote a series of posts showing that 51 Peg almost certainly has a second Saturn-mass planet in a habitable orbit. This planet was uncovered after only a few minutes of work on the console. This afternoon, Eugenio and I looked at four or five data-sets (basically at random) and found a nice planet candidate that we’re planning to write up in one of this week’s posts.

There are more than 6 billion people on Earth, and only a handful of them have discovered a planet. Here’s your chance.

Zoom

image formed by a converging lens

Remember the scene in Blade Runner in which Deckard successively zooms and enhances a digitized photograph found at a crime scene? In 1982, it seemed to epitomize the fashionably sleek high tech, and it left a strong impression on me.

In this post from last February, I wrote about the protostellar disks in Orion that were imaged by the Hubble Space Telescope in the mid-1990s. One of these disks has achieved nearly iconic status (at least among those of us who give talks on planet formation). The following image shows it viewed edge-on and in silhouette against a background of glowing nebular gas. Only a faint smudge of red hints at the central star embedded within the disk.

A protostellar disk in the Orion Star-Forming Region

This disk is roughly 17 times larger than the orbit of Neptune. It’s also considerably larger than the orbits of 2003 UB-313 and Sedna, which I’ve integrated and placed on top of the image for comparison.

sedna's orbit

The Hubble press release that accompanies the disk image highlights a number of different protostellar disks, or “proplyds”, many of which are being strongly photoevaporated by radiation from the nearby high-mass stars of the Trapezium cluster. This region is faintly visible to the naked eye as the unresolved middle “star” of Orion’s sword:

orion showing trapezium

A growing body of evidence suggests that our own solar system may well have formed in a similarly disruptive environment. Analysis of meteorites shows evidence that radioactive atoms with short half-lives (in particular, Aluminum 26) freshly ejected from a nearby supernova in the birth cluster may have been incorporated into our solar system’s protostellar disk. The scattered orbits of bodies such as Sedna also hint that the solar system may have had a close encounter with another star at an early time in its history. Close encounters only occur in a dense stellar environment.

On the Hubble press release page, there is a 22.97 MB Tif image of the entire Trapezium region. When the full image is displayed at laptop-screen resolution, it isn’t clear where the protostellar disks actually are. If, however, you slog through the full download and open the image in a program like Photoshop, then, like Deckard, you can zoom in with successively higher resolution to find the disks shown in the press release. The resolution in the 23 MB Tif image is not the full resolution provided by the actual mosaic of images, but it’s high enough to enable discovery of a lot of detail. A leisurely exploration of the image with pan and the zoom controls gives an amazing sense of the overall structure of the stellar nursery. The three-dimensionality of the cluster is easier to visualize. You can sense that the disk is suspended in empty space, in a slow, arcing free-fall through the cluster, making it somehow easier to grasp that this is an image of new worlds in the process of creation.

full view

zoom 1 view

zoom 2 view

Transit Fever

peppercorn on a blood orange

Literally every astronomical worker, amateur and professional alike, who has carried out a serious photometric search for planetary transits is familiar with the symptoms of at least one of the two common strains of transit fever.

In the egressia strain, one observes a photometric time-series in which a transit seems to be ending just as the observations are starting:

egressia

The ingressia strain has different symptoms, but is equally infectious. Near the end (or sometimes near the middle of an observing session, it appears from the time-series photometry that a planet is entering transit. In the most common form of the syndrome, the star generally either descends into the murk of high air-mass or is overtaken by dawn before the transit has finished:

ingressia

A third, somewhat rarer variety of the fever, known as rossiteria, has also been described. This strain is most commonly contracted by theorists; one finds radial velocities in the literature taken during a transit window which seem to show clear evidence of the Rossiter-McLaughlin effect:

rossiteria

I came down with my first serious case of transit fever (later diagnosed as egressia with complications due to rossiteria) nearly four years ago. The symptoms were brought on by HD 217107, the first candidate planet-bearing star observed by the transitsearch.org network. On the night of August 6th, 2002, photometric data was sent by both an observer in Pleasanton California, and from the KAIT automatic telescope at Lick Observatory. The fits to the radial velocity data indicated that the HD 217107 b transit window was scheduled to begin at 2:40 am PDT, and amazingly, both data sets showed a photometric dip right at the predicted time. To seemingly clinch the case, Debra Fisher also used the Lick 3-meter telescope to obtain five radial velocity measurements of HD217107 during and before the predicted transit ingress. When the spectra were analyzed, the velocities came back with a pattern consistent with the expected Rossiter-McLaughlin effect! [The data is available at this webpage]

To say that I was excited was an understatement. It was my first time out. I had no natural resistance. Tim Castellano, Debra, and I all came down with a full-blown case of transit fever. The period of HD 217107b is 7.127 days, which means that successive transits are spaced one week and 3 hours apart. Tim and I were on the verge of flying with a Meade LX-200 to Hawaii to observe the Aug. 13th transit from the parking lot of the Keck Observatory (That plan, fortunately, was canceled by a combination of high ticket prices and Joe Miller, the cooler-headed then-director of UCO/Lick).

By mid-September, observers in the Canary islands obtained a data set which clearly shows that HD 217107b does not transit. Huge disappointment. At that time, HD 209458 b was still the only known transiting extrasolar planet, and so the second detection would have been a very big deal.

With hindsight, having been innoculated against the transit fever, it’s clear that the transit interpretation was ambiguous in all three of our data sets. For example, in the case of the radial velocities from the Lick 3-meter, a new CCD detector for the spectrograph had just been installed, and so the overall zero point of the velocities relative to the predicted radial velocity curve was a free parameter. If the points are all moved down by 10-15 m/s, then the transit feature turns into ordinary scatter in the data. Likewise, with the photometric data, it was clear in retrospect that systematic effects were at work.

The transit detection problem is tough in part because it’s extraordinarily easy for systematic effects to seemingly conspire to produce an apparent signal. I would not feel confident in announcing a transit until I’ve seen multiple full-transit light curves. On the other hand, though, the false alarms play an important role. They get observers out on the sky, and spur the collection of enough data to truly rule out an event. This certainly wound up being the case for GJ 876, HD 168746, and a number of other candidates.

An early case of transit fever was contracted by U. J. J. LeVerrier, the Nineteenth-century French mathematician famous for the dynamical calculations that led to the prediction and subsequent discovery of Neptune. After the Neptune discovery, LeVerrier turned his attention to explaining the precession of Mercury’s perihelion, and found that the effect could be explained by the presence of a small intra-Mercurial planet that he named Vulcan. After a thorough literature search, LeVerrier unearthed five separate observations of the solar-disk transits by this planet, all at times consistent with predictions. In the following 1877 communication to the Monthly Notices of the Royal Astronomical Society, he’s basically saying, how could all those observations (which agree with theory, no less) possibly be wrong?

As everyone now knows, LeVerrier’s Vulcan doesn’t exist. The 43 extra seconds of Mercurian perihelion precession that had bothered LeVerrier so severely are explained by modifications to classical Newtonian gravity by Einstein’s general theory of relativity.

Radius anomalies?

Tristan Guillot and his colleagues have just published a paper, “A correlation between the heavy element content of transiting extrasolar planets and the metallicity of their parent stars” which explores an interesting new hypothesis for resolving the size problem for transiting hot Jupiters.

Readers of oklo.org are well aware that our theoretical understanding of the radii of hot Jupiters isn’t all it could be. For example, the transiting planets TrES-1 and HD 209458 b have very similar masses and surface temperatures, and yet HD 209458 b has a radius that is roughly 25% larger than TrES-1’s. In a previous post (see also this post), we outlined some of the hypotheses that might explain this discrepancy in radii.

Guillot et al’s idea is that the mass of a planetary core is a very steep function of stellar metallicity. That is, doubling the metallicity of the parent star leads to a 5-10 fold increase in the amount of mass contained in the cores of any short-period planets in orbit around the star. Larger core masses lead to smaller overall planetary radii at given mass, and so, in the Guillot et al. picture, planets orbiting metal-rich stars will, in general, be considerably smaller than planets of equal mass orbiting metal poor stars.

They present the following graph to support their hypothesis. It shows the difference in observed planetary size from the baseline theoretical expectation on the y-axis, and the parent star metallicity on the x-axis. They note (and the eye notes) that there is a trend in the diagram; planets orbiting metal-rich stars (as exemplified dramatically by HD 149026b) tend to be smaller than predicted, and planets orbiting stars of near-solar metallicity (e.g. HD 209458b tend to be larger than predicted.

Figure adapted from Guillot et al. 2006.

But is this correlation really present? To get a qualitative sense of whether it is or not, I took the planetary radius and parent star metallicity values for the 9 transiting planets in the Guillot et al plot and redrew them from their implied uncertainty distributions to make alternate, statistically equivalent versions of the plot in their paper. I also made control plots in which I assumed that there is no underlying radius-metallicity effect, only noise from measurement uncertainty. I made four plots of the first variety, and four plots of the second control variety. They are shown below. Can you identify which plots are the control plots?

cleanse, fold, and manipulate

Thanks to everyone who has created an account on the systemic backend, downloaded the console, and submitted fits to the HD 69830 data sets. It’s gratifying to see the collaborative effort coming together. We’re starting to get a better understanding of which aspects of the HD 69830 data set seem secure, and which aspects are uncertain.

That outer planet seems to me to be leaning toward the latter category.

For example, I just had a look at data set #17 for HD 69830. Guided first by the console’s periodogram and then by the console’s residuals periodogram, I worked up a two planet fit to the data. I kept the orbits of the resulting 8.66 and 31.7 day planets circular. In the absence of strong planet-planet gravitational interactions or resonant disk migration, I don’t see a clear rationale for assigning non-circular orbits unless the data really demands it.

The residuals periodogram of the 2-planet fit above has peaks near 200 and 400 days. The 200 day peak is a little higher, and indeed, corresponds to the outermost planet announced in the Nature paper published last week.

Use the folding window to look at the case for the 200 day planet. Try updating the period in tiny increments, and watch the data congeal into a relatively sinusoidal pattern. The third planet in the published fit is based on this configuration:

The 400 day data also looks good (although the power is not quite as high). Notice, too, that the phase coverage near 400 days is not as good. This is due both to the limited time baseline of the whole data set, as well as to the fact that the star can be observed only when it is not too near the Sun in the sky.

Apparently, the Las Vegas bookies are giving 3:1 odds in favor of the 200 day planet being correct. That said, however, the 400 day planet rounds out a very nice all-circular fit to the data.

20 centimeters per second

tubeworms

Source: Nicolle Rager Fuller NSF


HD 69830
. What a difference a year makes. Last June, HD 69830 languished in the obscure backwaters of the Henry Draper Catalog. Now, however, like its buddy HD 209458, the star is a star. Google “HD 69830”, and the search returns 660 entries (and growing daily). Google “HD 69831” and (until the crawlers manage to find this post) your search does not match any documents.

In Thursday’s post, we gave an overview of the HD 69830 planetary system, which contains Neptune-mass planets in 8.67, 31.6, and 197 day orbits. Perhaps the most astonishing thing about this discovery announcement is the tiny radial velocity amplitude of the 197 day planet in the model. This object induces a radial velocity amplitude of 2.2 meters per second, with a reported error of only twenty centimeters per second. That’s about the speed your finger moves if you trace it quickly across the title of the discovery paper. This detection required a very quiet star and an extraordinary technique. The Swiss seem to have broken through to the next level.

I wonder what that outer planet looks like. Over at transitsearch.org, I have a Fortran cron job that processes all of the known exoplanets every night to produce updated transit ephemeris tables. In order to predict transit depths, the code needs an estimate for the planetary radius, which in turn requires an estimate of the effective surface temperature. The transitsearch model reports 262 K, just below the freezing point (273 K), suggesting a brilliantly reflective orb swathed in white water-based clouds.

In an upcoming post, I’ll delve into some responsible (and also some irresponsible) speculations about the world beneath those clouds. A responsible viewpoint has planet “d” forming at a larger orbital radius than it currently occupies, and then migrating in to position. In this formation-followed-by-migration scenario, there were plenty of ices available during planetary assembly, and the planet will have a structure (and size) very close to those of Neptune.

internal structure of HD 69830 d

An irresponsible, more provocative scanario has planet d forming in-situ, out of refractory silicate and metallic materials. The final product in this case is a super Earth, smack in the sweet spot of the habitable zone, and endowed with ten Hubble times worth of geothermal activity. But more on that in the upcoming post.

A driving goal at oklo.org is to get our readers beneath the headlines and critically examining what the radial velocities themselves have to say. To do this, we need the data. The Lovis et al. discovery article in Nature contains a link to supplementary material, but when you click on the link you get a .pdf article about hydrothermal vent tubeworms:

huh?

Hmmm. Even if we adopt the most optimistic giant-Earth-like structural models for HD 69830 d, this supplementary material seems to be jumping the astrobiological gun. With tubeworms obscuring the radial velocities, we were compelled to resort to Dexter to extract as many velocities as we could from Figure 2 of the .pdf version of the paper. Eugenio managed to scrape 53 data points off the graph. We were busy using the console to work up fits to these dextered velocities when Darin Rogozzine at Caltech managed to guess the correct link and supplied oklo.org with the url.

In the next post, we’ll have a go at the rv’s. If you want an advance crack at them, they’re now on the web-based version of the console. We’ll get them on the downloadable version tomorrow.

XO-1

Image source: designonline.se

Today’s astro-ph mailing contains a paper by McCollough et al. detailing the discovery of a new transiting planet orbiting a sun-like star lying in Corona Borealis. Dubbed “XO-1” — easily the coolest name yet for an exoplanet– this world has a year that lasts 3.941534 days, and a mass roughly 90% that of Jupiter. The temperature at the scalding, toxic, vortex-riddled cloudtops should be a torrid 1083 K. It ain’t no habitable world, folks, but as the fifth extrasolar planet found to transit a relatively bright (V=11) parent star, it’s big news nonetheless. Bright parent stars are great for planetary characterization, because they make detailed follow-up a lot easier to carry out.

The preliminary indications are that this planet, which has a measured radius of 1.3 plus or minus 0.1 Jovian radii, is somewhat larger than expected. Our theoretical models predict that XO-1 should have a radius of 1.05 Rjup if there’s a 20-Earth mass core, and 1.11 Rjup if the planet is core-free. If the large radius is confirmed, then we’ll be faced with the same radius problem that we’re facing with HD 209458 b (as explained in this oklo post from Dec. 2005). An interesting clue may be provided by the fact that the XO-1 parent star, like HD 209458 is not particularly metal rich.

The paper lists four amateur observers as co-authors. Three of them, Tonny Vanmunster, Ron Bissinger, and Bruce Gary, are long-time transitsearch.org participants. P.J. Howell is the fourth amateur co-author on the list. As usual, the photometry that these guys are getting is excellent:

amateur lightcurves of XO-1

Figure adapted from the McCollough et al. paper.

The paper describes in detail how the photometry from the amateur observers was able to effectively leverage and speed up the discovery, and how the ready-made network provided by the small-telescope observers eliminated the need for an expensive robotic follow-up observatory.

Sounds to me like it’s time to crack open a bottle of Hennessey XO. Congratulations all around, guys!

Three Neptunes

The published census of extrasolar planets grew by 1.57% today, with the Geneva Extrasolar Planet Search Teams’s announcement in the journal Nature that trois Neptunes orbit the nearby sunlike star HD 69830.

There are a number of reasons why the Swiss team’s paper is interesting. The HD 69830 system seems tailor-made for a detailed dissection with the Systemic Console. This dissection can get the oklo user-base up and running with the new beta version of the Systemic Backend. In addition, the configuration of this system has some fascinating consequences for the theory of planetary formation and evolution. It is definitely worth digging into this story for the next few posts.

First, the nuts and bolts of the announcement. The three planets, named — you guessed it — HD 69830 “b”, “c” and “d”, clock in with Msin(i) estimates of 10.2, 11.8, and 18.1 Earth masses respectively. Assuming that the system is co-planar and is being viewed close to edge-on, this places b and c squarely in the mysterious planetary mass range that falls between the ice giants (e.g. Uranus and Neptune) and the familiar terrestrial planets. Planet d is somewhat more massive, with a net bulk almost exactly equal to that of Neptune. [It’s important to remember that the inclination of any given planetary systems is more likely to be viewed edge-on (i=90 deg) than pole-on (i=0 deg) for the same reason that the Earth has more real-estate within a hundred miles of the equator than within a hundred miles of the poles.]

Orbits of HD 69830 b, c and d

The published orbits of HD 69830’s planets are, however, distinctly unreminiscent of Uranus and Neptune. HD 69830 b orbits in 8.667 days, c orbits in 31.6 days, and d circles the star once every 197 days. All three have modest eccentricities.

For kicks, here’s a .wav format sound file which turns the reflex radial velocity waveform from the star into an audio signal. [Note: you can use the downloadable version of the Systemic Console to produce an audio representation of any planetary system, see this post from last week for the details.] In the sample file for HD 69830, I’ve pitched the innermost planet to a rather piercing 3 octaves above A 440. The period difference betwen the inner and outer planets leads to ~4.5 octaves of pitch difference. Planet d’s contribution can be heard as a bass drone about 2 octaves below middle C.

Indeed, the “chord” produced by these three new planets sounds terrible. Badly out of tune, to be precise. This immediately tells us that ther are no strong mean-motion resonances in the published configuration of planets. The human ear-brain system is good at on-the-fly calculation of whether the mean-motion resonance arguments are in circulation or libration. For example, this .wav file corresponds to a (synthetic) planetary system that is participating in several mean-motion resonances. When compared to HD 69830, it sounds awfully good.

As soon as I saw those periods — 8.667 days, 31 days, 197 days — I raced ahead through the paper draft to see if a photometric check for transits was carried out already by the discovery team… Excellent! There’s no mention anywhere in the paper of an attempt at a photometric search for transits of the planets. This will lend a challenging, high-profile opportunity to transitsearch.org. My guess is that the Geneva team was quite eager to get these three worlds out the door, and did not want to hold up the show with an exhaustive photometric check. There’s a real danger that you’ll wind up getting scooped if you cross all your photometric T’s before publishing your radial velocity-detected planets.

In the next post, we’ll look at what the radial velocities have to say.

Approach

Nevada Test Site 1957

Priscilla, Nevada Test Site, 1957 (US National Archives, see Michael Light’s 100 Suns)

Today was a bright spring day in California, and now, as I write, the night air coming through the window is drunken, redolent with the scent of a million flowers.

Spring is also arriving on HD 80606 b, but with devastating ferocity. This morning, HD 80606 b’s parent star, which resembles our Sun in intrinsic size and brightness, subtended more than two degrees as it rose above the horizon. It loomed, angry and white, with more than four times the angular size of a full moon. It grew perceptibly larger as the day wore on. Above the vortical scream of the cloud tops, it was scores of degrees warmer today than yesterday.

Last Friday, HD 80606 b fell through the imaginary boundary given by the size of Mercury’s orbit. Midsummer — HD 80606 b’s periastron passage — will occur on Friday of this week. At this moment, the planet will plunge to within 6 stellar radii, and the furnace of the stellar surface will stretch across 19 degrees of sky.

80606 position today

Five days later, on its way back out to apastron, the planet will perforate the plane containing the line of sight to the Earth. At this moment, there’s a possibility (a 1.7% possibility to be exact) that a transit can be observed.

a selection from the current transit table

Varkaus

Varkaus

Image source: NASA Visible Earth

For most people, a mention of Finland brings to mind snow, lakes, conifers, Nokia and Linus Torvalds. Here at oklo.org, however, we hear Finland and we think of top-drawer amateur astronomers. In 2000, the Finn Arto Oksanen was the first amateur to observe the HD 209458 b transit. More recently, both Oksanen and countryman Pertti Paakkonen have contributed a number of observations of TrES-1 and other stars to transitsearch.org. Finnish IP addresses are consistently among the top traffic generators on the Systemic Console.

Now, Veli-Pekka Hentunen and the Warkauden Kassiopeia ry (the Astronomical Association of Varkaus) join the ranks, with a fine observation of last week’s TrES-1 planetary transit. Their lightcurve, shown just below, was obtained with a Meade 12-inch LX200 telescope and a cooled SBIG ST8-XME CCD camera:

April 30, 2006 TrES-1 Transit Photometry

The photometry shows a tantalizing hint of the starspot activity that is known to characterize TrES-1. A more detailed analysis will be needed to see whether the small in-transit bump has statistical significance. As discussed in a previous post, HST has shown that starspot activity on TrES-1 can produce stange-looking features in the light curve:

transit of TrES-1 obtained with HST

Hentunen and his colleagues have constructed a very impressive facility at a dark (and from the look of things cold) site in the Finnish interior. Information in English regarding both their observatory and their scientific work can be found at the Taurus Hill Observatory Website.

varkaus observatory

Taurus Hill Observatory

Hentunen and friends will be able to kick back and take it easy for the next few months because it doesn’t really get dark at their location during the Summer. In the Winter, however, when the weather is clear, they’ll have the opportunity to make long-duration time-series photometric observations of stars near the polar cap. For example, they’ll be in awesome position to snag oklo.org favorite HD 80606 (+50 deg declination) during its Dec. 26, 2006 transit opportunity.

tilt shift

When it comes to planetary systems, our own eclectic gathering of eight (or nine, or ten) planets is by far and away the best characterized and best understood. We’ve flung space probes past all of the planets in the solar system, and we’ve directly, physically, probed four of them (in addition to two major satellites). We know their orbits to stunning, uncanny precision. We have actual pieces of Vesta and Mars under minute scrutiny in our laboratories. We have coffee table books overflowing with detailed photographs our our home worlds.

a detailed view of a surface feature on a life-bearing habitable planet

I can step right outside my door and photograph the surface details of a habitable terrestrial planet.

Sadly, we don’t have anything rembling this wealth of detail when it comes to extrasolar planets. Most of our information is encapsulated in the tables of radial velocity measurements accessible to the Systemic Console. Much of what I write about in these posts, and indeed, most of what we can infer about these distant worlds, must be squeezed from sparse columns of times, velocities, and velocity uncertainty estimates.

Continue reading

Dexter

glasses

Some of the planets that have been detected via the radial velocity technique have been announced in the refereed literature without the supporting evidence of a published table of radial velocities. For the planets that fall in this category, the end-user gets a star name, a list of orbital elements for the planet, and a graph showing a model velocity curve running through the data points. Occasionally, the data is folded, and only a .gif file of the phased radial velocity fit is published.

In a previous post, I wrote about why I can certainly appreciate the planet detection teams’ reasons for not wanting to divulge their radial velocity data when they announce a new planet. If a star has one detectable planet, then the odds are about 50-50 that another planet will be detected after several additional years of monitoring. For a variety of reasons, multiple-planet systems are scientifically more valuable than single-planet systems. In particular, a multiple-planet system (such as GJ 876) tells a fascinating dynamical story, which in turn yields valuable information about the formation and evolution of the planetary system. Obtaining radial velocities is hard, expensive work.

The unavailability of the radial velocity data sets for some of the planet-bearing stars has led to something of a gray market industry in which the radial velocity plots of the parent stars of interesting multiple-planet systems such as HD 82943 and HD 202206 are digitized, and the radial velocities are reconstructed from the graphs. For an example of this technique, see this preprint on astro-ph.

I bear some of the responsibility for the radial velocity .gif digitization industry. In 2001, a press release was sent out announcing the discovery of eleven new planets. This bumper crop included two particularly amazing systems, HD 80606, and HD 82943. HD 80606 harbors a massive planet on an extremely eccentric orbit, and I was very interested to fit the data myself in order to estimate the uncertainties in the transit windows.

The tabulated radial velocities on which the fits were based were not published, but postscript files showing plots of the radial velocities versus time were posted. I went into the files, and by placing commands to print characters in red, I was able to figure out how the plot was encoded. I was then able to extract the exact measured radial velocities for both HD 80606, and HD 82943 from the press conference postings. I didn’t try to publish the analysis that I did with this data, since the procedure seemed a little under-the-table. I did tell people what I was doing, however, and the radial velocity plots on the websites were soon changed from postscripts to .gif files, which are much harder to reverse-engineer.

One of our initial goals with the systemic collaboration is to provide the ability for anyone who is interested to perform a uniform analysis on all of the radial velocities underlying all of the published planets that make up the current galactic planetary census. In order to do this, we need a mechanism for accurately extracting the data from image files in .gif and .jpg format. Systemic team member Eugenio Rivera has been working on this, and has been getting good results with the Dexter Java Applet (available from ADS). The ADS information page gives the following overview:

Dexter is a tool to extract data from figures on scanned pages from our article service. In order to use it, you need a browser that can execute Java Applets and has that feature enabled. Netscape users can verify this by selecting “Edit” -> “Preferences” -> “Advanced” from the top-bar menu and making sure that the button “Enable Java” is checked.

Dexter can be quite useful in generating data points from published figures containing images, plots, graphs, and histograms, whenever the original datasets used by the authors to produce figures in the papers are not available electronically.

We’ll be posting velocity sets extracted from .gif files shortly, and Eugenio will post a detailed write-up of the technique and pitfalls of “observing” the observations.

Mötley Crüe

Mt. Hamilton at Dusk

Mt. Hamilton Main Building at dusk, photo by Laurie Hatch

Last weekend, I wrote a post about the planet — stellar metallicity connection, and the small-scale Doppler-velocity planet search that Debra Fischer and I carried out at Lick Observatory as a precursor to the currently ongoing N2K survey.

We had eighteen candidate stars on our list, ordered in terms of increasing uvby-determined metallicity, and to keep track of them, we named them after heavy metal bands:

table of heavy metal bands

We started observations in September 2000. Several times a month, I would drive up the twisting road to Mt. Hamilton, windows open to the dry chaparral air. At the mountaintop, the observatory buildings on the ridgeline sleep in the hot quiet afternoon sunlight. The scene seems lost in a slower, less hectic time. E-mail, phone messages, deadlines, all-hands division meetings are far away and inconsequential.

After standing and staring for a long time at the sweeping expanse of ridges, mountains and valleys spreading out in all directions, I would pick up a set of keys, a flashlight, a thermous of coffee, and a night lunch from the diner, and walk to the dome.

Once inside, the lost-in-time feeling immediately gives way to the scramble to set up for the night. Open the spectrograph, fill the ccd dewar, focus the optics, set up the iodine cell, obtain the thorium-argon calibration and flat-field images, check the telescope pointing, and run through a number of other ordered tasks, all of which are required for a successful night of observations. We were using the then-undersubscribed 1-meter Coude Auxilliary Telescope, which has a certain Rube-Goldberg aspect to its inner workings. It took all (and more) of my clumsy theorist’s mechanical aptitude to make sure that I didn’t skip a step of the complicated set-up procedure.

Eventually, with the sky grading into deep blue twilight and the night’s first target star acquired, the stress associated with the set-up procedure would dissipate. Because of the small size of the telescope, the individual exposures were long and unhurried. I’d take two and sometimes even three separate half-hour exposures. With the shutter open, with starlight streaming through the iodine cell, reflecting off the spectrograph, and landing on the CCD, there was little to do aside from making sure that the autoguider was doing it’s job of keeping the star centered on the spectrograph entrance slit.

After three months, several of the stars were showing tantalizing hints of short-term radial velocity variablility. All of our main-sequence target stars have “F-type” spectra, meaning that they were somewhat more massive (and thus hotter) than the Sun. It was impossible to get the 3-5 m/s precision that can be obtained with slightly cooler solar-type “G” stars. For F-type stars, the metal lines that greatly aid the measurement of precise Doppler shifts are starting to fade, and, because F-type stars are generally quite young, they are often rapidly rotating. Unless the star is being viewed pole-on (which seems to be bad for planet detectibility) stellar rotation broadens the spectral lines and further degrades the velocity precision.

Mötley Crüe, in particular, was exhibiting radial velocity variations that seemed to strongly imply the presence of a short-period planet. This was mildly surprising, given its rather puny, barely super-solar “80’s hair metal” metallicity of [Fe/H] ~ 0.04 dex. We became more and more excited, as each velocity seemed to come in on target:

Early Radial Velocitis for Motley Crue

I have to go and teach a class now, so I’ll pick up the story sometime during the next few days. Also, when I get back from class, I’ll add the velocities shown in the figure above to the Systemic Console under the name “Mötley Crüe”. If you’re interested, you can then do a quick analysis which will show you why Debra and I were getting excited by the velocities.

Roboscope

DSS2 Red Image of GL581

Last week, we posted Kent Richardson’s light-curve for the nearby red dwarf star GL 581 (Sloan DSS image pictured above). Kent’s photometry was taken during a predicted transit window, and along with data from David Blank and collaborators in Australia, it contributed to rule out the possibility of planetary transits by the red dwarf’s steamy Neptune-mass companion.

Like Marlon Brando in On the Waterfront, GL 581 b “could’ve been a contender”, and connoisseurs of the might-have-been should be sure to read the oklo posts [1,2] that talk about what this planet would have taught us if only it was transiting…

No need to despair, however. There’s a whole slew of candidates on the transitsearch.org candidates list which remain entirely unexplored.

Kent obtained his data with a robotic telescope located at the San Diego Astronomy Association’s dark site at Tierra Del Sol, California, approximately 60 miles east of downtown San Diego:

sdaa roboscope

Kent reports,

There are three major components of the installation: The dome and telescope, the data cabinet, and the satellite antenna. The details of each are as follows:

Dome
Robo Dome by Technical Inovations, Inc.
Meade 8″ LX-200 Classic f/10
Meade f3.3 Focal reducer
SBIG ST-7 CCD camera w/ CFW-8 filter wheel
Lumicon 80mm finder scope w/ Meade DSI Pro camera
Meade 8x50mm finder scope with Logitec web cam

Data cabinet
Compaq Presidio desktop computer
The Sky for telescope control
CCDSoft for ST-7 control
Meade Autostar Suite for DSI control
Logitec Image Studio for web cam control
Digital Dome Works for dome control
Tachyon Networks Inc. satellite network computer

Satellite Antenna
Tachyon Networks Inc. satellite dish

The photo shows the site. The data cabinet has been wrapped to protect it from the winter rains we have been experiencing. You can also see a second pier and electrical outlet which will enable us to install another dome and telescope when funding is available.

We’re definitely looking forward to seeing more data from this rig when the California weather finally improves.

In other news, Transitsearch.org and the American Association of Variable Star Observers have just announced a joint campaign to search for transits of the recently discovered planet orbiting HD 33283. There’s one last, fleeting window of opportunity this season before the star goes behind the Sun: April 26, 10:31 – April 27, 20:22 (UT). Details of the campaign can be found here.

Seize the moment!

Metal

aluminum foil on a flatbed scanner


51 Peg
is an ordinary star in nearly every respect. It is, however, more metal-rich than the Sun by nearly a factor of two, which gives it a metallicity in excess of all but a few percent of the stars in the local galactic neighborhood.

When Astronomers talk about metallicity, they mean the fraction of a star’s mass that is contained in elements that are heavier than hydrogen and helium. To an astronomer, carbon, nitrogen, krypton, and radon are all “metals”. In the Sun, metals comprise a bit less than 2% of the total mass.

Nearly every parent star in the first wave of extrasolar planets (including 55 Cnc, Tau Boo, and Ups And) came in with considerably higher-than-average metallicity, and the strong connection between high stellar metallicity and the detectable presence of an extrasolar planet was on fairly secure footing by 1997. This connection has been quantified very clearly, and is perhaps the most important and dramatic result that come out of the first decade of investigation of extrasolar planets. The figure from Debra Fischer and Jeff Valenti’s recent paper is fast on its way to iconic status:

the planet metallicity correlation

The planet-metallicity connection is telling us something important about the planet formation process, namely, that the core-accretion mechanism for forming giant planets is correct. (More on this coming up soon.) It also tells us how to efficiently find more planets. If you want to find planets, look at metal-rich stars.

Purists should definitely argue that by skimming the readily detectable planets from metal-rich stars, one is skewing the statistical properties of overall census of planets, while introducing additional systematic trends into a planetary catalog that is already shot through with biases both subtle and overt. “A targeted quick-look Doppler survey of metal-rich stars is the moral equivalent of eating candy for breakfast!”

I fully agree.

There are, however, scientifically compelling and unassailably selfless arguments for why it’s important to locate as many extrasolar planets as quickly as possible. I think the most important reason is that quick-look radial velocity surveys (such as N2K) are the best way to locate planets that transit bright parent stars. Once identified, objects like HD 149026b yield up a simply incredible amount of information.

But I’ll be straight with everyone. I’ve always wanted to be in on the discovery of new planets.

In 2000, I worked with Debra Fischer on a small-scale survey of metal-rich stars that wound up being the precursor project to N2K. It’s hard to imagine that the year 2000 once seemed like the distant future. At that time, it appeared that in addition to the planet-metallicity correlation, that there was also a planet-stellar mass correlation. The census of short-period planets known in 2000 was noticeably concentrated around stars somewhat more massive than the Sun, that is, early G and late F type stars.

I therefore drew up a list of 20 stars that we could observe using the then-undersubscribed CAT (Coude Auxilliary Telescope) on Mt. Hamilton. The criteria for inclusion were that a candidate star be (1) at least moderately metal-rich, (2) bright, (3) more massive than the Sun, and (4) not known to be on any other radial velocity survey lists. We needed stars brighter than about magnitude 6 because the CAT telescope has a mirror diameter of only one meter.

Rapidly, it became clear that Henry Draper catalog numbers are not a very effective way to mentally keep track of the stars. There was confusion, for example, one night when I asked Debra if I could add “HD Twenty –Six Seven Five” to the evening’s observing list. She thought that I meant “HD 2675 “(which had already set), when I actually had “HD 20675” in mind. We eventually realized that since we needed to keep both the stars and their metallicities straight, the best course of action would be to name the stars after heavy metal bands. At the high-metallicity end, we drew on speed-metal and death-metal outfits (e.g. Slayer, Sepultura), wheras at the lower-metallicity end, we resorted to hair-metal and even glam-metal bands (i.e. Warrant, Skid Row). Here’s our final list of stars in the survey:

table of heavy metal bands

(The original twenty star survey was reduced to eighteen after AC-DC turned out to be a spectroscopic binary, and W.A.S.P. turned out to be chromospherically active.)

rates

In astronomically inclined households, the first wave of extrasolar planets to be discovered, 51 Peg, 70 Vir, Ups And, Tau Boo, are all still household names.

cactus pad

With the later additions to the census, however, such as HD 33283 b et al., even the discoverers can have a hard time keeping the names in mind. In part, this is because it’s tough to keep a bunch of random Henry Draper Catalog numbers at the tip of the tongue. It’s also because planets #184, #185, and #186 don’t quite pack the same panache as planets #2, #3, and #4. Maybe it’s time to start naming these planets?

It’s easy to get the impression that the rate of discovery of extrasolar planets is increasing rapidly with time. Interestingly, however, this hasn’t been the case recently. The planet discovery rate peaked in 2002, with 34 planets detected, and the rate over the last four years has been flat, at about 25 planets per year. (The present year has brought us six new worlds during the span between New Years Day and Earth Day):

rate of planet detection

The detection rate has flattened for several reasons. After a decade’s worth of planet discoveries, the Doppler radial velocity method remains the most productive technique. The radial velocity method is most efficient when one has a bright parent star. Most of the suitable stars with V magnitudes brighter than 8 are already on the Doppler Surveys. The readily detectable short-period planets orbiting these stars have mostly been found. The much longer orbital periods of the outer planets mean that one must be increasingly patient as one waits for new discoveries from venerable stars. Indeed, the detection rate of planets over the past several years would be even lower, were it not for targeted Doppler surveys such as N2K, which are specifically designed to find new planets quickly by surveying metal-rich stars.

The transit and microlensing methods have a lot of promise for upping the planet detection rate, but to date, very few planets have been discovered with these techniques. In an upcoming post, we’ll look in more detail at the reasons why this has been the case.

It’s interesting to compare the planet detection rate with the history of minor planet detections. Ceres, the first minor planet to be discovered, was found in 1801, followed by Pallas in 1802, Juno in 1804, and Vesta in 1807. A thirty-eight year gap followed, until the discovery of Astraea in 1845. The 100th asteroid, Hecate, was found in Ann Arbor Michigan in 1868, and asteroid #188 (equal to the number of extrasolar planets currently known) Minippe was found ten years later in 1878. The rate has increased rapidly since then. As of last November, there were 120,437 numbered asteroids:

discovery rate for asteroids

I think it will take about 15 more years to find 120,437 planets.

2010

correlations?

As I’ve mentioned earlier, Jean Schneider’s authoritative Extrasolar Planets Encyclopedia has introduced a slick .php-based approach that’s keeping the systemic team on their toes. At Schneider’s site, one can interactively produce correlation diagrams for the known extrasolar planets. As more planets are discovered, these diagrams (for example the a-e plot and the Msin(i)-a plot) are beginning to show a fascinating richness of detail.

The inclusion of date of discovery as one of the plottable parameters attracted my attention.

For example, a plot of the Log of the planetary period versus discovery date shows hints of interesting structure:

planetary period vs. discovery date

Over the past few years, the majority of newly detected planets can be divided into a population with P<10 days (the hot Jupiters), and a population with P>200 days (the eccentric giants). There is a statistically significant gap in the period distribution in the intermediate-period regime. This gap tells us something significant about the planet formation process. My interpretation is that the migration process is not readily halted until a planet reaches the region of the disk where the dyanamics of the protostellar disk gas are subject to the laws of ideal MHD. More on that later.

From a more practical standpoint, the paucity of intermediate period planets has made it tough going for the transitsearch.org collaboration. When planetary periods are less than about 10 days, the discovery team is usually able to complete a photometric search for transits before the planet is publicly announced. When a planetary period exceeds 200 days, it’s generally hopeless to mount an exhaustive transit search, even with a distributed network.

You’ll get another very interesting diagram if you plot the Log of the planetary mass as a function of discovery date. As usual, I’ve redone the axes and annotations with Adobe Illustrator to get that familiar oklo.org look-n-feel:

planetary mass vs. discovery date

In this log-linear space, the lower envelope of detected planet mass is a linear function of time. This allows for an easy extrapolation to estimate the discovery date of the first Earth-mass planet orbiting a nearby main-sequence star…

Three new planets

Yesterday, John Johnson and the California-Carnegie Planet Search Team posted an astro-ph preprint announcing the discovery of three new extrasolar planets. All three radial velocity data sets have been added to the Systemic Console, and the transit predictions have been placed on the transitsearch.org candidates list.

HD 86081 b has an orbital period of 2.1375 days, which makes it a long-sought “missing link” between the weird, ultra-short period planets discovered by the OGLE survey and familiar hot Jupiters such as HD 209458 b and 51 Peg. HD 86081 b has been checked photometrically for transits, but unfortunately, they don’t occur. Because HD 86081 b orbits so close to its parent star, the a-priori transit probability was a healthy 17%.

HD 224693 b and HD 33283 b have longer periods of 26.73d and 18.179d, respectively. The parent stars are excellent targets for the transitsearch.org project, as neither one has been monitored photometrically during the centers of the transit windows. The a-priori transit probability for HD 33283 b is an impressive 6.2%, whereas HD 224693 tosses in a 3.2% chance. That’s a 9.4% chance that a small-telescope observer will be a world-famous astronomical hero sometime during the next year…

Dust off those CCD cameras!

GL 581. Flat, unfortunately.

wheat

Regular visitors to oklo.org are familiar with GL 581 b, a Neptune-mass planet in a 5.366 day orbit around a nearby M-dwarf star. I’ve developed a fascination with this planet, because if it can be observed in transit across the disk of its parent star, then we will learn an incredible amount about the planet’s interior structure. In a nutshell, if the planet has a small transit depth then we’ll know it’s made of rock and metal, and if it has a larger transit depth, then we’ll know it’s made mostly of water.

The a-priori geometric probability that transits by GL 581 b occur is 3.6%. Because the planetary orbit is fairly well known, the time windows during which transits can occur are fairly narrow. The expected transit depth for the planet (if it’s made of water) is a respectable 1.6%, which means that observers with small telescopes will be able to detect the transits if they are occurring.

For more details on the GL 581 campaign, please read (1) this oklo post, “clouds”, and then (2) this oklo post, “two for the show”. For information on how amateur astronomers and small-telescope observers can participate in the search for transiting extrasolar planets, see our website for transitsearch.org. Over the coming months, we’ll be integrating transitsearch.org much more tightly into the oklo site. The systemic project and the transitsearch project both have a common goal of facilitating meaningful public participation in cutting-edge extrasolar planet research.

Every 5.366 days, I’ve been peppering the transitsearch.org observers mailing list with exhortations to observe GL 581 during the transit windows. The weather has not been very cooperative, and many opportunities worldwide were thwarted by clouds, but we now have two data sets that indicate that transits by GL 581 b are unlikely to be occurring:

gl581 photometry

The top data set (from April 2nd) was obtained by David Blank and Graeme White (of James Cook University) using a robotic Celestron C14 stationed at the Perth Observatory. The observations were made through an uncalibrated R filter. The operation of the telescope is made possible by the Perth Observatory staff Jamie Biggs and Arie Verveer, with Carl Pennypacker participating remotely from UC Berkeley. The bottom data set, from April 12th, was obtained by Kent Richardson, using the transitsearch.org robotic telescope, which was set up by Tim Castellano, and which is located in San Diego.

Sadly, neither data set shows any hint of a transit. In addition, David Blank has another data set in hand from March 28th, which also shows no sign of transit. I’ll update the post shortly to include that set as well. Several more observations will be required to really scratch GL 581 b off the list, but at this point it doesn’t look good for transits.

So yeah, I’m a little bummed out. But look at the bright side. A worldwide network of small-telescope observers has obtained an important astronomical result, demonstrating the feasibility of the transitsearch.org approach. If we keep observing the candidates, eventually we’ll hit pay dirt.

Some evidence for the existence of 51 Peg c

This post continues with a thread that we’ve been developing over the past several days (posts 1, 2, and 3). In brief, we’ve found interesting evidence of a second planetary companion to 51 Peg in the published radial velocity data sets.

a single spike in a periodogram

We first used the Systemic Console to recover 51 Peg’s famous (P=4.231 d) companion from the data, and then looked at the power spectrum of the residuals to the single planet fit:

residuals

There is a startlingly large periodicity in the data at a 356.2 day period.

We then used the console to identify this periodicity with an Msin(i)= 0.32 Jupiter-mass planet in an e=0.36, P=357 day orbit.

There’s no question that the addition of this second planet reduces the scatter in the data relative to the model. The question is: can the model be taken seriously? Is 51 Peg “c” really there?

Continue reading

51 Peg c

In the posts for Thursday and Friday, we used the Systemic Console to explore the radial velocity variations of 51 Peg. Aside from harboring the first extrasolar planet discovered in orbit around a Sun-like star, this data set is extraordinary because it contains nearly 270 individual radial velocity measurements taken over a period of over ten years. Very few stars have published data sets that are so extensive.

Get on board!

After extracting the signal of the celebrated 4.231 day planet from the data, we computed a periodogram of the residuals. The calculation shows a strong concentration of power at a 356 day periodicity:

residuals periodogram for 51 Peg

At the end of yesterday’s post, we were left hanging on the suggestion that this strong peak might represent a second planet in the 51 Peg system. Let’s have a look at this hypothesis by making a two planet fit to the data.

If you’ve gone through the systemic tutorials, and are comfortable at the controls of the console, here’s the procedure:

Launch the console and follow the directions given yesterday to obtain the best single-planet fit to the data. Next, activate a second planet, and enter 356. into the data window of the period slider for the second planet. Then, minimize the new planet’s mean anomaly, followed by a minimization on the mass. Next, send all ten orbital parameters for the two planets, along with the velocity offsets off for a polish by the Levenberg-Marquardt algorithm. Note that it’s fine to push the “polish” button several times in succession, to ensure that the algorithm has been given enough iterations to converge to the best fit in the vicinity of your choice of starting conditions.

The console shows that the addition of a second planet improves the fit to the data, dropping the chi-square to 1.7, and reducing the required jitter to 5.4 m/s.

The second planet, which we’ll call 51 Peg “c” (where c stands for “console”, huh, huh) has a period of 356.8 days, a minimum mass of 0.32 jovian masses (slightly larger than Saturn), and an orbital eccentricity, e=0.36. Here’s a link to a screenshot of the console showing all the parameters. This is also an advance look at the next version of the console which Aaron will be releasing in a few weeks.

Using the console’s zooming and scrolling sliders, we can see the modulation of the radial velocity curve. The second planet imparts a visibly non-sinusoidal envelope on the strong carrier signal created by 51 Peg b. The non-sinusoidal shape stems from the significant eccentricity of planet “c”:

radial velocities response from 2 planets

Note that we still have to teach the console to draw smooth curves when the zoom level is high! Look for that improvement to show up in about 2 months or so. There’s a lot of other items ahead of it on the to-do list.

The orbits of the two planets look like this:

51 peg b and c

Does it really exist, this room-temperature Saturn? Is it really out there? Do furious anticyclonic storms spin through its cloud bands? Does it have rings? Does it loom as an enormous white crescent in the deep blue twilight sky of a habitable moon?

Maybe.

Eugenio and I have been working through the weekend to devise statistical tests which can assess the likelihood that this planet exists. We’ll check in shortly with our results

51 Pegged?

Yesterday, we supplied the Systemic Console with the published radial velocity datasets of the the planetary system that started it all, the original gangsta, 51 Peg.

It’s interesting, after more than a decade of observation, to see what happens as a radial velocity time series acquires a long baseline. Launch the Systemic Console, and select 51 Peg from the system menu. You’ll see a plot that looks like this:

radial velocity data sets for 51 Peg

With the “51peg_1.vels” offset slider, it’s easy to separate the two contributing data sets. (One was published by the California-Carnegie Planet Search Team, the other by the Geneva Extrasolar Planet Survey). The Swiss data set gives a long baseline of coverage, whereas the California-Carnegie dataset contains intensive observations taken mostly over the course of a single observing season in 1996. Click on the periodogram, and be patient while the console works through the Lomb-Scargle algorithm. While you’re waiting, you can look eagerly forward to the fact that in Aaron Wolf’s next release of the console (due in a few weeks) the periodogram calculation will be sped up by more than a factor of ten.

power spectrum for 51 Peg

The periodogram has an impressive tower of power at 4.231 days. This dataset contains a whopping-strong sinusoidal signal:

To work up 51 Peg “b”, activate the first row of planetary orbital element sliders and type 4.231 into the period box. Then (1) line-minimize the mean anomaly, (2) line-minimize the mass, (3,4) line-minimize both offset sliders, and (5) line-minimize the period. (6) Activate a small eccentricity, (7) move the longitude of periastron slider off the zero point, and then (8) click the Levenberg-Marquardt boxes to the left of each entry box and polish the fit. (If this sounds like gibberish, yet also exciting, we’ve written three tutorials [here, here, and here] that go into detail regarding the use of the console. In addition, all posts marked “systemic faq” contain information about how to use and work with the console.)

When I do this, the console gives me a single planet fit with P=4.2308 days, M=0.4749 Jupiter Masses, and eccentricity e=0.014. These values are in full agreement with the orbital parameters published in the original discovery paper.

Alert readers are likely grumbling that we’ve made no mention of uncertainties in the orbital elements. This is an extremely important and interesting issue for many systems, and we’ll definitely be posting extensively on the topic and theory of computation of errors in orbital elements of extrasolar planets. The entire Systemic research collaboration, in fact, is primarily concerned with resolving the issue of how to establish confidence levels in various types of planetary system configurations.

In the meantime, however, use the console to compute a periodogram of the velocity residuals to the old-school 1-planet fit. A strong peak stands out at a period of 356.196 days. The chi-square statistic of the 1-planet fit is just over 2.00, and the required stellar jitter is about 7 meters per second. This is significantly higher than the 3-5 meters per second of long-term jitter that is expected for a quiet, old G2 IV star like 51 Peg:

residuals periodogram for 51 Peg

Could there be another planet in the system? Could it be, that the console, by virtue of the fact that it readily combines data sets from different published sources, has found a new world (in a habitable orbit no less)? Tune in tomorrow to find out…

O.G.

Most of the recent scientific papers on the general topic of extrasolar planets start with a sentence very much like this one:

Following the announcement of the planet orbiting 51 Peg (Mayor & Queloz 1995), over 170 planets have been discovered in orbit around solar type stars.

straw

And indeed, Mayor and Queloz’s discovery of the hot Jupiter orbiting 51 Peg was truly a watershed event. Their Nature paper has racked up 764 ADS citations. Of order several billion dollars have been spent (or will shortly be spent) on the worldwide effort to locate and characterize alien solar systems. It’s thus a little weird that the Systemic Console has so far failed to include 51 Peg in its system menu. We’ve just corrected this oversight by adding the two published data sets for 51 Peg.

console selection menu

The closely spaced data near the beginning of the time series is from Marcy et al. (1997), who began intensively monitoring the planet from Lick Observatory as soon as the discovery was announced. The widely spaced data is from the Swiss planet hunting team (Naef et al. 2004), and contains 153 radial velocities obtained over a ~10-year period. The data is catalogued at CDS, and available at this link.

The 51 Peg data sets are interesting for a number of reasons. I’ll check in tomorrow with more details as to why. In the meantime, fire up the console and start finding fits.

Photometric Imaging

Yesterday’s post talked about how Young, Binzel and Crane (2001) used high-cadence photometric observations of Charon transiting the disk of Pluto to construct a two-color image of Pluto’s surface. Transiting extrasolar planets can be employed in a similar way to create an image of the strip of stellar surface that lies beneath the path of an occulting planetary disk. Resolution-wise, this procedure is the effective equivalent of a satellite in low-Earth orbit making a detailed image of a stripe across a sand grain sitting on the Earth’s surface.

poppies transiting a vase

In 2001, Tim Brown and his collaborators used the STIS spectrograph on Hubble Space Telescope to obtain what has become an iconic composite light curve of the HD 209458 b transit. It’s probably fair to say that the majority of talks given by astronomers on the general topic of extrasolar planets have a powerpoint slide that shows the Brown et al. data. (The astro-ph version of their article is here).

Here’s a figure (done in Adobe Illustrator, like all of the other www.oklo.org diagrams) that shows their data:

transit of HD 209458b obtained with HST

The Brown et al. light curve contains 684 time samples spaced at an average cadence of 80 seconds with a relative precision of one part in 10,000 per photometric data point. (This photometric accuracy is easily good enough to detect the transit of an Earth-sized planet across the face of a Solar-size star if one knew when and where to look.) Because HST can only observe for about half of its 96.5 minute orbit, and because the transit lasts 184.25 minutes, the light curve was obtained by stitching together photometry from groups of observations obtained on four separate transits that took place between April 25 and May 13, 2000.

An interesting feature of the above diagram is that the transit light curve does not have a flat bottom. This results from brightness variations on the surface of the star itself. Stellar disks display a phenomenon known as limb darkening. If you can resolve a star (as one effectively does when one obtains a photometric light curve of a transit) you see that the center of the stellar disk is brighter than the edges. This effect occurs because when one looks at the stellar limb, the line of sight samples higher, cooler layers of the stellar atmosphere. When one looks straight at the middle of the star, one is seeing further in, to deeper, hotter layers. For a star like the Sun or HD 209458, this effect is quite significant. The intensity at the limb is only about 40% as much as that at the center of the stellar disk. The curved bottom of the time-series, then, could be inverted and processed to construct an image of the surface of the star beneath the planet. Additionally, if the transit is observed through different color filters, then one can build a colored image of the stellar strip.

More recently, Brown and Company have made similar HST observations of the TrES-1 transit. Their light curve in this case shows a bizarre uptick, which causes the transit to resemble a one-toothed grin:

transit of TrES-1 obtained with HST

The interpretation of this feature is that the planet covered up a starspot as it traversed the face of the star. Starspots — that is, sunspots on other stars — are cooler, and hence dimmer than their surroundings. When a starspot is occulted by the planet, the fraction of blocked starlight decreases. Photometric light curves really do give us an image of a strip of the stellar surface.

For those who prefer not to shave with Ockham’s razor, there’s a second, rather more exotic interpretation of the TrES-1 transit light curve. It’s possible (although highly unlikely!) that a second, longer-period, planet was also transiting TrES-1 at the time when the uptick in the light curve was recorded, and that the inner (known) planet happened to pass underneath the outer planet, as seen from Earth. According to Tim Brown (during a talk I heard him give in Japan) this model, while crazy, does just as good a job of fitting the photometric data!

TrES-1 is an 11.8 magnitude star, and the transits are thus highly suitable for measurement by amateur astronomers using the technique of differential aperture photometry. On the transitsearch.org website, there’s an extensive discussion of amateur observations that were made in the months following the discovery of the transit by Alonso et al. Many of these amateur light curves show strange asymmetric features. It’s likely that they were also observing the planet crossing over starspots. If this was indeed the case, then the 2-planet interpretation of the “tooth” can be safely ruled out.

I should emphasize that transit observations using HST are of blockbuster-level scientific value. The exquisite HST photometry allows a very accurate measurement of the planetary radius, which in turn puts strong constraints on our theoretical models of the planetary interior (see this post for more information). The transit also strongly constrains the elements of the planetary orbit, and the color-dependence of the light curves permits the measurement of atmospheric constituents such as sodium and carbon monoxide.

The above diagram for the TrES-1 transits is adapted from a review article entitled, When Extrasolar Planets Transit their Parent Stars that I co-authored with Dave Charbonneau (Harvard University), Tim Brown (The High Altitude Observatory), and Adam Burrows (The University of Arizona). It will be published in the forthcoming Protostars and Planets V Conference Proceedings.

Here at www.oklo.org we strive to keep things on the positive tip, but I do have one disappointing piece of news to report. I was a Co-I on Tim Brown’s recent HST Cycle 15 proposal to obtain a high-precision photometric time series of the HD 149026 b transit. The resulting light curve would have had higher photometric precision than both the TrES-1 and HD 209458 b time series shown above. The light curve would have had a higher cadence, the individual points would have been good to about one part in 20,000. (At magnitude 8.16, HD 149026 is about thirty times brighter than TrES-1, and the new ACS camera on HSTT is better-suited to the photometric transit-measurements that the defunct STIS spectrograph that was used by Brown et al. for HD 209458). Unfortunately, we learned yesterday that the proposal was not accepted. This is a bummer. An HST transit light curve would have dramatically improved our characterization of the planet that has already provided the first incontrovertible evidence for the core-accretion mechanism of giant planet formation. I think that the HD 149026 light curve would likely have been as informative as the Brown et al. HD 209458 light curve, which was recently shown as #4 in the list of Hubble’s top ten scientific achievements.

two for the show

As I’m writing this, it’s about 22:08 UT, April 2, 2006. (JD 2453828.4226). The midpoint of the most recent predicted transit window for GL 581 b occurred a few hours ago, at 15:46 UT. That was in broad daylight in both the United States and Europe, but it was in the middle of the night in Australia and Japan. Hopefully, the Australian and Japanese participants in Transitsearch.org had clear weather at their observing sites.

what exactly is it?

As dicussed in previous posts, GL 581 “b” has a minimum mass of 17.8 times the Earth’s Mass (very close to the mass of Neptune), and orbits with a 5.366 day period around a nearby red-dwarf star. The a-priori geometric probability that GL 581 b can be observed in transit is 3.6%. Because the orbit of the planet has been well-characterized with the radial velocity technique, we can make good predictions of the times that transits will occur if the plane of the planet’s orbit is in close enough alignment with the line of sight to the Earth. The star can then be monitored photometrically during the transit windows to look for a telltale dimming lasting a bit more than an hour as the planet crosses the face of the star.

If GL 581 b is found to transit, then we will have a scientific bonanza on our hands. The size of the planet, and hence its transit depth, is highly dependant on the planet’s overall composition. If it is an “ice giant”, with a similar overall composition and structure to Neptune, then it should have a radius about 3.8 times larger than Earth, and it should block out about 1.7% of the star’s light at the midpoint of a central transit. If, however, the planet is a giant version of the Earth, with an iron core and a silicate mantle, then it will be considerably smaller and denser, with a radius only ~2.2 times that of the Earth. If the planet is a super-Earth, then the transit depth will be much smaller, and only about 0.6% of the star’s light will be blocked. A 0.6% transit depth is tough to detect, but it’s nevertheless possible for skilled amateur observers to reach this precision.

Here are some cutaway diagrams showing the internal structure and relative sizes of Jupiter, and of GL 581 b in each of the two possible configurations:

Core comparisons

Why would it be a big deal if we could determine the internal structure of GL 581 b? If the planet is a Super-Earth (that is, if the transit depth is small), then we would know that it accreted more or less in situ, using water-poor grains of rock and metal. The existence of such a structure would strongly suggest that habitable, Earth-like planets are very common in orbit around the lowest-mass M dwarf stars. That is, it would verify that high surface densities are a ubiquitous feature of the innermost disks of low-mass stars. On the other hand, if the planet turns out to be similar in size and composition to Neptune, then we will know that it is made mostly of water-rich material, and that it had to have accreted at a larger radius, beyond the so-called snowline of GL 581’s protoplanetary disk.

hd 20782 oct 20, 2006 (3.6%)

As advertised in yesterday’s post, three newly published radial velocity data sets have just been added to the system menu of the Systemic Console, and to the www.transitsearch.org candidates list. The data set for HD20782, published by Jones et al. of the Anglo-Australian Planet Search, is definitely the most interesting of the trio. Let’s work the HD 20782 velocities over with the console, and see what they have to say.

sunset

First, fire up the console. (If you use Firefox on Windows, and you’ve had success getting the console to work with that particular line-up, please post a response in answer to Vincent’s comment on yesterday’s post. All of Aaron’s oklo.org Java development has been done on Mac OSX using Safari. Also, we’ve had many reports that the console works well with Internet Explorer on Windows, so if Firefox won’t run the Java, give IE a try. And could someone ask Mr. Bill G. to send me a check for that plug?)

At any rate, the HD 20782 radial velocity data set has one data point that sticks down like a sore thumb:

velocities

Activation of one planet and a little bit of fooling around with circular orbits shows that even when the discrepant point is ignored, the waveform of the planet is not at all sinusoidal. The points contain an almost sawtooth-like progression:

circular orbit fit

Because of the non-sinusoidal nature of the velocities, the periodogram (obtained by clicking the periodogram button) is rather uninformative. There’s a lot of power in a lot of different peaks, and it’s not immediately clear what is going on planet-wise:

periodogram

Aaron has been working very hard on console development, and we will soon release an updated version with a number of absolutely bling features. Ever wondered what your fits sound like? One new feature is a “folding window”, which allows the data to be phased at whatever period one likes. The folding window is very useful for data-sets of the type produced by HD 20782. It quickly reveals that something like a 600 day periodicity brings out the overall shape of the planetary waveform:

folding window

Using 600 days as the basis for a 1-planet fit, activating eccentricity, and using a combination of slider work, 1-d minimization, and Levenberg-Marquardt, eventually produces excellent fits to the data that look like this:

fit to hd20872

Jones et al., for example, in their discovery paper, report an orbital period of P=585.86 days, an eccentricity, e=0.92, a mass (times the sine of the unknown orbital inclination) of Msin(i)=1.8 Jupiter masses, and a longitude of periastron of 147 degrees.

This planet is one bizzare world, and seems to be very similar to HD 80606 b (another oklo.org favorite). The orbital period is 1.6 years. The planet spends most of it’s time out at ~2.6 AU. In our solar system, this distance is out beyond Mars in the inner asteroid belt. Once per orbit, however, HD 20782 b comes swinging in for a steamy encounter with the star. The periastron distance is a scant 0.11 AU, roughly half Mercury’s distance from the Sun. The planet is likely swathed in turbulent white water clouds. Raindrops vaporize as the star looms larger and larger in the sky.

Stars that loom large in alien skies are good news for transitsearch.org, and in the case of HD 20782 b, we here on earth are particularly fortunate. HD 20782 b’s line of apsides lies within about 60 degrees of alignment with the line of sight to the Earth. This raises the a-priori geometric probability of having a transit observable from Earth to a relatively high 3.6%. (The a-priori probability of transit for a planet with a 1.6-year period and a circular orbit is only ~0.3%).

oribital figure

A Case for Habitable Planets Orbiting Red Dwarfs

“The past year has given to us the new [minor] planet Astraea; it has done more – it has given us the probable prospect of another. We see it as Columbus saw America from the far shores of Spain. Its movements have been felt, trembling along the far-reaching line of our analysis with a certainty hardly inferior to ocular demonstration.”

— Sir John Herschel addressing the British Association of the Advancement of Science on Sept. 15, 1846, two weeks prior to the discovery of Neptune.

Yesterday, Ryan Montgomery gave his presentation at the AbSciCon meeting in Washington DC, and laid forth our provocative hypothesis. We think that Earth-mass planets are common in the habitable zones of the lowest-mass red dwarf stars, and we think that these planets can potentially be detected by targeted photometric searches of the nearest known low-mass stars. The closest stars on this list are accessible to transitsearch.org observers, and we are advocating that the search begin immediately.
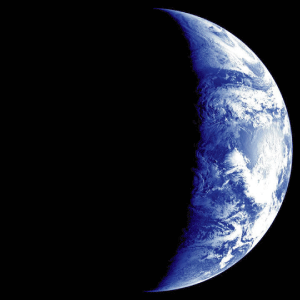
Earth from Space

Our calculations use John Chambers’ Mercury integrator to follow the last evolutionary stages of a planetesimal swarm in the protoplanetary disk of a young low-mass red dwarf star. The underlying physical picture in the simulations is that the star and disk are of order one million years old. The initial stages of planet formation are assumed to already have been completed. Grains of solid material have stuck together to build larger and larger objects in the disk. Most of the gas that was originally in the disk has either accreted onto the star, or has been photoevaporated by high-energy photons from the star itself and the neighboring stars in the birth aggregate.

We’ve completed three sets of calculations, and our computers are currently working on a large number of additional runs. In the first set (containing sixty individual simulations) we assume that two Neptune-like giant planet cores have already managed to form beyond the protostellar ice line, where the temperature is lower than 150K, and where planets can grow more quickly because of the availability of ices. We also assume that the innermost Neptune-mass core has been able to migrate a small ways inward to a distance of ~0.2 AU from the central star. This situation was chosen so as to be in analogy with the known Neptune-mass planets orbiting the red dwarfs GL 436 and GL 581 (see yesterday’s post). In a second set of sixty simulations, we didn’t include the giant planet cores. In our simulations, the Neptune-mass cores assume a role similar to that which Jupiter and Saturn are believed to have had during the formation phases of the terrestrial planets in our own solar system.

In each of the 120 simulations that comprise the first two sets, we distribute 1000 planetesimals in initially circular orbits in the region between 0.04 AU and 0.12 AU surrounding the eventual stellar habitable zone for the 0.12 solar mass star. Each planetesimal contains 0.003 Earth masses (about a quarter of a lunar mass). The swarm of planetesimals is then allowed to evolve under its own self-gravity, the gravity of the star, and the gravity of the ice-giant cores (if they are present). Planetesimals that collide with each other are assumed to conserve total angular momentum in the collision, while merging into a larger composite body. Some planetesimals collide with the ice giants or with the star, or are thrown out of the system. In a typical simulation (shown below) the swarm rapidly works itself down over a period of a few thousand years into a system of several terrestrial mass planets. Earth-mass planets in the habitable zone of the star are a very common outcome of the simulations.
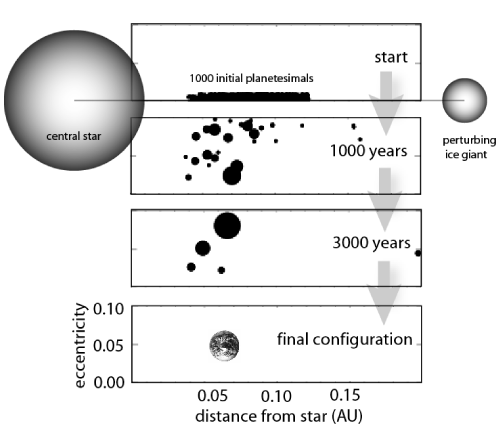
accretion simulation

In a third set (of thirty) simulations, we lowered the masses of the planetesimals to 0.0003 Earth-masses, that is, a factor of ten times lower. The results of these simulations were the formation of Mars-sized or smaller bodies in the stellar habitable zone.

The results have a simple interpretation. The final stages of terrestrial planet formation in the protoplanetary disks of red dwarf stars appears to be an efficient process. If one starts with an adequately high effective surface density of solid material in the disk, then one frequently gets Earth-mass planets in the habitable zone. If one starts with a lower surface density, then one gets final sets of terrestrial planets that (on average) have proportionally lower masses, i.e., no deal.

We believe that the key issue, then, is: what is the appropriate surface density to use?

If one makes reasonable extrapolations from the minimum-mass solar nebula that formed our own solar system, or if one extrapolates from the dust disks which are observed around young stars in the solar neighborhood (see the photo below of the disk orbiting AU Microscopium), then one should adopt a low surface density. This was the approach taken by Sean Raymond in his talk (which followed Ryan at AbSciCon). Sean’s results agreed quite well with our low-surface density simulations, namely, Mars-sized or smaller planets in the habitable zones of red dwarfs.
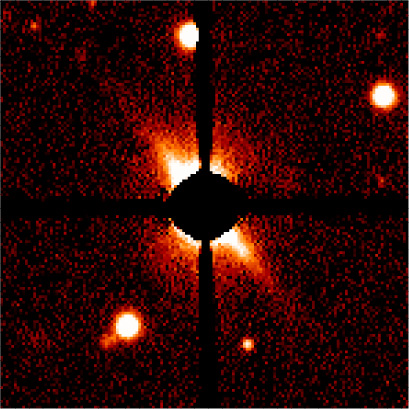
dust disk surrounding AU Microscopium

Submillimeter observations of dust masses in young stellar systems measure the amount of mass in dust, and are not directly sensitive to the amount of mass in large, planetesimal-sized bodies. Furthermore, such measurements give the dust mass at large distances (say greater than 1 astronomical unit at least) from the star, and hence do not give information about the mass of solids present in the innermost region of the disk.

Our preferred high surface density scenario is based on the “Minimum Mass Nebulae” for the inner regions of GJ 876 (0.32 solar mass), and Jupiter (0.001 solar mass). These are the two objects closest in mass to our hypothetical 0.12 solar mass star whose “terrestrial planet” systems we can measure.

In the case of Jupiter, the moon Io has a mass of 8.93e+25 grams, an orbital radius of 0.0028 AU, and an orbital period of 1.8 days. This implies a solid surface density of approximately 12,000 grams per square centimeter at the 1.8 day orbital radius in the proto-Jovian nebula.

In the case of GJ 876, planet “d” (which you can characterize from the actual Keck and Lick radial velocity data using the Systemic Console) has a mass of 4.5e+28 grams (7.5 Earth masses), an orbital radius of 0.02 AU, and an orbital period of 1.94 days. If we assume that GJ 876 d fed off material reaching out to a radius of 0.075 AU, then this implies a solid surface density of 11,000 grams per square centimeter at the 2.0 day orbital radius in GJ 876’s protoplanetary nebula. This is remarkably close to the value for Io. That is, the “rule of thumb” from these two systems suggests an effective surface density of solid material of ~10,000 grams per square centimeter at a 2-day orbital period.

The similarity between the solid surface densities obtained by grinding up Io and GJ 876d suggests that we also adopt a solid surface density of 11,000 grams per square centimeter at the 2-day orbital radius for our 0.12 solar mass star (0.015 AU). Using a reasonable r^-3/2 falloff in surface density as we move away from the star, this suggests a fiducial density of 2000 grams per square centimeter at a habitable-zone radius of 0.045 AU, which is the value that we use in our preferred (sets 1 and 2) simulations.

Once we’ve run a particular simulation, we choose a random angle from which the system is to be viewed. We then generate photometry that is typical of what high-end amateur observers such as Ron Bissinger or Tonny Vanmunster are capable of regularly achieving. For instance, here’s an example of Ron Bissinger’s observation of HD 149026b shortly after it was discovered.

We then “observe” the system by creating a simulated photometric time-series over a period of several hours, during the intervals in which a transit might possibly occur.

Our simulations imply about a 1.0% a-priori probability that a 0.12 solar mass red dwarf has a detectable, habitable planet. That means that most of the simulated systems, when observed at a random viewing angle, don’t show any transits:
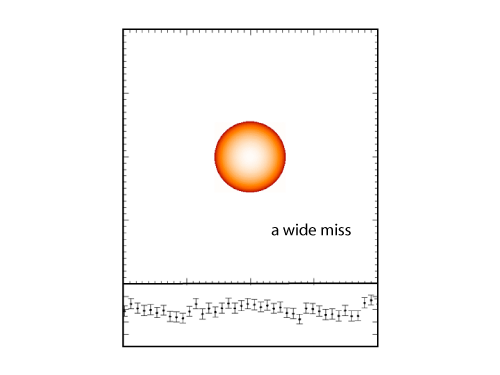
simulated photometry of simulated system 18

With the omnipotence afforded by the simulation output files, we know that some of the simulations were not that far away from having a transiting planet:
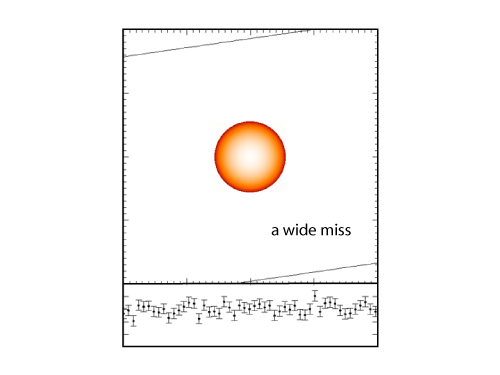
simulated photometry of simulated system 1

Whereas some were closer still:

simulated photometry of simulated system 23

In this case, a tiny planet produces a grazing transit that is completely unobservable with 0.4% differential photometry:
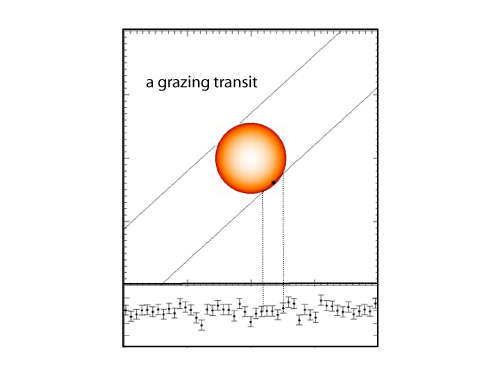
simulated photometry of simulated system 47

And then, finally, gloriously:

simulated photometry of simulated system 42

That’s how I think we’ll get our first look at a truly habitable world orbiting an alien star.

Finally, back to the passage from John Herschel that starts this post off with an egregious bang. At first glance, it looks like a totally outrageous bit of self-serving grandstanding. Moreover, the quote itself is well-known to the extent that a reasonable person might justifiably press charges of second or even first degree cliche. On second glance, however, it actually seems rather appropriate.

Columbus thought he was headed for the East Indies, and he was justifying his expedition on an assumed distance from the Canary Islands to Japan of only 4444 km (as opposed to the true distance of 19,600 km). He had no conception whatever of America while he was still on the “far shores of Spain.”

Furthermore, the prediction of the existence of Neptune by Urbain Jean Joseph LeVerrier, was based on the large perturbations to the orbit of Uranus which occured from ~1810-1840, and which only occur once per Uranus-Neptune conjunction. The large derangement of Uranus’ orbit allowed LeVerrier to compute predicted ephemerides for the location of Neptune that were accurate enough for it to be quickly discovered by Johann Galle and Heinrich d’Arrest on the night of Sept. 23, 1846. LeVerrier was lucky, however. Even though he assumed an incorrect distance for Neptune of 36.15 AU, based on Bode’s spurious “law”, his method — which was essentially a laborious hand-cranked version of what goes on beneath the hood of the Systemic Console — was able to compensate for this incorrect assumption by invoking a mass for Neptune that was too large (2.9 times too large, in fact), and an eccentricity, e=0.11, that was also too large. Neptune’s actual orbit is currently nearly circular, with e=0.00884. As a result, LeVerrier’s orbital predictions of the location of Neptune in the skies of 1846 were close enough to allow it to be found, even though his predicted planet had an orbital period of 217 years, in comparison to Neptune’s actual period of only 166 years.

This point is often glossed over in the astronomical lore, and LeVerrier (with Adams invariably in tow) is lionized a bit too assiduously as a hero of the scientific method. In fact, luck, in the form of the fact that Uranus and Neptune happened to be close to conjunction, played a major, if not leading role. At the end of the day, we expect the same situation to hold true for those habitable planets transiting nearby low-mass red dwarf stars.
clouds

Habitable planets do have their drawbacks. For one, surface conditions near the triple point of water mean that the weather often interferes with differential photometry. That makes it hard for observers in the www.transitsearch.org collaboration to catch planet-bearing stars under clear dark skies during the time windows when transits are predicted to possibly occur!

cumulus clouds

Such was the case during the March 28, 2006 (06:59 UT) opportunity to check the low-mass red dwarf GL 581 for planetary transits. The planet orbiting GL 581 was announced by the Swiss Planet-hunting team last September (their discovery paper is here). GL 581b is one of the lowest-mass planets known outside our solar system. It’s likely similar in size and composition to Neptune or Uranus, with a minimum mass 17 times that of the Earth. The orbital period is 5.366 days, meaning that the surface temperature should be a bit under the boiling point of water. Tomorrow’s weather forecast for GL581b calls for cloudy skies, humidity near 100%, and afternoon highs near 180 F at the substellar point; the planet almost certainly spins once on its axis for every trip it makes around the star.

GL581 represents an ideal candidate for transitsearch.org observers, and there is no mention in the discovery paper that an attempt was made to check the star for planetary transits prior to the end of last year’s observing season. This lack of a transit check in the discovery paper makes sense, given the planet’s relatively low 3.6% a-priori transit probability, and the 5.366 day orbital period. Without a network of observers spread across the globe, it can take a very long time at a particular spot before one catches a transit window when the sky is (1) clear and (2) dark, and when the star is (3) high overhead. GL581b is a very exciting planet regardless of whether it transits, and so I’m sure Bonfils et al. just wanted to just get their discovery published in the literature. Papers “in prep.” garner no citations. Until Astronomy produces its first commercial killer apps, citations will remain the coin of the realm.

DSS2 Red Image of GL581

GL 581 is a springtime star, visible from both the Northern and Southern Hemispheres. There was an excellent opportunity last night for California observers to catch the transit, but the Golden State seems to have been clouded out from top to bottom. I have not gotten any reports of observations being made. The next windows of opportunity, and the best viewing sites are:

(1) April 2, 2006 19:04 UT — Japan, Australia
(2) April 8, 2006 00:33 UT — Europe, South Africa
(3) April 13, 2006 09:20 UT — North, South America

The transitsearch.org network has participants in all of these locations, so we should be set.

Boy oh boy would it be a big deal if GL 581b turns out to transit. The occurence of transits would fix the inclination of the planetary orbit, which would eliminate the sin(i) degeneracy that currently plagues the mass estimate. If the planet transits, we would know that it truly has a Neptune mass. The depth of the transit would give us the planetary size, which, coupled with the mass, would yield the density. The density would tell us what the planet is made of. If it is primarily water, like Uranus or Neptune, then we expect a radius of ~0.3 Jupiter radii. If the planet is made of rock and metal, however, like the terrestrial planets in our solar system, then the radius will be smaller, more in the neighborhood of ~0.22 Jupiter radii. A water-rich composition would tell us that the planet formed further away from the star, and then migrated inward to its steamy current location. This information, in turn, would give us valuable insight into the conditions that held sway in the disks surrounding low mass stars, and would help guide our hypotheses regarding the presence of habitable worlds orbiting the lowest mass stars.

Hopefully we’ll snag a transit on April 2nd and then confirm it on April 8th and April 13th. If that happens, I’ll mail a dollar to every registered user of oklo.org. With roulette wheel-like 3.6% odds, I’m not exactly betting the house, but nonetheless, hope springs eternal!

If you are interested in participating in transitsearch.org, feel free to subscribe to the (moderated) transitsearch.org observers list.

HD 149026

The Solar System was once a gigantic black cloud in space, imbued with a tiny overall spin in some particular random direction. The net spin of our ancient protostellar cloud is still manifest in today’s solar system. The planets all orbit the Sun in a direction counterclockwise as seen from above. The major planetary satellites (with the exception of Triton) all orbit counterclockwise as well. The Sun spins on an axis that lies within 7 degrees of the average orbital plane of the planet.
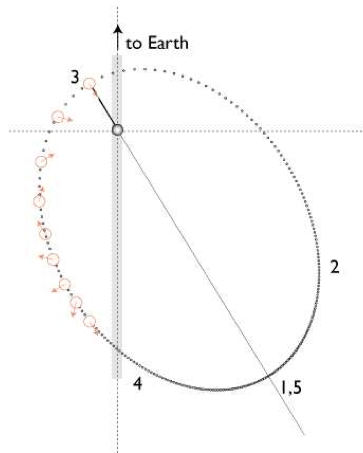
Star trails

The law of conservation of momentum suggests that alien planetary systems should display a similar state of orbital affairs. When a planetary system forms more or less quiescently, and more or less in isolation, then the final spin axis of the parent star should be nearly perpendicular to the orbital plane of the planets.

If the stellar equator and the planetary orbital planes are far from alignment, then we have evidence that disruptive events occurred early in the history of the planetary system. Spin-orbit misalignment hints at planetary collisions, ejections, and other dramatic events. In the Solar System, for example, the crazy 97.77 degree tilt of Uranus’ polar axis may be evidence that a large (perhaps Earth-mass) object collided with Uranus early in its history, leaving its spin axis askew, and its poles bathed in an endless succession 42-year days.

HST photo of Uranus

In a new paper accepted for publication in the Astrophysical Journal, members of the systemic team have participated in an investigation of the spin-orbit alignment of the recently discovered transiting planet orbiting HD149026. Our goal was to get a better sense of whether this star-planet system suffered a catastrophe in its distant past.

HD 149026 b was discovered last year by N2K (the discovery paper is here). The planet has a mass ~114 times that of the Earth (slightly bigger than Saturn) and has a 2.875 day orbital period. By measuring how the star’s light dims as the planet passes in front of the star, it’s possible to determine the size and the exact orbital geometry for the system. Here’s a scale model in which the star, and the planet, and the orbit are all shown in their correct proportions:

The HD 149026 planetary system

Perhaps the most charming aspect of HD 149026 b (to the limited extent that a scalding 1600K planet can exert charm) is that the planetary sidereal year lasts exactly one weekend. That is, if you punch a clock at noon on Friday, the planet has made one full orbit at 9:01 am the following Monday.

Perhaps the most scientifically interesting aspect of HD 149026 b is its small size. The transit depth is only 0.3%, which implies that the planet has a radius of only ~0.7 Jupiter radii. That is surprisingly small, given the high temperature on the planetary surface, and tells us that the planet is quite dense. It needs to contain at least 50 Earth masses of elements heavier than hydrogen and helium. This huge burden of heavy elements is hard to explain. One possibility is that the planet was built up from the collision of several Uranus or Neptune like objects. If this were the case, then one might expect that the final orbital plane could be significantly misaligned with the equatorial plane of the star.

Our measurement of the spin-orbit alignment for HD 149026 makes use of a phenomenon known as the Rossiter-McLaughlin effect. In 1924, Rossiter and McLaughlin independently measured the spin-orbit alignment of the eclipsing binary systems beta-Lyrae and Algol by modeling the variations in the measured radial velocities of the stars during transit. This effect, now appropriately called the Rossiter-McLaughlin effect, occurs any time an object (star or planet) occults part of a rotating stellar surface. The following figure shows how a rotating star outputs a small red-blue shifted version of its spectrum as we examine the changing radial spin-velocity from one limb to the other. When a planet passes in front of the oncoming limb, it blocks out red-shifted light, while the planet blocks out blue-shifted light when covering the outgoing limb. This is interpreted by the radial velocity code as a positive and then negative shift in the radial velocity of the star. The amplitude of this effect is thus due both to the spin velocity of the star as well as the total flux blocked out during transit.

schematic diagram showing rossiter effect

The Rossiter effect can be used to tell us how closely the stellar equator is aligned to with the orbital plane of the planet. When the planet’s path across the stellar disk is not parallel to the stellar equator, the radial velocity zero-point does not occur at the transit mid-point, and the radial velocity curve is asymmetric. The figure above illustrates how this works.

High-cadence radial velocity observations taken during a transit are required to accurately measure the Rossiter effect. The in-transit velocities can be combined with other data, including the out-of-transit radial velocities which constrain the planetary orbit, and the transit photometry. An overall coupled model of all of these data can then give us the best possible picture of the system. Our new paper describes the exact details of how such an overall model can be constructed for HD 149026. The end result is that the equator of the star and the orbital plane of the transiting planet are quite well aligned; we measure the value of the misalignment angle to be 11 plus or minus 14 degrees.

Although a fourteen degree (1-sigma) uncertainty is more than we’d like, it nevertheless provides an excellent constraint on the HD 149026 system. Since the misalignment of our own sun is ~7 degrees relative to the net planetary orbital angular momentum, and because we believe that the solar system formed fairly quiescently, we are primarily interested in whether HD 149026 b sports a severe misalignment (say 40 degrees or more). From our modelling, it’s clear that the orbit and planetary spin are not egregiously out of whack. Hence, there’s no evidence of a particularly disruptive formation history. That is, no catastrophic orbit altering collisions between massive protostellar cores. Rather, we are left with evidence of a more traditional, more mundane history, in which planetary formation was dominated by gradual accretion and the prolonged interactions with a planetary disk

And the mystery of HD 149026b’s large core persists. How did all those heavy elements — all that oxygen, nitrogen, carbon, iron, gold, get into the planet?

Our favored explanation draws on a scenario described by Frank Shu in 1995, in which the planetesimal migrates radially inward through the planetary disk until it reaches the interior 2:1 resonance with the “magnetic X-point,” the outermost point at which closed stellar magnetic field lines intersected the planetary disk. At the X-point, heated ionized gas is forced to leave the disk and climb up the field lines to accrete directly onto the star. In this occurs, the planetismal is stuck in a gas-starved environment for the remainder of the disk lifetime, and is essentially fed nothing but rocks and heavy elements for millions of years. The end result is a crazy-large 72 Earth-mass core in the middle of a 114 Earth-mass planet.

octave

A very interesting new planetary system has been discovered in orbit around the nearby star HD 73526, a solar-type main sequence dwarf visible from the Southern Hemisphere. The discovery was made by Chris Tinney, Paul Butler, Geoff Marcy and their collaborators on the Anglo Australian Planet Search Project. The discovery paper has been accepted by the Astrophysical Journal, and a preprint describing the discovery has been posted to arXiv.org.

photo credit: Adriane Steinacker

[Photo of persimmons at Rakushisha, Kyoto, Japan, c2005 Adriane Steinacker]

The system contains two giant planets. The inner, slightly more massive planet (imaginatively named “b”) contains at least 3 Jupiter masses, and orbits with a 188 day period. The outer planet, c, is only slightly less massive, with about 2.5 Jupiter masses. It orbits with a period of roughly 379 days. Planet c is a true room temperature gas giant. Liquid water likely blows in gusty sheets across its cloudy skies. (And it’s worth noting that any large moons circling HD 73526 c lie pleasantly within the stellar habitable zone.)

orbits of HD 73526 b and c

The large masses of the two planets, and their relatively small orbital separation, indicate that they exert strong perturbations on each other’s motion. It appears that in order for the system to be stable, it is required that b and c exist in a protective 2:1 resonance. In other words, on average, planet c circles the parent star exactly half as many times as does planet b. Amazingly, however, it appears that the periastron points of the two orbits are not locked in sync, but rather circulate at very different rates around the star. This situation leads to a bizarre orbital motion when plotted over thousands of years. I’ve made an mpeg animation which shows how this works. In the animation, the clockhand like lines show the periastron angles of the orbits. They undergo a crazy, almost drunken, dance, but somehow, the system configuration manages to remain stable indefinitely.
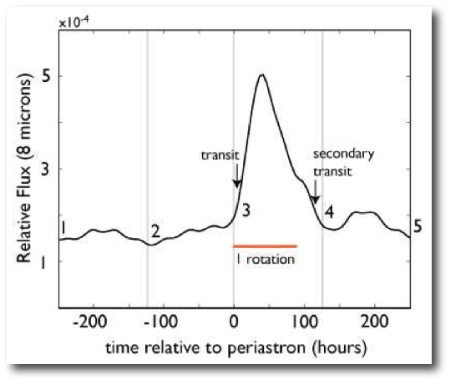
I’ve also added the published radial velocity data for HD 73526 to the Systemic Console. Take a peek at the published orbital parameters (both Keplerian and dynamical) if you have a hard time rolling the Console’s Levenberg-Marquardt algorithm into the best-fit configuration. I will put up a post shortly which goes into more detail about the dynamics of this fascinating system and what they tell us about planetary formation.
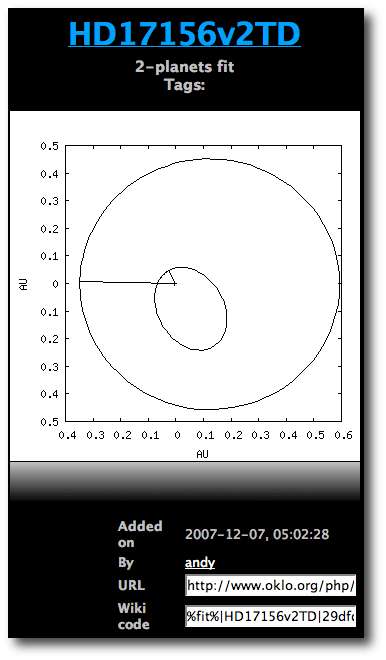
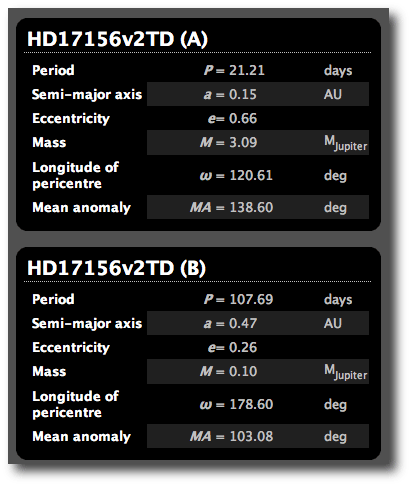
M

This post follows up post #14, The Next Big Thing.

proxima centauri

In 1916, in circular #30 of South Africa’s Union Observatory , Robert T. A. Innes reported the discovery of a faint red star in Centaurus. This otherwise unremarkable star, more than 100 times too faint to be seen with the naked eye, attracted his attention because it was rapidly moving with respect to other stars in the same part of the sky. This large proper motion indicated that the star was almost certainly a close neighbor of the Sun, and in 1917, this suggestion was verified. The distance to the star was measured to be only 4.22 light years, closer to the Sun than any other known star. Its extremely faint appearance, in spite of its close proximity, made it the intrinsically least luminous star known to astronomy at that time.

Proxima Centauri, as the star was later named, is now known to be merely the nearest (and most famous) of the roughly 50 billion red dwarfs (also called M-dwarfs) which inhabit our galaxy.

What about planets? Is it possible to have a terrestrial planet in orbit around Proxima? Do red dwarfs have a shot at harboring life-bearing worlds? If such worlds exist can we detect them?

Yes.

Continue reading

Getting HD 99429 ready for its screen test

Nine extrasolar planets are known to transit their parent stars, but all of these planets have periods shorter than 5 days. They are frying beneath the brilliance of their parent stars. It would be nice to find a transiting planet with a longer period. Preferably, this would be a giant planet with towering thunderstorms and warm, drenching rains, and orbited by a habitable Earth-sized moon that we could detect with HST photometry.

This image from: http://www.nelsonhancockgallery.com/photography/AD.07.rain.lights-xl.jpg

Advanced observers can make the discovery of a transiting room-temperature Jupiter a reality by participating in the systemic team‘s distributed observing project: Transitsearch.org. A brief blurb on the transitsearch.org home page describes the basic strategy:

Transitsearch.org is a cooperative observational effort designed to allow experienced amateur astronomers and small college observatories to discover transiting extrasolar planets. In order to utilize the advantages of a network of small telescopes most effectively, our strategy is to observe known planet-bearing stars at the dates and times when transits are expected to occur.

At present, the majority of confirmed extrasolar planets have been discovered using the Doppler radial velocity technique (see the tutorials at www.oklo.org). The Doppler method, however, cannot determine the inclination of a planetary orbit to the line of sight from Earth. Therefore, each planet discovered by the Doppler method has an a-priori probability of transiting, which depends mainly on the orbital period of the planet. Short-period planets have relatively high transit probabilities, whereas long-period planets have low transit probabilities.

Transitsearch.org hasn’t found a new transiting planet. But if we can maintain the enthusiasm of the collaboration, then eventually it will. Every planet that is detected by the radial velocity technique has a finite a-priori probability of transiting. Hence we need to work systematically down through the list. Chances of success (among planets that have not yet been fully checked) range from a sporty 12.9% for HD 118203 “b” down to a depressingly low 0.1% for 55 Cancri “d” (for which our best-guess next opportunity to observe a transit center occurs, curiously enough, a week after the start of the next long count).

Continue reading

If the suit fits…

Five radial velocity datasets (published last year by Marcy et al. 2005) have just been added to the systemic console: HD 183263, HD 117207, HD 188015, HD 45350, and HD 99492. Each of these more-or-less sunlike stars is too faint to be seen with the naked eye, and each is accompanied by (at least) one detectable planet. The periods range from 17 days to several years. None of these planets were extraordinary enough to warrant much fanfare in the popular press. (Ten years ago, however, the announcement of 5 planets would have been front page news. Ahh, those were the days!)

When you use the console to obtain orbital fits to these systems, you’ll notice that several of the stars have a long-term radial velocity trend superimposed on the variations that arise from the much more readily detectable shorter-period planet. These velocity trends are likely caused by as-yet undetected massive planets lying further out in the systems, and as these stars are monitored over the long term, the orbits of these distant, frigid giants will gradually reveal themselves.

In the meantime, the residual velocity trends underscore an interesting general property of extrasolar planets. The presence of a known planet is the best indicator that a given star harbors detectable (but as-yet undetected) planetary companions. That is, if you want to find new planets, then look at stars that already have known planets. Indeed, six of the first twelve planet-bearing stars that were monitored for more than two years at Lick Observatory were subsequently been found to harbor additional bodies. This impressive planetary six-pack includes luminaries such as Upsilon Andromedae, 55 Cancri, and 47 UMa, in addition to the more pedestrian Tau Boo, HD 217107, and HD 38529. (See Fischer et al. 2001).

55’s the limit

55 Cancri is an ordinary nearby star, barely visible to the naked eye. Through a modest telescope (or, more practically, with the use of the Goddard Skyview) one sees that it is actually a binary pair.

Goddard Skyview Image of 55 Cancri

55 Cancri “A” (the bright star in the middle of the above photo) harbors an extraordinary planetary system. Indeed, it was the subtlety and the depth of the 55 Cancri radial velocity data set that motivated us to develop the systemic console. The fact that the 55 Cancri system continues to defy easy categorization gives us confidence that the systemic collaboration will be a worthwhile project.

Where to begin?

Click on the system menu on the console, scroll down, and select 55 Cancri. (If you’re unfamiliar with the console, and if you’re the methodical type, there are three tutorials available on the menu bar to the right. Otherwise, just follow along!) The published radial data for 55 Cancri now appears in the main console window. The sweeping spray of points, with its curiously non-uniform distribution, contains a fascinating narrative in its own right.

The very first point in the data set has a timestamp of JD 2447578.73 A Julian Date Converter tells us that this was 9:31 PM on Monday Feb. 20, 1989 (Pacific Standard Time). The observation was obtained by Geoff Marcy at the Shane 3-meter telescope at Lick Observatory on Mt. Hamilton, and the velocity error is 9.7 m/s. Back in 1989, Geoff and his colleague Paul Butler were laboring to improve their iodine cell technique, and were struggling to get enough telescope time to adequately track the motion of about 70 nearby solar type stars with the eventual hope of detecting giant planets.

The first 10 radial velocity points were obtained at a rate of 1 to 3 per year. With hindsight, it is easy to see that these 10 points are ample cause for a planet-hunter to be optimistic. The radial velocity variation in the first 10 points spans more than 100 meters per second, suggesting a signal with a signal-to-noise of at least five. The periodogram of these ten points shows a strong peak at 14.65 days, indicating that the data could be explained by a planet with 80% of Jupiter’s mass, circling on an orbit lasting just over two weeks.

Today, if such a planet were discovered, the announcement would not make the news, and the major excitement would be among amateur transit hunters, who would likely have a new high-priority follow-up candidate with a ~5% transit probability. (A two-week period is right at the borderline where transits can be reliably confirmed or ruled out by the photometric collaborators working with the RV-discovery teams prior to announcement of the planet).

In 1993, however, nobody was expecting to find Jovian planets in 14-day orbits. Conventional wisdom at the time was informed by the architecture of our own solar system, and held that gas giant planets should be found beyond the so-called snowline (located at r=4-5 AU) of the protostellar disk. Although the theory of orbital migration had been studied in considerable detail, nobody had proposed that giant planets might regularly spiral in and then be marooned on very short-period orbits. I don’t know whether Geoff and Paul even considered the possibility that the 14.65 day peak in their data was real. If they saw the peak, it is more likely that they would have ascribed it to an alias, an artifact of their uneven hard-won sampling.

During 1994, the velocities suddenly started to trend upward. This would have seemed rather disconcerting, and may even have raised alarm. Was some unaccounted-for instrumental or astrophysical process affecting the newer radial velocity data? Certainly, at the end of 1994, the case for a planet orbiting 55 Cancri would have been weaker than it had been a year earlier.

Nevertheless, the 55 Cancri campaign was at an important turning point. The last measurement of 1994 (JD 2449793.80) has a remarkably lower error (3.3 m/s) than any of the earlier radial velocities. In November of 1994, the Schmidt camera optics on the “Hamilton” spectograph at Lick Observatory had been upgraded, and the resulting improvement effectively tripled the intrinsic resolution to which the spectral lines could be discerned. With the ability to measure radial velocities to a precision of 3 m/s, the planet search had suddenly entered an entirely new realm. When one is in the business of detecting Jupiters, a velocity measurement with 3 m/s precision is literally 10 times as valuable as a velocity with 10 m/s precision.
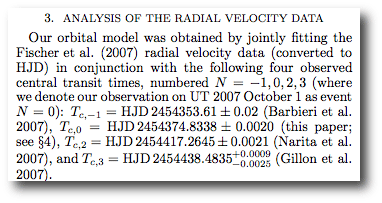
In October 1995, Mayor and Queloz announced their discovery of a Jupiter-like planet in a 4.5 day orbit around the nearby star 51 Peg. Due to a catalog error that misclassified 51 Peg as a subgiant, it had not been included in Geoff and Paul’s survey, but they were able to rapidly confirm the Swiss discovery.

All at once, the idea of a gas giant with a 2-week orbit was no longer outlandish at all. The telescopes on Mt. Hamilton, which had been slipping inexorably in worldwide prestige as larger telescopes were built on higher mountains, were suddenly at the forefront of relevance. The Lick 3-meter telescope-iodine-cell-spectrograph combination was the best instrument in the world for obtaining precision doppler velocities of bright stars such as 55 Cancri. Extrasolar planets were front page news. Alotments of telescope time increased dramatically. In the six months running from December 1995 through May 1996, 55 Cancri was observed 41 times at Lick. This drastic increase in the cadence of observations is easily visible in the radial data:

1996 RVs

With the 41 high-quality observations, the presence of the 14.65 day planet was obvious in the power spectrum.

RV powerspectrum

In October 1996, Paul, Geoff, and several other collaborators announced the discovery of the 14.65 day planet, and in January 1997, they published the discovery in a now classic paper that also introduced the world to the inner planetary companions of Tau Bootes and Upsilon Andromedae.

With eight years of data, it was clear that other bodies were present in the system. In the discovery paper, Butler et al. wrote:

The residuals exhibit a long-term trend, starting at -80 m/s in 1989 and climbing to +10 m s-1 by 1994 (the velocity zero point is arbitrary). The velocities appeared to decline toward 0 m s/1 during the past year, although at least another year of data will be required for confirmation. This trend and the possible curvature in the velocity residuals are consistent with a second companion orbiting HR 3522 [aka 55 Cancri] with a period P > 8 yr and M sin i > 5MJUP.
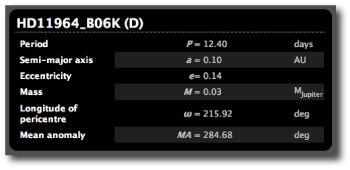
This speculation proved to be correct. Use the console to get a best-fit for the 14.65 day planet, and compute the periodogram of the residuals to the fit:

RV residuals powerspectrum

The strongest remaining peak is at 4260 days, corresponding to an 11.7 year orbit (very similar to Jupiter’s 11.8 year orbital period). Keeping the orbits circular, use the “polish” button to produce a Levenberg-Marquardt optimized fit. Zoom in and scroll to show the time interval between 1996 and 2002. The gaps each year when the star is behind the Sun as seen from Earth are easily visible:

Lick RVs 1996-2002

The two planet system does quite a reasonable (but by no means perfect) job of reproducing the observed radial velocities. After the announcement of the first planet at the end of 1996, interest in the star died down to some degree. The number of target stars being observed at Lick was being increased as Debra Fischer stepped in to manage the Lick Survey, and other systems, especially Upsilon Andromedae, were clamoring for telescope time. During the 1998 season, 55 Cancri was observed only twice. By 1999, however, the Upsilon Andromedae system had been sorted out, and renewed attention was focused on 55 Cancri. During 2000 and 2001, it became clear that the system likely contained at least three planets. With the 14.65 and (in my fit) 5812 day planets removed from the radial velocity curve, the residuals periodogram shows a peak at 44.3 days:

residuals of the residuals

The signal from the 44.3 day planet is not as strong as for the other two planets, but a large number of velocities from 2002 seemed to clinch the case for this third planet:

residuals of the residuals

Use the console to optimize the three planet fit using circular Keplerian orbits. When I do this, the chi-square statistic is reduced to 6.4, and the rms scatter is 12.5 m/s. The fit is still not perfect. Either the planets are eccentric, or there are additional planets in the system.

Why does HD 209458 b wear an XXL?

extrasolar planetary transit

In 1999, the sun-like star HD 209458 was discovered to harbor a transiting planet on a 3.52 day orbit. This was a big deal. The recurring occultations permitted, for the first time, an accurate measurement of both the radius and the mass of an extrasolar planet, and there have been a huge number of follow-up observations of the transits using a variety of telescopes and techniques. The most impressive result came from Brown et al. (2001), who used the (now defunct) STIS instrument on the Hubble Space Telescope to obtain a photometric light curve that has precision of about one part in ten thousand per 80-second sample:

extrasolar planetary transit

The plot above can be found in the Astrophysical Journal , or, alternately, the paper containing the plot is available for free at the arXiv preprint server. A careful analysis of the photometric curve and the radial velocity data (which can be explored using the systemic console), combined with estimates for the size, mass and other properties of the parent star, indicates that the planet, HD 209458 “b”, has a radius about 1.35 times larger than the radius of Jupiter, and a mass of 0.69 times Jupiter’s mass. The temperature on the surface of the planet should be a toasty ~1200 K.

Various teams of scientists, including a group led by Peter Bodenheimer here at Santa Cruz, and independent groups led by Tristan Guillot and Gilles Chabrier in France, and Adam Burrows’ group in Arizona have all developed detailed computer programs that can predict how planets respond when placed in different physical environments. Everybody agrees that a gas giant planet with a standard hydrogen-helium composition and the mass and surface temperature of HD 209458 b should have a radius (corresponding to the 1-Atm pressure level) that is about 5-10% larger than Jupiter. The observed size of the planet is thus far out of agreement with the theoretical models. The planet is too large!

As soon the size problem became clear, a number of explanations for HD 209458 b’s large radius were put forward. The Burrows group (2003) pointed out that the planet may appear large during the transit because we are looking obliquely through long path lengths in the planetary atmosphere. Tristan Guillot and Adam Showman (2002) suggested that the ferocious winds on the planetary surface are transferring energy into the deeper layers of the planet, and that this extra source of energy is enough to bloat the planet to its observed size. These two phenomena don’t require anything special about HD 209458 b, and so both hypotheses predict that other planets with similar masses and temperatures should have similarly inflated radii. This doesn’t seem to be the case, however. In August 2004, a transiting planet of very similar mass and temperature was found in transit around an 11.8 magnitude star known as Tres-1 (Alonso et al. 2004). This planet has exactly the size (~1.05 Jupiter radii) predicted by the baseline theories. It thus appears that there is something unusual about HD 209458 b.

One intriguing possibility, suggested by Peter Bodenheimer, Doug Lin and Rosemary Mardling in 2001, is that another planet exists further out in the HD 209458 system. This planet would be exerting gravitational perturbations on HD 209458 b, which would cause its orbit to maintain a small eccentricity. If a planet like HD 209458 is in an eccentric (non-circular) orbit, then it experiences significant tidal stretching and squeezing which generate heat in the planetary interior. In a follow-up paper published in 2003, Bodenheimer et al. calculated that an orbital eccentricity, e=0.03 would likely be sufficient to generate enough tidal heating to inflate HD 209458 b to the observed size.

At that time, there were only 30 high-precision radial velocity measurements of HD 209458, and it was easily possible to find 2-planet fits to the radial velocity data which had (1) a small non-zero eccentricity for HD 209458 b, as well as (2) a second planet with a period of order 80 days, and a mass of ~0.12 Jupiter Masses. In the following diagram, the orbits are to scale, but the star and especially the planets are grossly too big.

a perturbing body

Over the past two years, the California-Carnegie Planet Search Team used the Keck telescope to obtain a number of additional radial velocity measurements of HD 209458, and these have been published in a new paper. The full set of (out-of-transit) measurements have been loaded into the system menu of the systemic console. In our paper, our conclusion was that HD 209458 b is likely the only RV-detectable planet in the system, and that its orbit is most likely circular (more on this in a future post). See, however, if you can use the console to find viable 2-planet fits that have the correct period for the inner planet P=3.52474541 d, and which have a required RMS jitter for the star of less than 5 m/s. (Technically, you should also apply a simultaneous constraint on Mean Anomaly and eccentricity that arises because the time of central transit is known very accurately, but the console doesn’t yet have this capability. If you find a good fit, and post it here, we can likely fold in the additional timing constraint without greatly changing the basic orbital parameters).

The number of known transiting planets has been increasing steadily, and the total now stands at nine. Using the results of Peter Bodenheimer’s planetary structure code, we can compare the planets predicted sizes with their observed sizes:

the properties of the known transiting planets

(Here’s a larger-size .pdf of the above table, which will appear in an upcoming PPV review article). Three of the planets in the table, HD 209458b, HD 149026b, and HD 189733b, have radii that do not agree at all with the predictions. HD 209458b (and to a slightly lesser extent) HD 189733b are both larger than predicted, whereas HD 149026b is too small, likely because it has a huge rocky core:

a size comparison

These discrepancies indicate that the bulk properties of the transiting planets must depend significantly on factors other than their mass and estimated effective temperatures. Like the planets of our solar system, the extrasolar planets are imbued with interesting individual personalities.

fresh extrasolar planets

fresh extrasolar planets

In a recent article appearing in the Astrophysical Journal, Vogt et al. (2005) published radial velocity data for six stars that appear to harbor multiple low-mass companions. The data for all six stars (HD 37124, HD 50499, HD 108874, HD 128311, HD 190360, and HD 217107) have been added to the system menu of the Systemic Console:

new systems in the console

If you’ve worked through the console tutorials 1, 2, and 3, take a crack at using the console to fit these systems. HD 37124, in particular, is open to several different stable 3-planet configurations. In my current personal favorite fit, three very nearly equal-mass planets are caught up in an endless (or at least multi-billion year) cycle of rub-a-dub-dub. An .mpg animation of the long-term dynamical evolution of the orbits is here. Because the planets in this particular fit are fairly widely spaced, the motion is quite well described by second-order secular theory.

A most eccentric character

Of all the known extrasolar planets, HD 80606b — in both the technical and the colloquial sense — is the most eccentric. This world has at least five times the mass of Jupiter, and it circles its parent star on an extremely elongated 111.4 day orbit:

planetary orbit for HD 80606 b

Today (as seen from Earth!) HD 80606b is still near the far point of its orbit, at a distance of about 0.85 AU from the central star. The temperature in the upper atmospheric layers of the night-side has possibly dipped low enough so that torrential rains and violent thunderstorms are rumbling across its vast billowing horizons. During the rest of December and through most of January, the planet will fall in almost the full distance to the star, eventually swooping within 6 stellar radii as it whips through periastron. On January 26th, at the moment of closest approach, the temperature at the cloud tops will exceed 1000 Kelvin. The auroral displays will be dramatic beyond compare, and indeed, during the days to either side of periastron passage, it might be worth tuning in to the planet on the decameter band.

The discovery of the planet and its orbital solution were announced by the Geneva Observatory Planet Search Team in an April 04, 2001 ESO press release, and the radial velocities have since been made publicly available (right on!) at the CDS repository (see Naef et al 2001). You can therefore use the systemic console to fit this system and examine how radial velocity curves behave for extremely eccentric orbits.

The star HD 80606 is accompanied by a visual binary companion, HD 80607. The projected separation of the two stars is 2000 AU (fifty times the Sun-Pluto distance). When the HD 80606 b travels through the segment of its orbit that lies between the two stars, the night-side cloud tops of the planet are lit by the distant binary companion to ambient brightness that is very similar to a fully moonlit night on Earth. The two stars have similar masses, sizes, and temperatures to the Sun, but, like many of hosts of short-period massive planets, they are enriched in “metals” (gold, chromium, iron, carbon, oxygen, etc. etc.) by a factor of more than two relative to the solar value.

How did the planet get into its weird orbit?

Wu and Murray (2003) have suggested that HD 80606b’s extreme eccentricity is the result of a three-body interaction known as the “Kozai effect” between the planet and the two stars.

The next big thing

We know that planets aren’t rare, and by now, with the tally over at the extrasolar planet encyclopedia poised to blast past 200, the announcement of a newly discovered run-of-the-mill Jupiter-sized planet barely raises the collective eyebrow.

The headline that everyone is anticipating is the discovery, or better yet, the characterization of a truly habitable world — a wet, Earth-sized terrestrial planet orbiting in the habitable zone of a nearby star. Who is going to get to this news first, and when?

299 million dollars of smart money says that Kepler, a NASA-funded Discovery mission currently scheduled for launch in June 2008, will take the honors. The Kepler spacecraft will fly in an Earth-trailing 377.5 day orbit, and will employ a 1-meter telescope to stare continuously (for at least four years straight) at a patchwork of 21 five-square-degree fields of the Milky Way in the direction of the constellation Cygnus. Every 15 minutes, the spacecraft will produce integrated photometric brightness measurements for ~100,000 stars, and for most of these stars, the photometric accuracy will be better than one part in 10,000. These specs should allow Kepler to detect transits of Earth-sized planets in front of Solar-type stars.

Kepler has a dedicated team, a solid strategy, and more than a decade of development work completed. It’s definitely going to be tough to cut ahead of Bill Borucki in line. Does anyone else stand a chance?

Practitioners of the microlensing technique have a reasonably good shot at detecting an Earth-mass planet before Kepler, but microlensing-detected planets are maddeningly ephemeral. There are no satisfying possibilities for follow-up and characterization. Doppler RV has been making tremendous progress in detecting ever-lower mass planets, but it seems a stretch that (even with sub-1 meter per second precision) the RV teams will uncover a truly habitable world prior to Kepler, although they may well detect a hot Earth-mass planet.
There is one possibility, however, whereby just about anyone could detect a habitable planet (1) from the ground, (2) within a year, and (3) on the cheap. Stay tuned…

All hands on deck (GJ 876)

nsf illustration of GJ 876 d

Paul Shankland has been visiting Santa Cruz this week, and everyone agrees that it’s about time to get the GJ 876 transit situation sewed up once and for all. Aquarius is still up in the early evening, and a planet “c” transit opportunity is bearing down with 30.1 day semi-clockwork precision. So out went the following alert to the transitsearch.org e-mail list:
Thursday Afternoon, Nov. 17, 2005

Dear Transitsearch Observers,

We’d like to alert you to an opportunity to check the GJ 876 system for planetary transits. Photometry is desired during a twelve-hour window centered on JD2453693.491 (Friday Nov. 18, 23:47 UT).

As you have likely heard, the GJ 876 system was recently found to harbor a low-mass (7.5 Earth Mass) planet on a 1.94 day orbit. The new planet is referred to (rather prosaically) as GJ 876 “d”, and is the third planet detected in the GJ 876 system. The discovery paper is scheduled for an upcoming issue of the Astrophysical Journal, and is also available on the astro-ph preprint server: http://arxiv.org/abs/astro-ph/0510508

Sadly, transits for planet “d” have been ruled out to high confidence.

As a result, however, of (1) inclusion of the third planet in the dynamical model for the system, and (2) a large number of new high-precision radial velocities, Eugenio Rivera has produced new transit ephemeris predictions for the outer two planets in the GJ 876 system. These differ by several hours from the dynamical predictions that are currently posted on the transitsearch.org candidates site, e.g.:

http://www.ucolick.org/~laugh/GJ876____c.transits.txt

We’re working through an extensive analysis which shows that neither “b” nor “c” is transiting, but this analysis is nevertheless in great need of observational verification. There is a conflict between dynamical fits to the radial velocities (which indicate that the system is inclined by 50 degrees to the plane of the sky) and the results of Benedict et al (2002, ApJL 581, 115), who used HST to get astrometric measurements that suggest a nearly edge-on configuration.
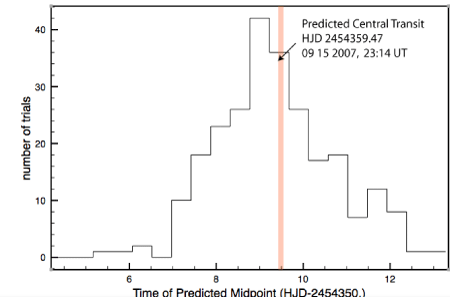
We’d thus like to request photometry of the star to six hours on either side of JD2453693.491 (Friday Nov. 18, 23:47 UT).

Information regarding observing GJ 876 and photometry submission instructions are at:

http://www.aavso.org/news/ilaqr.shtml

Additional background is on the transitsearch GJ 876 results page:

http://www.ucolick.org/%7elaugh/GJ876____c.results.html

Note that this page states that the photometric campaign is over, but the new dynamical model indicates that more photometry is desirable.

Other observing opportunities are (were) as follows:

For planet c (the middle one):

predicted central transit (UT)
————————————
2005 Aug. 20 15:40
2005 Sep. 19 18:41
2005 Oct. 19 20:53
2005 Nov. 18 23:47
2005 Dec. 19 01:36

For planet b (the outer one):
————————–
2005 Aug. 22 17:28
2005 Oct. 22 17:34
2005 Dec. 22 18:05

Finally, we’d like to thank everyone for being patient over the 8 months, during which we have not been running coordinated campaigns. With Shankland of USNO “on the bridge”, we’re now ramping up for a more active phase. Stay tuned!

The music of the spheres (sounds terrible)

After using the console for a while, you’ll notice that it’s often easy to find a reasonably good (say, chi-square of 3-5) multiple-planet fit to a given radial velocity data set. This rule of thumb tends to be especially true if you allow the planets to have large eccentricities. But how does one know whether the fit is likely to be correct?

This is one of the questions that the systemic simulation is designed to answer.

Most of the time, however, if a fit contains large enough eccentricities for the planet orbits to cross, then the trial system will be dynamically unstable. That is, the planets in the model will suffer a close encounter, which is generally followed (or directly accompanied) by a disaster. The planets collide, or one or more of them is ejected, or one of them is thrown into the central star.

While it is certainly true that such catastrophes have been reasonably common throughout galactic history, it is exceedingly unlikely that any particular planetary system that we observe will be on the verge of a dramatic instability. The stars that can be observed using the Doppler radial velocity method are billions of years old. If a star had an unstable planetary system, it is likely that the instability either occurred long ago, or that won’t happen for a long time to come.

As a result, an important requirement for any radial velocity fit is that it correspond to a dynamically stable system. Traditionally, this can be checked either by integrating the system forward in time, or by applying a technique which checks for the presence of chaos in the orbits. (Indeed, all of the planetary systems that underlie the systemic database have been integrated for one million orbits prior to being “observed”. These pre-integrations establish a strong likelihood of short-term dynamical stability for all the systemic systems.)

Here’s an idea that sounds possibly promising. If the radial velocity waveform of a planetary system is converted into an audio signal, is it possible for the human ear to rapidly detect whether a system is likely to be unstable? To test this, we’re working on bringing an audio generator into the systemic console.

More generally, what do the extrasolar planetary radial velocity reflex waveforms sound like? The short answer is, they sound terrible. There are interesting reasons for this, which we’ll pick up in a future post. For now, have a listen to these .wav’s (created by Aaron Wolf) of two of the best-known multiple planet systems: GJ 876 and Upsilon Andromedae

And try to listen for the (heavily processed voice of the better-voice-of-the-two GJ876 in the forthcoming James Alley Remix).