a project outcomes report

For a number of years now, I’ve been a member of an academic collaboration devoted both to studying Internet latency and to designing schemes to generally speed things up on-line. At the end of 2018, our group received an NSF grant to facilitate this research work. Now, three years later, it’s time to submit the final report. As part of the NSF’s close-out process, an accessible research outcomes summary for the general public (containing up to 800 words, and including up to six images) is required. This sounds like a spec list for an oklo.org item, so I’m posting a slightly expanded draft version here.

Everyone knows the frustration of a page that seems to take forever to load. Moreover, even when the interlaced networks that comprise the Web function nominally to deliver requested assets, there exist Internet applications that would benefit dramatically from reduced latency. Examples of such time-sensitive endeavors run the gamut from telepresence and virtual reality to header bidding and blockchain propagation.

At a fundamental level, network speeds are limited by the finite velocity of electromagnetic waves — the speed of light. The maximum propagation speed for light occurs in vacuum. Light is slowed down in air by a negligible amount (0.03%), but in the conventional solid-core fiber optic cables that currently carry the bulk of Internet traffic, light travels at only about 2/3 of the vacuum maximum. Over long distances, and when many back-and-forth exchanges of information are required, this signaling slowdown becomes material. In addition, the actual over-land and under-sea paths taken by cables are often substantially longer than the minimum A to B distance between data centers.

Over the last decade, there has been a flurry of construction of long-haul line-of-sight microwave networks that adhere as closely as possible to great-circle paths. These are operated by latency-sensitive trading firms, who, in aggregate, have mounted significant research and development projects to create global information circuits that are as fast as possible, while simultaneously maximizing bandwidth and uptime.

How feasible would it be to take the lessons learned and apply them at scale to speed up the Internet as a whole? This is a tricky question to answer because the fastest existing long-distance networks were entirely privately funded and their performance remains fully proprietary. Just how fast are they, really? How well do they hold up when weather moves through? How much data can they carry?

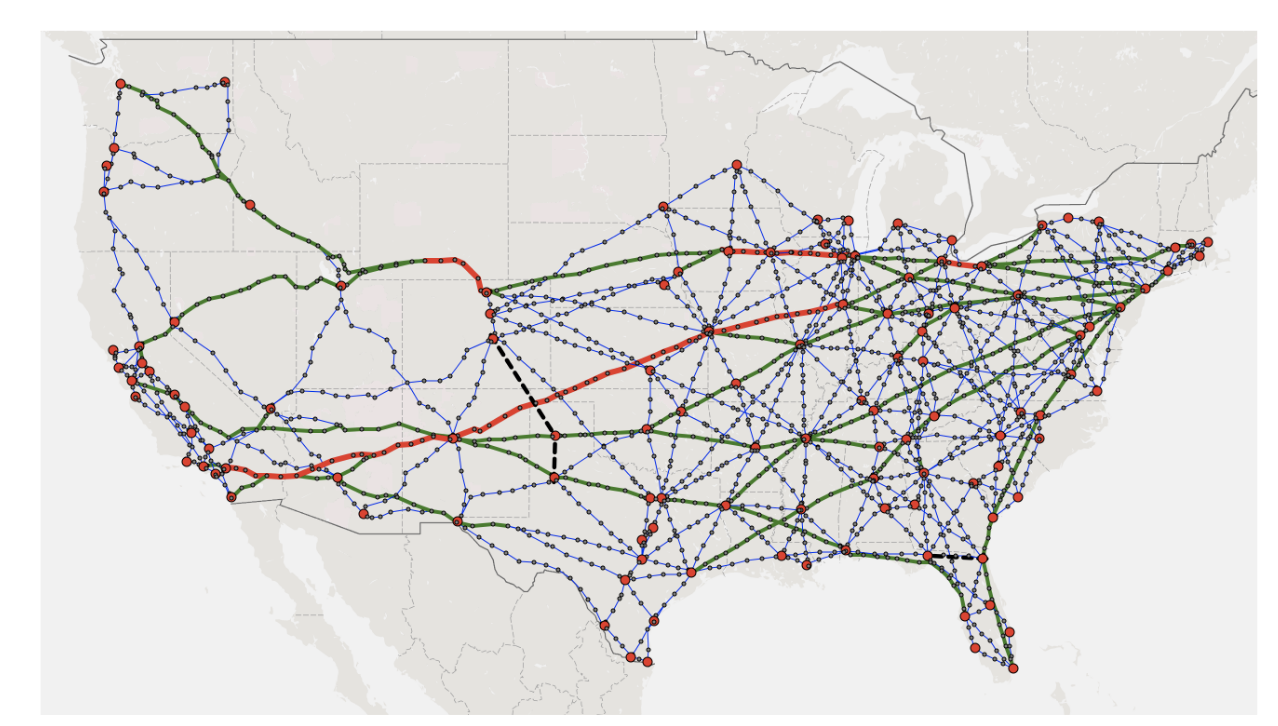
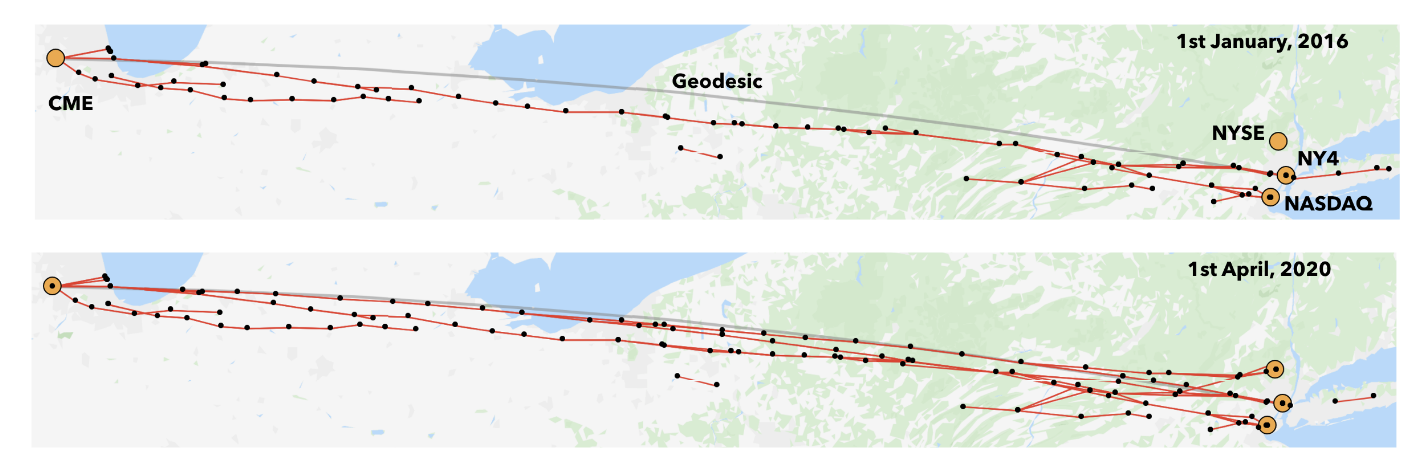
Government database scraping provides a first approach to evaluate the performance of the ultra-low latency networks. In the US, if one wishes to communicate with microwaves, one needs a broadcast license. The FCC maintains a publicly-searchable list of all licenses and licensees, and this data can be assembled to monitor the construction, consolidation, and improvement of point-to-point networks. The figure just below, from our 2020 paper, shows two snapshots in the evolution of the New Line Network, which connects the CME data center located in Aurora, Illinois to the trading centers of suburban New Jersey. Over time, the New Line has clearly grown to provide ever more bandwidth at ever higher availability with a shortest path that adheres ever more closely to the geodesic.

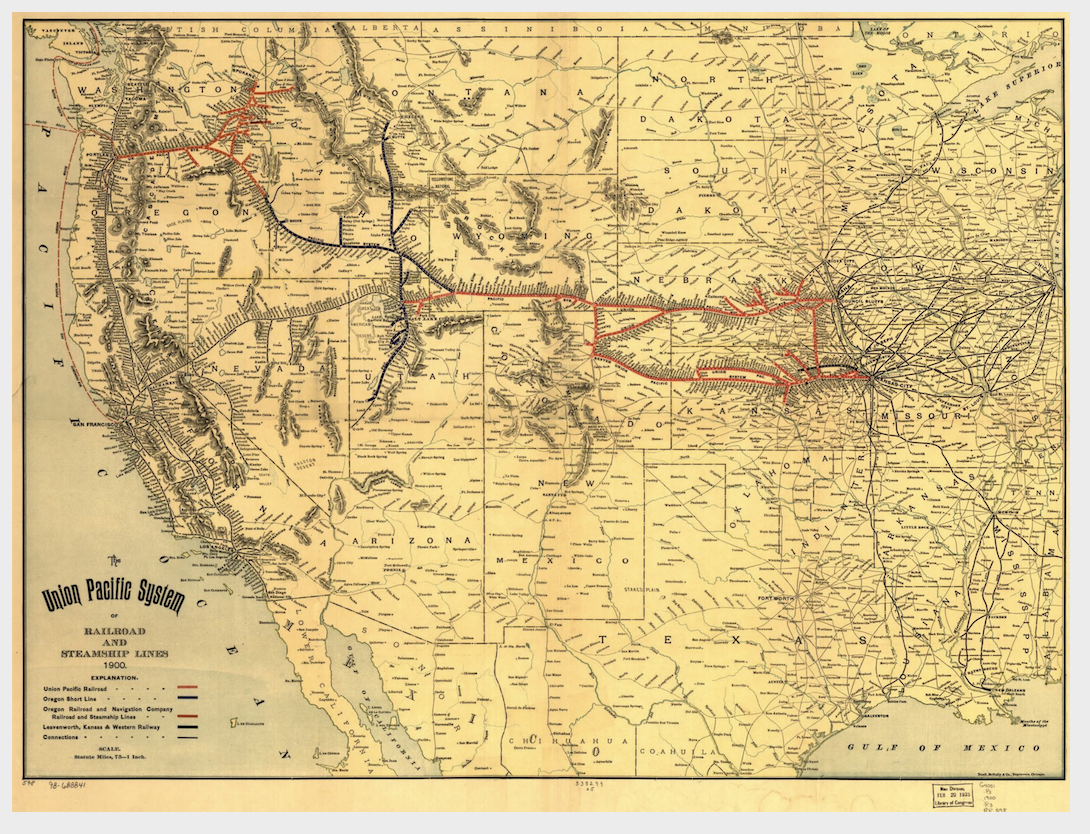
The development and build-out of speed-of-light networks has significant parallels with the emergence of transcontinental railroads during the Nineteenth Century.

The Union Pacific system of railroad and steamship lines, 1900. Library of Congress

In April of 2020, in the licensed microwave bands, there were nine separate FCC-registered networks spanning the Chicago to New Jersey Corridor and linking the CME to the NY4 data center that hosts a variety of equity and options exchanges. The New Line, with a 3.96171 millisecond path-latency (compared to a geodesic minimum latency of 3.955 ms) is seen to be neck-and-neck with several competitors:

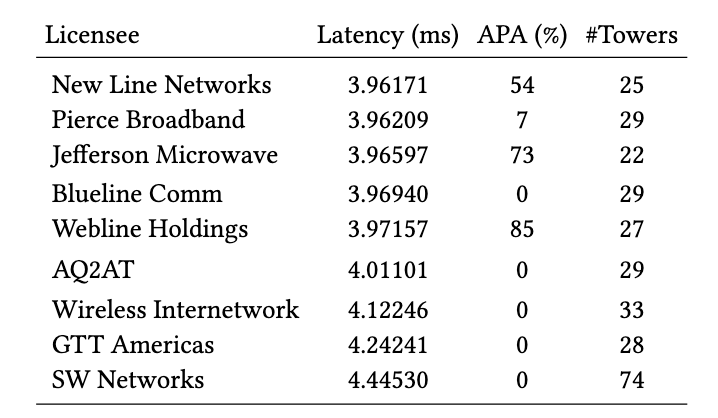
In the above table, APA stands for Alternate Path Availability, and indicates the fraction of links that can be removed (for example by heavy rain) such that the path latency of the remaining network is not more than 5% greater than the speed-of-light minimum.

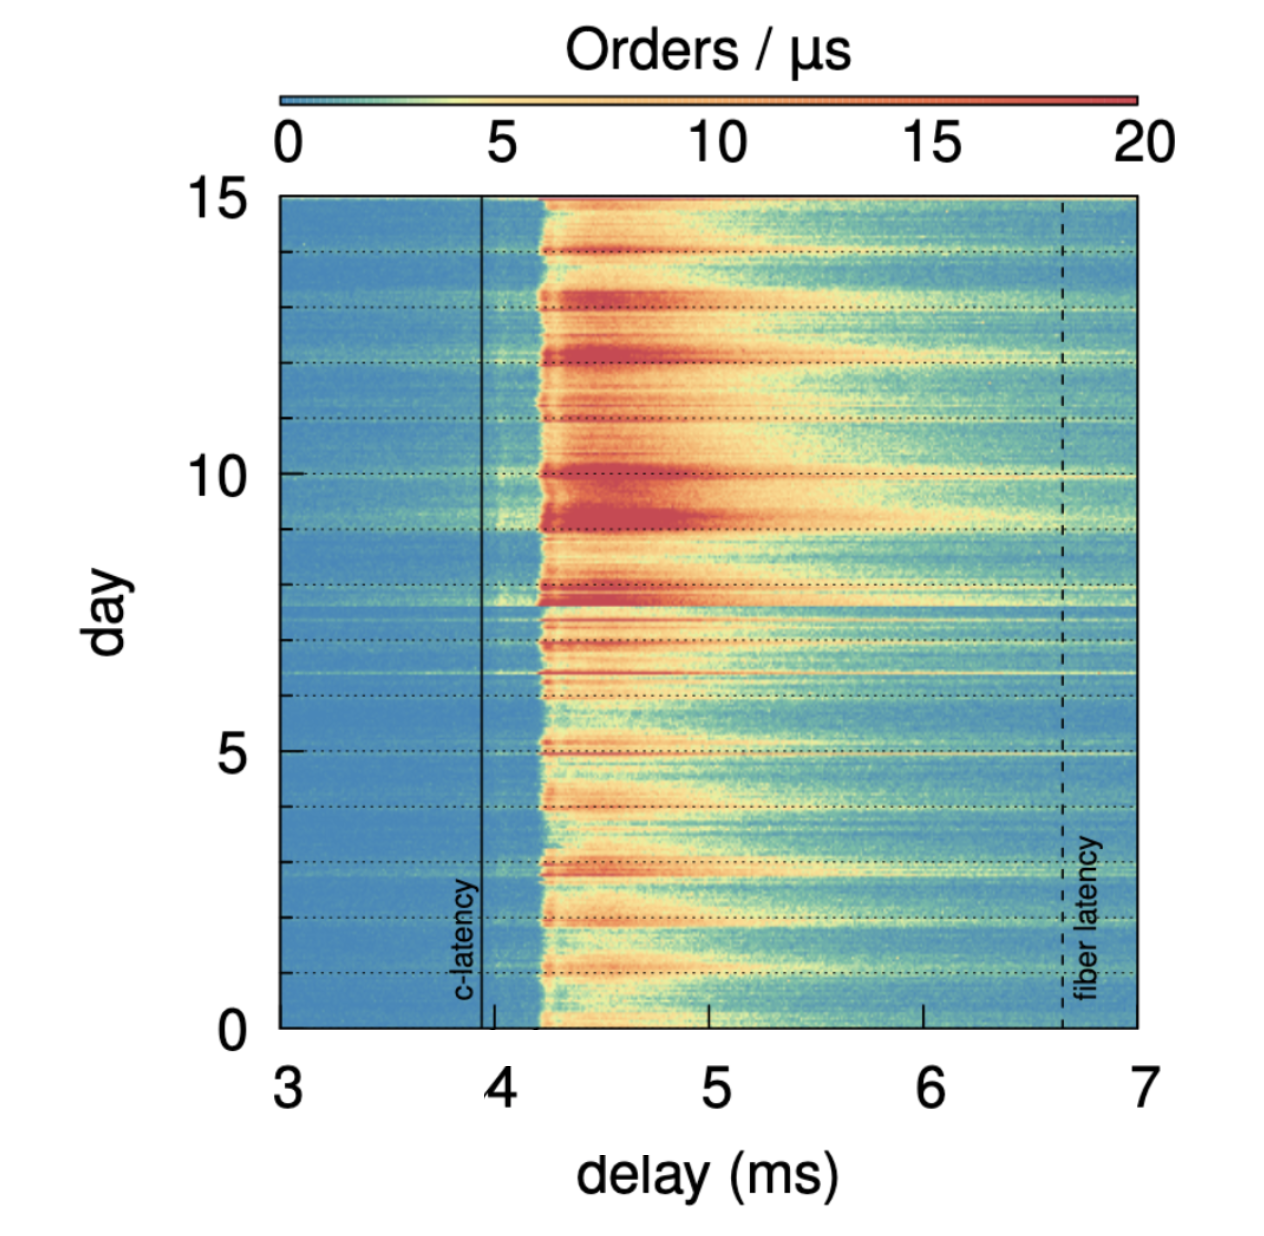
A completely independent monitoring technique consists of correlating precisely time-stamped trading data from Chicago and New Jersey, and measuring the statistical delay between events that occur at one end of the network, and the responses that occur at the other end. As part of the capstone paper for our NSF-funded research, we undertook this analysis using gigabytes of tick data for the E-mini S&P500 near-month futures contract (that trades in Illinois) and the SPY S&P500 ETF (that trades in New Jersey). In work of this type, there are subtle issues associated with measuring the absolute lowest latencies at which information transport occurs across the relay; these subtleties stem from the operational details of the exchange matching engines. For the purpose, however, of demonstrating that the networks consistently run end-to-end within a few percent of the physical limit, even during periods plagued by heavy weather, the signal correlations measured over long stretches of trading provide a remarkably powerful network probe.

The timing of New Jersey response to Illinois events. Over three weeks of stock-market trading (sliced into 15-minute increments along the y-axis), word of price movements always traveled within a few percent of the speed of light, even when when the weather was inclement. This figure illustrates that a large-scale, nationwide speed-of-light network is a real operational possibility…

By taking these (and other) real-world insights into account, and applying them to a transcontinental network design, we’re excited to release — at the 19th USENIX Symposium on Networked Systems Design and Implementation Conference — our most up-to-date vision of what a speed-of-light Internet service provision (a c-ISP) could look like, and what its performance would be.

A 100 Gbps, 1.05×stretch network across 120 cities in the US. Blue links (thin) need no additional towers beyond those currently listed in the FCC database. Green (thicker) and red links (thickest) need 1 and 2 series of additional towers respectively. Black dashed links are fiber.

geysers

The headline images from Cassini at Saturn were the curtain sheets of water vapor and ice crystals erupting from the tiger stripe terrain of Enceladus’ south polar regions.

In the ensuing fifteen years, Enceladus has accreted a lot of habitability hype, so it’s easy to forget that it’s actually a very small satellite. Its diameter, in fact, is less than the driving distance between Hicks Dome and the Crater of Diamonds State Park.

With the small size comes a small escape velocity — 240 m/s — a typical jet airliner speed at cruising altitude. When liquid water welling up in tidally flexed cracks is exposed to the vacuum that surrounds Enceladus, the exit speed of the boiled-off molecules is fast enough that water molecules will readily random walk away from the satellite. The moon acts like a giant low-activity comet. No kimberlite-styled cryptoexplosions are required to launch the H2O into space, just exposure to liquidity when the cracks are forced open at the far point of the slightly eccentric (e=0.0047) orbit.

Jupiter’s Europa, by contrast, is an ice-covered world of far vaster extent. With its kilometers-thick ice shell, it should be keeping a tight lid on its depths, but curiously, evidence has emerged that water is somehow being transiently sprayed to heights of order 200 kilometers above the surface. A 2019 paper by Paganini et al. draws on a combined a set of Keck near-infrared spectral emission lines to support the conclusion that on one occasion out of seventeen, thousands of tons of water were fluorescing in Europa’s tenuous exosphere.

Two instances with no fluorescing water, one instance with fluorescing water (source).

Skeptics and cynics will be quick to remark that one 3-sigma measurement produced in seventeen tries works out to a 1 in 20 chance even with a perfectly normal distribution. And they’re right. Results that are weird and spectacular are generally wrong, and geysers on Europa providing astrobiology fans with fresh organic produce from ten kilometers down would appear to qualify on both counts. Nonetheless, Earth managed to rocket gem-quality diamonds from the mantle up into rural Arkansas, so a down-home precedent clearly exists. Furthermore, HST has captured evidence of UV emission from photolyzed water in the vicinity of Europa, which provides support to the one-in-seventeen result from Keck. Maybe eruptions actually are occurring on Europa?

A serious problem, however, lies in lofting the water to heights of 200 kilometers above the ice. That requires venting velocities of order 700 m/s, pointing toward regular full-blown cryptoexplosions.

Nicole Shibley and I recently published a paper that outlines how such a process could operate:

The cryptoexplosive mechanism is initiated by convective overturn in the Europan ocean, which permits clathrated CO2 to rise to the top of the water column and propagate into cracks. Once the clathrates ascend to within ten kilometers of the surface, the pressure is low enough so that they dissociate, producing explosions that are sufficiently energetic to send carbonated water to dizzying heights. The process, in fact, draws on the peer-reviewed literature on champagne cork dynamics.

… just in time for New Years!

cryptoexplosions

Image Source

Geologically speaking, not much has happened in Illinois since the Permian. In particular, in the ultra-flat vicinity of Urbana where I grew up, there is no exposed bedrock at all. If one takes the effort to dig down through meters of topsoil and glacial till, one eventually hits gray, unmetamorphosed 320-million year old sediments from the Carboniferous — the Mattoon Formation — the crumbly picture of a disappointing drill core.

Something about those miles of dull strata directly underfoot instills a vicarious appeal into the IGS maps for the entire state. And while they are dominated by the vast bland extent of the coal-rich Illinois basin, the margins of the map hint at strange and exotic features, including one, Hicks Dome, that’s so weird that it merits its own circular inset.

The southeastern tip of Illinois is riddled with faults, and pocked by a mysterious, crater-like 275-million year old blemish that is still clearly visible in aerial photographs. The strata that comprise this feature — the Hicks Dome — were pushed up thousands of feet by a carbon dioxide-driven explosion that brecciated the rock miles below and squeezed dikes of lava through cracks toward the surface.

The resulting igneous rocks, which are colored red in the diagram just above, can be extracted from drill cores. Mineralogical tests indicate that the lava ascended at least 25 km from a source of origin in the upper mantle. Then later, during the Jurassic, geothermally heated brines seeped through the faults that shattered the sediments and interacted with limestone to form fabulous fluorite crystals.

Illinois fluorite

An even more remarkable example of a deep-Earth intrusion is located in Arkansas, 383 miles southwest of Hicks Dome. The Prairie Creek Diatreme, more evocatively known as the Crater of Diamonds, is a 106-Myr old igneous pipe filled with solidified lamproite lava that was driven upward (as also occurred at Hicks Dome) by exsolving CO2 gas from a source at least 100 miles down. The crater, moreover, is indifferently salted with actual diamonds, including the occasional big-deal gem.

Source: Arkansas Geologic Survey

Diamonds are metastable when removed from deep mantle conditions, and so in order for them to survive a lava-soaked mix-mastered trip to Earth’s surface, the transport has to be rapid. The lamproite that brought up the diamonds must have smashed its way through a hundred miles of rock with a vertical velocity of order a hundred miles per hour, a marshaling of forces that is undeniably impressive, and indeed, at first glance, completely non-intuitive.

Satisfyingly, a hundred and six million years after the cryptoexplosion, Arkansas is running the lamproite pipe as a State Park, offering end-runs around de Beers at very reasonable rates:

Earth’s last diamond-bearing eruptions occurred tens of millions of years ago. It’s a good thing they aren’t every-day occurrences. Methane gas, however, is currently causing new-school cryptoexplosions that leave ominous lake-filled craters in the permafrost of the Siberian tundra.

On Earth, the crypto prefix can generally be detached from cryptoexplosions once the techniques of laboratory and field geology have been brought to bear. Kimberlite eruptions may seem superficially crazy, but the basic mechanism of their operation is increasingly well understood. Truly mysterious explosions need to occur off Earth, in locations where it’s not yet possible to go in and root around after the fact…

flying objects

Image source: Sam Cabot

All the small things. Truth cares truth brings. I’ll take one lift. Your ride best trip… Vintage Blink played in the background. Tubular radio bulbs placed a diffuse glow on the distressed wood and polished concrete surfaces. The researcher pushed away a half-finished bowl of microgreens and, before taking another sip of single-origin espresso, eyed me with a look somewhere between amusement and concern.

“I mean really. You sound like a relic. You’ve gotta move on. You’ve gotta get with the times. ‘Oumuamua is so 2020. Everyone who’s anyone now is working on UAPs.”

It’s true that the cutting-edge has progressed to bigger and weirder things. Indeed, it’s now been over four years since ‘Oumuamua raced out of sight, and I can’t seem to let that mysterious cosmic visitor out of mind.

The ISO story has been worn smooth through years of retelling, and the details are probably well known to anyone who reads oklo.org: ‘Oumuamua entered the Solar System on a strongly hyperbolic trajectory consistent with a pre-encounter galactocentric obit that was quite close to the local standard of rest. It closed to within 0.25 AU of the Sun. Then, just after passing Earth’s orbit on its outbound leg, it was detected by Pan-STARRs at the end of the third week of October, 2017. Global follow-up efforts with space and ground-based telescopes were quickly mounted. ‘Oumuamua was observed to have a strongly varying light curve, no detectable coma, a slightly reddish color, and it experienced a small but significant non-gravitational acceleration on its way out.

For over a year, I was very enthusiastic about the possibility that ‘Oumuamua’s properties could be explained by appealing to a composition rich in molecular hydrogen ice. Darryl Seligman and I published a paper outlining this idea, which generated a fair amount of interest in the wider media. Last year, however, Yale graduate student Garrett Levine carried out a very detailed investigation to trace how macroscopic objects rich in molecular hydrogen ice might form in the cores of the densest, coldest molecular clouds. Our final conclusion was that while it’s not impossible, it’s very difficult for the present-day Universe to manufacture solid H2. The microwave background temperature just isn’t quite cold enough yet

Recently, Metaculus (which has been undergoing rapid development) launched an on-line journal featuring fortified essays in which an in-depth article on a topic of interest is linked to a set of questions on which readers can predict. Garrett wrote an essay the outlines the future detection and research prospects for ISOs. Everyone’s encouraged to read it and place predictions.

Add your prediction here