Angular Power Spectra

Screen-Shot-2014-12-28-at-10.24.18-PM

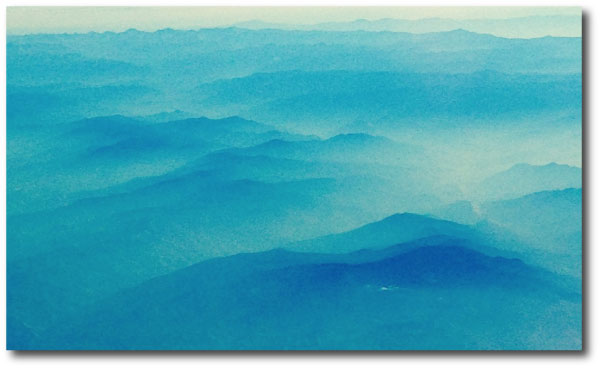
It’s worth a scramble to get a window seat on a Hawaiian inter-island flight. The views are full of craggy green cliffs, porcelain ocean, and wispy masses of fog and cloud. Sometimes, several islands are visible at once, and it’s not hard to imagine that the archipelago might extend over the entire globe.

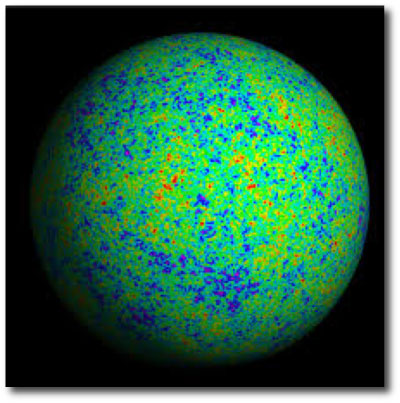
That would be a very different planet, and, in fact, a world covered by hotspot volcanoes might have a surface elevation profile somewhat reminiscent of the WMAP image of the temperature fluctuations in the cosmic microwave background. The WMAP image brings to mind a planet covered in Hawaiian islands.

Screen-Shot-2014-12-28-at-10.36.31-PM

Any distribution, \(f(\theta,\phi)\), on the surface of a sphere, be it of temperature, or elevation, or the density of IP addresses, can be expressed as a weighted sum of spherical harmonics

$$f(\theta,\phi)=\sum_{l,m} a_{l,m} Y(\theta,\phi)_{l}^{m}\, ,$$
where the coefficients corresponding to the individual weights, \(a_{l,m}\) are given by
$$a_{l,m}=\int_{\Omega}f(\theta,\phi)Y(\theta,\phi)_{l}^{m \star}d\Omega\, ,$$
and the power, \(C_{l}\) at angular scale \(l\) is
$$C_{l}=\frac{1}{2l+1}\sum_{m=-l}^{l}a_{l,m} {a_{l,m}}^{\star}\, .$$

The power spectrum of the CMB anisotropies peaks at \(l\sim 200\), which corresponds to an angular scale on the sky of \(\Delta \theta \sim 1^{\circ}\), which is very close to the solid angle subtended by the Big Island of Hawaii on the surface of the spherical Earth.

Here’s a recent version of the CMB temperature anisotropy spectrum from the Planck Mission website

Screen-Shot-2014-12-29-at-9.24.16-AM

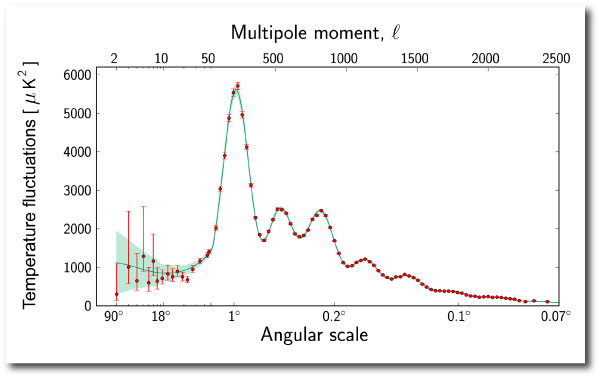
The peaks in the spectrum of CMB temperature anisotropies stem from acoustic oscillations and diffusion damping in the early universe, and they encode all sorts of information about the fundamental cosmological parameters. This, of course, is very well-known stuff: a search on all literature in the ADS database published since 2000, and ranked by citations, lists Spergel et al. 2003, First-Year Wilkinson Microwave Anisotropy Probe (WMAP) Observations: Determination of Cosmological Parameters at #1, with 7,914 citations and (rapidly) counting.

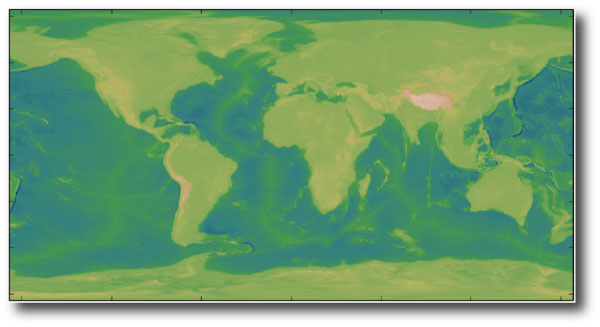
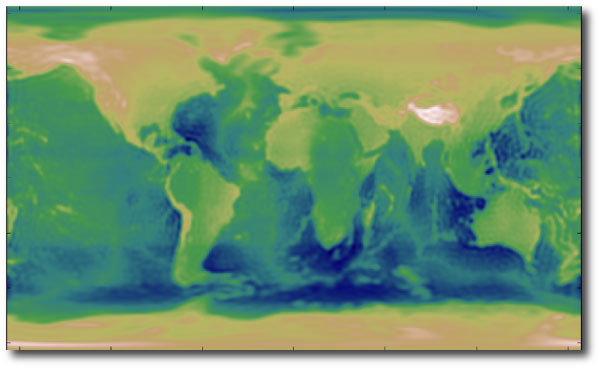
Given the similarity between the angular scales of the Hawaiian islands and the main CMB peak, it’s interesting to compute the angular power spectrum of Earth’s bedrock elevation profile. A global relief dataset with one arc-minute resolution is available from NOAA as a 4GB (uncompressed) file. Downsampling by a factor of 100, and applying the “terrain” color map yields a familiar scene

Screen-Shot-2014-12-29-at-10.33.14-AM

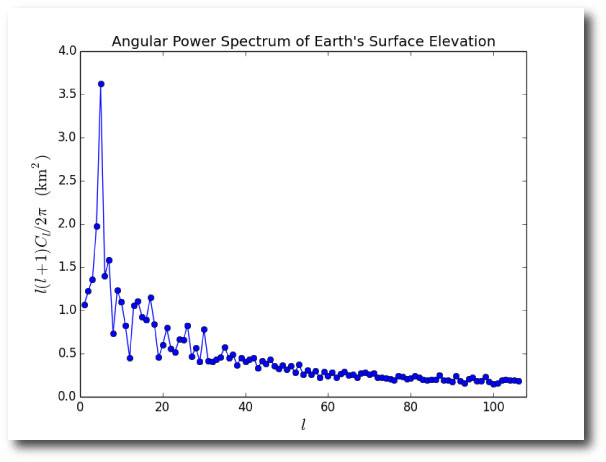
Computing the power in the first 108 angular modes of the relief distribution in the above data set gives a spectrum that is weighted toward continents and ocean basins rather than archipelagos. There is a pronounced peak at \(l=5\) that reflects the typical angular scale of continents and ocean basins.

figureAng_1

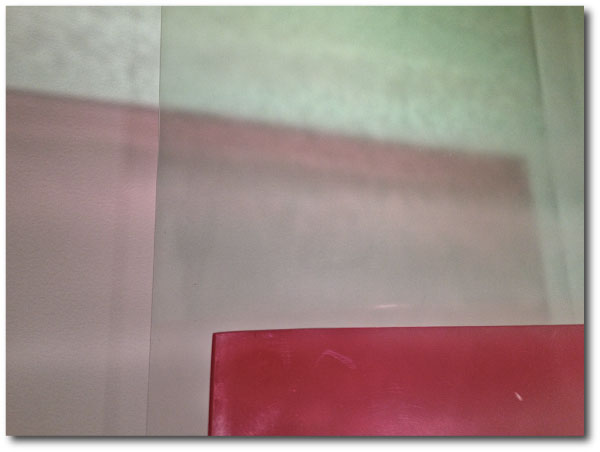
Here is the global relief distribution obtained by summing just the \(l=5\) contributions. It’s right for more or less the same reason that Crates of Mallus was right:

Screen-Shot-2015-01-01-at-6.06.04-PM

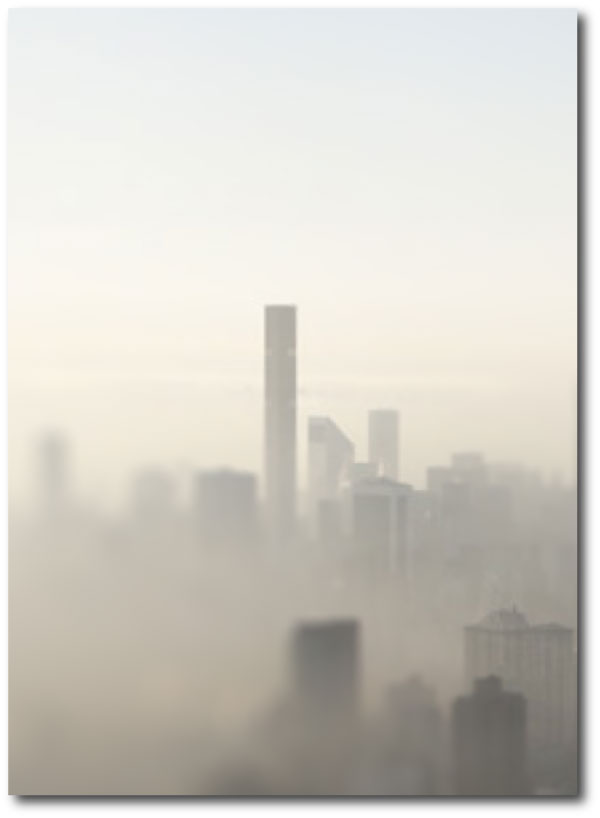
Using all 108 angular mode families to reconstruct the image gives a fairly credible-looking world map. It’s as if the watercolors ran slightly before they dried. Most critically, the \(l=108\) reconstruction fails to capture the highest peaks and the lowest ocean trenches, and hence more of the dynamic range of the color map is distributed across the globe.

Screen-Shot-2014-12-31-at-6.06.04-PM

Degree-wide islands like Hawaii are the exception rather than the rule on Earth’s surface. I believe that this was the concept that former US Vice President Dan Qualye was struggling to express in one of his much-ridiculed pronouncements:

Hawaii has always been a very pivotal role in the Pacific. It is IN the Pacific. It is a part of the United States that is an island that is right here.

(See also his comments on Mars.)

Skyscraper

Screen-Shot-2014-12-18-at-4.29.07-PM

A few weeks ago, I had a flight out of LaGuardia Airport in New York City. On the drive there, I caught a distant glimpse of the Manhattan skyline. I was startled to see that it is newly altered. Rising from midtown was a silhouette that seemed both impossibly narrow, and taller than any other skyscraper in the far-off cut-out.

Photo Credit: 432 Park Avenue -- processed screenshot

Original Photo: 432parkavenue.com — Photoshop processed screenshot

The Internet, of course, has the story. 432 Park Avenue — $1.25B, 426 meters, the highest rooftop in the city. Many of its floors, especially the higher ones, are monolithic residences, in the process of acquisition by opaque, limited liability corporations, “bank safe deposit boxes in the sky that buyers can put their valuables in and rarely visit.”

Often, the aesthetic informing such projects veers toward the rococo, but 432 Park is minimalist to the core. Every window of the tower is an exact 10 foot by 10 foot square. From the elaborate on-line galleries, it wholly ambiguous whether the surreal bone-parchment interiors already exist or whether they are virtual. Somewhere, in micrometric accuracies of the digital architectural model, lies the pattern of the seasons, the moment of the equinox, the precise angle of sunlight shafting into the cavernous, unvisited, perhaps as-yet unconstructed rooms.

Like the pyramids at Giza — after they were sealed and before they were robbed.

Dead voices on air

Screen-Shot-2014-12-17-at-10.04.00-PM

This Fall quarter, I taught a class for undergraduates on order-of-magnitude estimation in physics with a focus on astronomical examples. And on the last day of class, with final exams looming, what could be better that the time-tested stress relievers provided by the Fermi Paradox and the Drake Equation?

In Los Alamos National Laboratory publication LA-103110MS, “Where is Everybody?” An Account of Fermi’s Question, Eric Jones describes how Enrico Fermi, Emil Konopinski, Edward Teller, and Herbert York were diverted into their famous lunch-time conversation in the summer of 1950. While walking to the cafeteria, they were discussing news reports of UFOs, and an associated New Yorker cartoon that explained why the public trash cans in New York City were disappearing.

Screen-Shot-2014-12-18-at-8.01.51-AM

The flying saucers of the early 1950s hold a special fascination. A compound of Cold War anxieties — nuclear weapons, communists, infiltrators — they are silvery and remote, icons of minimalist design from a time when the space age was truly, rather than retro- futuristic.

Indeed, much of my own interest in astronomy can be traced to 50’s-era flying saucers. In the Bicentennial summer of 1976, after finishing third grade, I got a paper route delivering the Champaign-Urbana Courier. One of my customers, Mrs. Barbara Houseworth, had a garage full of cast-off books that she collected for an annual drive. I spent a great deal of time examining them whenever I visited to collect the subscription fee. I was particularly drawn to the pulpy paperback books — especially the ones with clay-coated photographic inserts — that covered the Bermuda Triangle, Bigfoot, the Loch Ness Monster, and Flying Saucers. All matters that seemed to merit the most urgent scientific concern.

Screen-Shot-2014-12-18-at-10.57.41-AM

At the top of my list was Gray Barker’s They Knew Too Much About Flying Saucers, published in 1956. I was so taken with it that Mrs. Houseworth simply gave me the book.

FullSizeRender

Gray Barker was an intriguing character, a closeted gay man in mid-century West Virginia who took a certain delight in channeling the fears and neuroses of the American masses into money-making volumes. Barker’s invention of the three men in dark suits, in particular, achieved a lasting cultural resonance. There is more about him at the UWV Center for Literary Computing, and he is the subject of several recent documentaries.

saucerfilmstills

The message in the Cold War flying saucer books was crystal clear. Watch the Skies. And I did — on many clear dark Central Illinois nights with a Sears catalog 50mm refracting telescope…

Back to Friday’s class. We adopted the following form for the Fermi-Drake equation
$${N} = \Lambda ~f_{\star \rm{app}}~f_{\rm pl}~f_{\rm quqHP}~f_{\rm life}~f_{\rm macro}~f_{\rm intel}~f_{\rm tech}~L\,,$$
where \(N\) is the number of broadcasting civilizations in the galaxy, \(\Lambda\) is the number of stars formed per year in the Milky Way, \(f_{\star \rm{app}}\) is the fraction of stars with main sequence lifetimes long enough to support the development of a broadcasting civilization, \(~f_{\rm pl}\) is the fraction of stars with planets, \(~f_{\rm HP}\) is the average number of “habitable” planets per star, \(~f_{\rm life}\) is the fraction of these habitable planets that develop life, \(~f_{\rm macro}\) is the fraction of life-bearing planets that develop macroscopic life, \(~f_{\rm intel}\) is the fraction of macroscopic life-bearing planets that develop an “intelligent” life form (e.g. one that can orient itself abstractly in time), \(~f_{\rm tech}\) is the fraction of intelligent species that develop an understanding of the Maxwell Equations and build radios, and \(L\) is the civilization lifetime in years.

We defined and estimated two versions of \(L\). \(L_{\rm radio}\) is the average length of a time that a civilization leaks modulated electromagnetic signals into space. \(L_{\rm extinct}\) is the lifetime of the civilization, marked from the understanding of Maxwell’s equations to the point where the equations are collectively no longer understood.

The first few terms in the equation have been elevated from the realm of science fiction. I’ve adopted values of \(~\Lambda=10\,{\rm stars~yr^{-1}}\), \(~f_{\star \rm{app}}=0.75\), and \(~f_{\rm pl}=0.75\). Note that \(~\Lambda=10\,{\rm stars~yr^{-1}}\) is admittedly on the high side, even for 4.5 Gyr ago when star formation was somewhat more prevelant in the Galaxy.

Here is the table of values for the unknown terms, as estimated by the class members. I tried not to influence the results by telegraphing currently fashionable guesses. Twenty responses were collected:

\(f_{\rm HP}\) \(f_{\rm Life}\) \(f_{\rm Macro}\) \(f_{\rm Intel}\) \(f_{\rm Tech}\) \(L_{\rm Radio}\) \(L_{\rm Extinct}\)
0.10 0.01 0.3 0.1 0.2 1000 100000
0.10 0.70 0.01 0.6 0.001 500 10000
0.40 0.60 0.01 0.1 0.9 500 3000
0.20 0.90 0.08 0.4 0.002 500 500
0.01 0.90 0.05 0.001 0.2 1000 10000
0.01 0.1 0.1 0.01 0.001 1000 1000
0.10 0.01 0.1 0.1 0.01 100 1000
0.40 0.1 0.05 0.5 0.6 100000000 1000000
0.01 0.4 0.01 0.01 0.9 1000 10000
0.30 0.001 0.032 0.6 0.001 200 200
0.01 0.8 0.1 0.7 0.9 1000 1000
0.10 0.0001 0.01 0.001 0.02 500 150
0.10 0.2 0.1 0.01 0.1 10000 100000
0.10 0.9 0.25 0.01 0.5 10000 500000
0.30 0.001 0.01 0.6 0.9 500 3000
0.30 0.05 0.3 0.01 0.01 1000 1000
0.10 0.01 0.1 0.00001 0.00000001 300 5000
0.30 0.01 0.00001 0.01 0.0001 5000 5000
0.05 0.01 0.03 0.3 0.015 1000 150
0.02 0.01 0.1 0.01 0.001 100 100

With results:

Civilizations Currently Broadcasting in the Milky Way Galaxy
Average # 16,875
Median # 0.0016
Standard deviation 73,500
Max 337,500
Min 2.8125e-13

Civilizations Currently Present in the Milky Way Galaxy
Average # 185
Median # 0.013
Standard deviation 735
Max 3,375
Min 2.8125e-13

A smooth distribution of estimates for \(~{N}\) can be generated by drawing randomly from the list of estimates for each uncertain term in the equation, and then repeating for many estimates of \(~{N}\). Here are the histograms of estimates for the number of civilizations broadcasting from the galaxy and the number of civilizations present in the galaxy. The \(x\)-axes are \(\log_{10}N\).

Screen-Shot-2014-12-18-at-4.29.07-PM

The estimates point to the possibility that a civilization broadcasts for longer than intelligent members of the species exist. Two people implied this, by submitting values \(L_{\rm radio}>L_{\rm extinct}\). Looking at the table, there is one case where \(L_{\rm radio}\gg L_{\rm extinct} \gg \langle L \rangle\). The large values for \(L\) submitted by this person are causing the Average estimate for \(~{N}\) to substantially exceed the median estimate for \(~{N}\).

Adopting the \({ N=0.002}\) median of this distribution implies we need to look through \(\sim{n=500}\) galaxies to find the nearest broadcasting civilization, and that our nearest neighbors are \(\sim{ 8}\) Megaparsecs away. By the time one receives a message and replies to it, the intended recipient has long since gone extinct.

Rocket Summer

Screen-Shot-2014-12-13-at-12.12.56-PM

In 1997, Ray Bradbury’s The Martian Chronicles was reissued by William Morrow Press. It’s a book that’s on my shelf.

In the original edition, published in 1950, the stories were set in what is now the present day, starting with Rocket Summer, dated to January 1999, and ending with The Million Year Picnic, set in October 2026.

Screen-Shot-2014-12-13-at-12.12.27-PM

For the 1997 edition, the dates for the stories were all pushed back by thirty one years. The rocket summer still lies sixteen years in the future, but the imposed literary device seems hollow, stop-gap, ineffective. Mars of 1950 is a forever different world than Mars of today, which, satisfyingly, is also populated by two waves of explorers from Earth. Meteor-borne archeobacteria, perhaps still clinging to existence in the warmth of the deep subsurface, and a cadre of faintly autonomous, sometimes faintly anthropomorphic robots and satellites that pine eagerly for attention on social media. 2836 tweets. 1.76M followers.

Screen-Shot-2014-12-13-at-12.25.39-PM

50 oklo

Screen-Shot-2014-12-07-at-2.28.58-PM

In writing about the rise of the data centers earlier this year, I suggested the “oklo” as the cgs unit for one artificial bit operation per gram per second. That post caught the eye of the editor at Nautilus Magazine, who commissioned a longer-form article and a series of short interviews, which are on line here.

In writing the Nautilus article, it occurred to me that the qualifier “artificial” is just that: artificial. A bit operation in the service of computation should stand on its own, without precondition, and indeed, the very word oklo serves to reinforce the lack of any need to draw a distinction. The Oklo fossil reactors operated autonomously, without engineering or direction more than two billion years ago. In so doing, they blurred snap-judgment distinctions between the natural and the artificial.

Several years ago, Geoff Manaugh wrote thoughtfully about the Oklo reactors, drawing a startling connection to a passage in the second of William S. Burroughs’s cut-up novels:

I’m reminded again here of William Burroughs’s extraordinary and haunting suggestion, from his novel The Ticket That Exploded, that, beneath the surface of the earth, there is “a vast mineral consciousness near absolute zero thinking in slow formations of crystal.” Here, though, it is a mineral seam, or ribbon of heavy metal—a riff of uranium—that stirs itself awake in a regularized cycle of radiative insomnia that disguises itself as a planet. Brainrock.

Revising the definition,

1 oklo = 1 bit operation per gram of system mass per second,

brings the information processing done by life into consideration. Our planet has been heavily devoted to computation not just for the past few years, but for the past few billion years. Earth’s biosphere, when considered as a whole, constitutes a global, self-contained infrastructure for copying the digital information encoded in strands of DNA. Every time a cell divides, roughly a billion base pairs are copied, with each molecular transcription entailing the equivalent of ~10 bit operations. Using the rule of thumb that the mass of a cell is a nanogram, and an estimate that the Earth’s yearly wet biomass production is 1018 grams, this implies a biological computation of 3×1029 bit operations per second. Earth, then, runs at 50 oklo.

Using the Landauer limit, Emin=kTln2, for the minimum energy required to carry out a bit operation, the smallest amount of power required to produce 50 oklo at T=300K is ~1 GW. From an efficiency standpoint, DNA replication by the whole-Earth computer runs at about a hundred millionth of the theoretical efficiency, given the flux of energy from the Sun. The Earth and its film of cells does lots of stuff in order to support the copying of base pairs, with the net result being ~200,000 bit operations per erg of sunlight globally received.

Viewed in this somewhat autistic light, Earth is about 10x more efficient that the Tianhe-2 supercomputer, which draws 17,808KW to run at 33.8 Petaflops.