Yesterday’s post talked about how Young, Binzel and Crane (2001) used high-cadence photometric observations of Charon transiting the disk of Pluto to construct a two-color image of Pluto’s surface. Transiting extrasolar planets can be employed in a similar way to create an image of the strip of stellar surface that lies beneath the path of an occulting planetary disk. Resolution-wise, this procedure is the effective equivalent of a satellite in low-Earth orbit making a detailed image of a stripe across a sand grain sitting on the Earth’s surface.

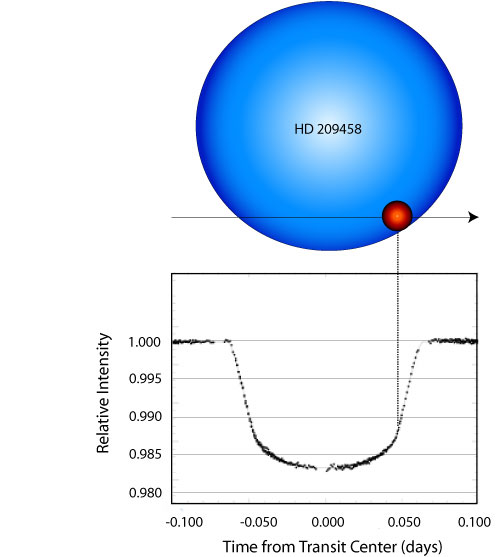
In 2001, Tim Brown and his collaborators used the STIS spectrograph on Hubble Space Telescope to obtain what has become an iconic composite light curve of the HD 209458 b transit. It’s probably fair to say that the majority of talks given by astronomers on the general topic of extrasolar planets have a powerpoint slide that shows the Brown et al. data. (The astro-ph version of their article is here).
Here’s a figure (done in Adobe Illustrator, like all of the other www.oklo.org diagrams) that shows their data:

The Brown et al. light curve contains 684 time samples spaced at an average cadence of 80 seconds with a relative precision of one part in 10,000 per photometric data point. (This photometric accuracy is easily good enough to detect the transit of an Earth-sized planet across the face of a Solar-size star if one knew when and where to look.) Because HST can only observe for about half of its 96.5 minute orbit, and because the transit lasts 184.25 minutes, the light curve was obtained by stitching together photometry from groups of observations obtained on four separate transits that took place between April 25 and May 13, 2000.
An interesting feature of the above diagram is that the transit light curve does not have a flat bottom. This results from brightness variations on the surface of the star itself. Stellar disks display a phenomenon known as limb darkening. If you can resolve a star (as one effectively does when one obtains a photometric light curve of a transit) you see that the center of the stellar disk is brighter than the edges. This effect occurs because when one looks at the stellar limb, the line of sight samples higher, cooler layers of the stellar atmosphere. When one looks straight at the middle of the star, one is seeing further in, to deeper, hotter layers. For a star like the Sun or HD 209458, this effect is quite significant. The intensity at the limb is only about 40% as much as that at the center of the stellar disk. The curved bottom of the time-series, then, could be inverted and processed to construct an image of the surface of the star beneath the planet. Additionally, if the transit is observed through different color filters, then one can build a colored image of the stellar strip.
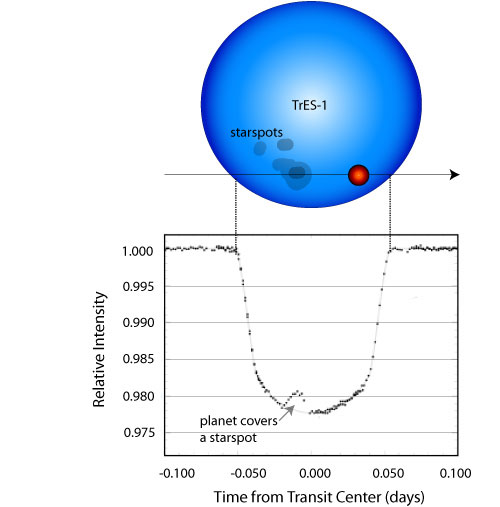
More recently, Brown and Company have made similar HST observations of the TrES-1 transit. Their light curve in this case shows a bizarre uptick, which causes the transit to resemble a one-toothed grin:

The interpretation of this feature is that the planet covered up a starspot as it traversed the face of the star. Starspots — that is, sunspots on other stars — are cooler, and hence dimmer than their surroundings. When a starspot is occulted by the planet, the fraction of blocked starlight decreases. Photometric light curves really do give us an image of a strip of the stellar surface.
For those who prefer not to shave with Ockham’s razor, there’s a second, rather more exotic interpretation of the TrES-1 transit light curve. It’s possible (although highly unlikely!) that a second, longer-period, planet was also transiting TrES-1 at the time when the uptick in the light curve was recorded, and that the inner (known) planet happened to pass underneath the outer planet, as seen from Earth. According to Tim Brown (during a talk I heard him give in Japan) this model, while crazy, does just as good a job of fitting the photometric data!
TrES-1 is an 11.8 magnitude star, and the transits are thus highly suitable for measurement by amateur astronomers using the technique of differential aperture photometry. On the transitsearch.org website, there’s an extensive discussion of amateur observations that were made in the months following the discovery of the transit by Alonso et al. Many of these amateur light curves show strange asymmetric features. It’s likely that they were also observing the planet crossing over starspots. If this was indeed the case, then the 2-planet interpretation of the “tooth” can be safely ruled out.
I should emphasize that transit observations using HST are of blockbuster-level scientific value. The exquisite HST photometry allows a very accurate measurement of the planetary radius, which in turn puts strong constraints on our theoretical models of the planetary interior (see this post for more information). The transit also strongly constrains the elements of the planetary orbit, and the color-dependence of the light curves permits the measurement of atmospheric constituents such as sodium and carbon monoxide.
The above diagram for the TrES-1 transits is adapted from a review article entitled, When Extrasolar Planets Transit their Parent Stars that I co-authored with Dave Charbonneau (Harvard University), Tim Brown (The High Altitude Observatory), and Adam Burrows (The University of Arizona). It will be published in the forthcoming Protostars and Planets V Conference Proceedings.
Here at www.oklo.org we strive to keep things on the positive tip, but I do have one disappointing piece of news to report. I was a Co-I on Tim Brown’s recent HST Cycle 15 proposal to obtain a high-precision photometric time series of the HD 149026 b transit. The resulting light curve would have had higher photometric precision than both the TrES-1 and HD 209458 b time series shown above. The light curve would have had a higher cadence, the individual points would have been good to about one part in 20,000. (At magnitude 8.16, HD 149026 is about thirty times brighter than TrES-1, and the new ACS camera on HSTT is better-suited to the photometric transit-measurements that the defunct STIS spectrograph that was used by Brown et al. for HD 209458). Unfortunately, we learned yesterday that the proposal was not accepted. This is a bummer. An HST transit light curve would have dramatically improved our characterization of the planet that has already provided the first incontrovertible evidence for the core-accretion mechanism of giant planet formation. I think that the HD 149026 light curve would likely have been as informative as the Brown et al. HD 209458 light curve, which was recently shown as #4 in the list of Hubble’s top ten scientific achievements.

Pingback: systemic - Varkaus
Pingback: systemic - TrES-2
Pingback: systemic - hot and bothered
Pingback: Planethunters: Planetary transit depths « The Lair of Evil Dr. Ganymede