

As I’ve mentioned earlier, Jean Schneider’s authoritative Extrasolar Planets Encyclopedia has introduced a slick .php-based approach that’s keeping the systemic team on their toes. At Schneider’s site, one can interactively produce correlation diagrams for the known extrasolar planets. As more planets are discovered, these diagrams (for example the a-e plot and the Msin(i)-a plot) are beginning to show a fascinating richness of detail.
The inclusion of date of discovery as one of the plottable parameters attracted my attention.
For example, a plot of the Log of the planetary period versus discovery date shows hints of interesting structure:
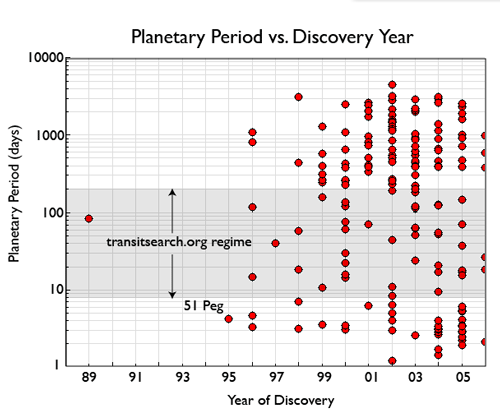
Over the past few years, the majority of newly detected planets can be divided into a population with P<10 days (the hot Jupiters), and a population with P>200 days (the eccentric giants). There is a statistically significant gap in the period distribution in the intermediate-period regime. This gap tells us something significant about the planet formation process. My interpretation is that the migration process is not readily halted until a planet reaches the region of the disk where the dyanamics of the protostellar disk gas are subject to the laws of ideal MHD. More on that later.
From a more practical standpoint, the paucity of intermediate period planets has made it tough going for the transitsearch.org collaboration. When planetary periods are less than about 10 days, the discovery team is usually able to complete a photometric search for transits before the planet is publicly announced. When a planetary period exceeds 200 days, it’s generally hopeless to mount an exhaustive transit search, even with a distributed network.
You’ll get another very interesting diagram if you plot the Log of the planetary mass as a function of discovery date. As usual, I’ve redone the axes and annotations with Adobe Illustrator to get that familiar oklo.org look-n-feel:
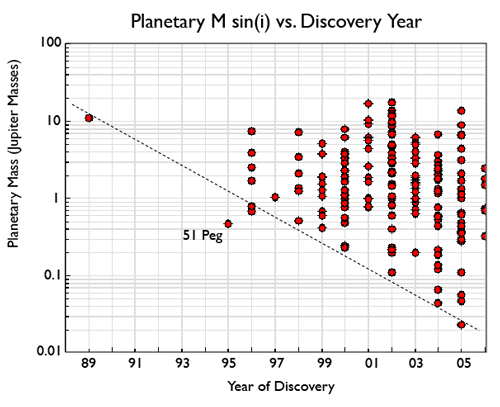
In this log-linear space, the lower envelope of detected planet mass is a linear function of time. This allows for an easy extrapolation to estimate the discovery date of the first Earth-mass planet orbiting a nearby main-sequence star…
Pingback: systemic - Noise Floor