lightspeed

Screen-Shot-2015-01-01-at-1.21.48-PM

Aon Tower, as seen from Lurie Garden in Millennium Park

Millennium Park in Chicago is a remarkable place. Skyscrapers shoulder together and soar up steeply to the north and to the west. The vertiginous effect of their cliff faces is reminiscent of Yosemite Valley.

Lurie Garden is at the center of the park, and is given over largely to native plants that carpeted the Illinois landscape in the interval between the retreat of the glaciers and the advance of the corn fields. In the silence of a photograph with a narrow field of view, it is as if the city never existed.

Screen-Shot-2015-01-01-at-4.47.48-PM

Lurie Garden

Restore the sound, and the the buzz and hum of insects are superimposed on the wash of urban noise. A swarm of bees, algorithmic in their efficiency, and attuned to the flowers’ black light glow, collect the nectar. 55% sucrose, 24% glucose and 21% fructose.

When viewed in microwaves and millimeter waves, say from 1 to 100 GHz, the Millennium Park scene displays a similarly jarring juxtaposition. The sky glows with the ancient three degree background radiation — the cosmic static of the Big Bang explosion — subtly brightest in the direction of the Virgo Supercluster. All around, the buildings, the roads and the sidewalks are lit up with manically pulsating wireless transmitters: routers, cell phones, myriad sensors. In highly focused 6 GHz and 11 GHz beams, billions of dollars in coded securities orders streak above the urban canyons on line-of-sight paths linking the data centers of Chicago, Aurora, and suburban New Jersey. The fastest path of all runs through the top of the monolithic Aon Tower, where the signal is amplified and launched onward across the Lake and far into Michigan.

The microwave beams are a new development. In mid-2010, price movements at the Chicago Mercantile Exchange generated reactions in New Jersey nine milliseconds later. The signals traveled on fiber optic cables that meandered along railroad rights-of-way.

stockResponse2010

Now, the messages arrive within a few microseconds of the time it would take light to travel in vacuum, galvanizing the swarm of algorithms that are continually jostling and buzzing in the vicinity of the match.

stockResponse2013

Angular Power Spectra

Screen-Shot-2014-12-28-at-10.24.18-PM

It’s worth a scramble to get a window seat on a Hawaiian inter-island flight. The views are full of craggy green cliffs, porcelain ocean, and wispy masses of fog and cloud. Sometimes, several islands are visible at once, and it’s not hard to imagine that the archipelago might extend over the entire globe.

That would be a very different planet, and, in fact, a world covered by hotspot volcanoes might have a surface elevation profile somewhat reminiscent of the WMAP image of the temperature fluctuations in the cosmic microwave background. The WMAP image brings to mind a planet covered in Hawaiian islands.

Screen-Shot-2014-12-28-at-10.36.31-PM

Any distribution, \(f(\theta,\phi)\), on the surface of a sphere, be it of temperature, or elevation, or the density of IP addresses, can be expressed as a weighted sum of spherical harmonics

$$f(\theta,\phi)=\sum_{l,m} a_{l,m} Y(\theta,\phi)_{l}^{m}\, ,$$
where the coefficients corresponding to the individual weights, \(a_{l,m}\) are given by
$$a_{l,m}=\int_{\Omega}f(\theta,\phi)Y(\theta,\phi)_{l}^{m \star}d\Omega\, ,$$
and the power, \(C_{l}\) at angular scale \(l\) is
$$C_{l}=\frac{1}{2l+1}\sum_{m=-l}^{l}a_{l,m} {a_{l,m}}^{\star}\, .$$

The power spectrum of the CMB anisotropies peaks at \(l\sim 200\), which corresponds to an angular scale on the sky of \(\Delta \theta \sim 1^{\circ}\), which is very close to the solid angle subtended by the Big Island of Hawaii on the surface of the spherical Earth.

Here’s a recent version of the CMB temperature anisotropy spectrum from the Planck Mission website

Screen-Shot-2014-12-29-at-9.24.16-AM

The peaks in the spectrum of CMB temperature anisotropies stem from acoustic oscillations and diffusion damping in the early universe, and they encode all sorts of information about the fundamental cosmological parameters. This, of course, is very well-known stuff: a search on all literature in the ADS database published since 2000, and ranked by citations, lists Spergel et al. 2003, First-Year Wilkinson Microwave Anisotropy Probe (WMAP) Observations: Determination of Cosmological Parameters at #1, with 7,914 citations and (rapidly) counting.

Given the similarity between the angular scales of the Hawaiian islands and the main CMB peak, it’s interesting to compute the angular power spectrum of Earth’s bedrock elevation profile. A global relief dataset with one arc-minute resolution is available from NOAA as a 4GB (uncompressed) file. Downsampling by a factor of 100, and applying the “terrain” color map yields a familiar scene

Screen-Shot-2014-12-29-at-10.33.14-AM

Computing the power in the first 108 angular modes of the relief distribution in the above data set gives a spectrum that is weighted toward continents and ocean basins rather than archipelagos. There is a pronounced peak at \(l=5\) that reflects the typical angular scale of continents and ocean basins.

figureAng_1

Here is the global relief distribution obtained by summing just the \(l=5\) contributions. It’s right for more or less the same reason that Crates of Mallus was right:

Screen-Shot-2015-01-01-at-6.06.04-PM

Using all 108 angular mode families to reconstruct the image gives a fairly credible-looking world map. It’s as if the watercolors ran slightly before they dried. Most critically, the \(l=108\) reconstruction fails to capture the highest peaks and the lowest ocean trenches, and hence more of the dynamic range of the color map is distributed across the globe.

Screen-Shot-2014-12-31-at-6.06.04-PM

Degree-wide islands like Hawaii are the exception rather than the rule on Earth’s surface. I believe that this was the concept that former US Vice President Dan Qualye was struggling to express in one of his much-ridiculed pronouncements:

Hawaii has always been a very pivotal role in the Pacific. It is IN the Pacific. It is a part of the United States that is an island that is right here.

(See also his comments on Mars.)

Skyscraper

Screen-Shot-2014-12-18-at-4.29.07-PM

A few weeks ago, I had a flight out of LaGuardia Airport in New York City. On the drive there, I caught a distant glimpse of the Manhattan skyline. I was startled to see that it is newly altered. Rising from midtown was a silhouette that seemed both impossibly narrow, and taller than any other skyscraper in the far-off cut-out.

Photo Credit: 432 Park Avenue -- processed screenshot

Original Photo: 432parkavenue.com — Photoshop processed screenshot

The Internet, of course, has the story. 432 Park Avenue — $1.25B, 426 meters, the highest rooftop in the city. Many of its floors, especially the higher ones, are monolithic residences, in the process of acquisition by opaque, limited liability corporations, “bank safe deposit boxes in the sky that buyers can put their valuables in and rarely visit.”

Often, the aesthetic informing such projects veers toward the rococo, but 432 Park is minimalist to the core. Every window of the tower is an exact 10 foot by 10 foot square. From the elaborate on-line galleries, it wholly ambiguous whether the surreal bone-parchment interiors already exist or whether they are virtual. Somewhere, in micrometric accuracies of the digital architectural model, lies the pattern of the seasons, the moment of the equinox, the precise angle of sunlight shafting into the cavernous, unvisited, perhaps as-yet unconstructed rooms.

Like the pyramids at Giza — after they were sealed and before they were robbed.

Dead voices on air

Screen-Shot-2014-12-17-at-10.04.00-PM

This Fall quarter, I taught a class for undergraduates on order-of-magnitude estimation in physics with a focus on astronomical examples. And on the last day of class, with final exams looming, what could be better that the time-tested stress relievers provided by the Fermi Paradox and the Drake Equation?

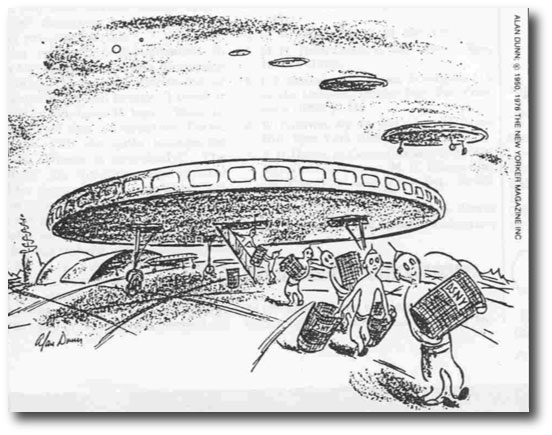
In Los Alamos National Laboratory publication LA-103110MS, “Where is Everybody?” An Account of Fermi’s Question, Eric Jones describes how Enrico Fermi, Emil Konopinski, Edward Teller, and Herbert York were diverted into their famous lunch-time conversation in the summer of 1950. While walking to the cafeteria, they were discussing news reports of UFOs, and an associated New Yorker cartoon that explained why the public trash cans in New York City were disappearing.

Screen-Shot-2014-12-18-at-8.01.51-AM

The flying saucers of the early 1950s hold a special fascination. A compound of Cold War anxieties — nuclear weapons, communists, infiltrators — they are silvery and remote, icons of minimalist design from a time when the space age was truly, rather than retro- futuristic.

Indeed, much of my own interest in astronomy can be traced to 50’s-era flying saucers. In the Bicentennial summer of 1976, after finishing third grade, I got a paper route delivering the Champaign-Urbana Courier. One of my customers, Mrs. Barbara Houseworth, had a garage full of cast-off books that she collected for an annual drive. I spent a great deal of time examining them whenever I visited to collect the subscription fee. I was particularly drawn to the pulpy paperback books — especially the ones with clay-coated photographic inserts — that covered the Bermuda Triangle, Bigfoot, the Loch Ness Monster, and Flying Saucers. All matters that seemed to merit the most urgent scientific concern.

Screen-Shot-2014-12-18-at-10.57.41-AM

At the top of my list was Gray Barker’s They Knew Too Much About Flying Saucers, published in 1956. I was so taken with it that Mrs. Houseworth simply gave me the book.

FullSizeRender

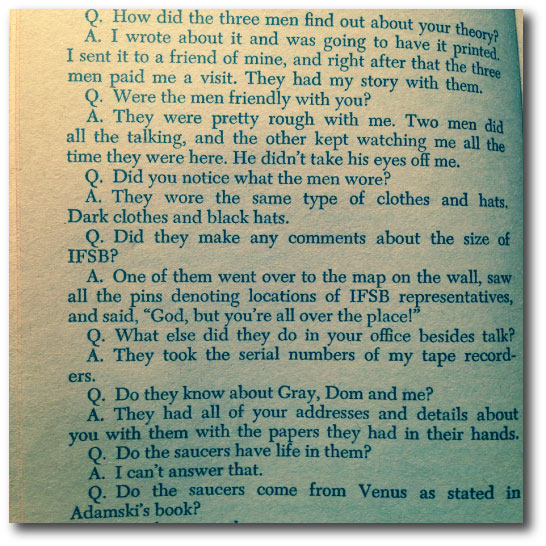
Gray Barker was an intriguing character, a closeted gay man in mid-century West Virginia who took a certain delight in channeling the fears and neuroses of the American masses into money-making volumes. Barker’s invention of the three men in dark suits, in particular, achieved a lasting cultural resonance. There is more about him at the UWV Center for Literary Computing, and he is the subject of several recent documentaries.

saucerfilmstills

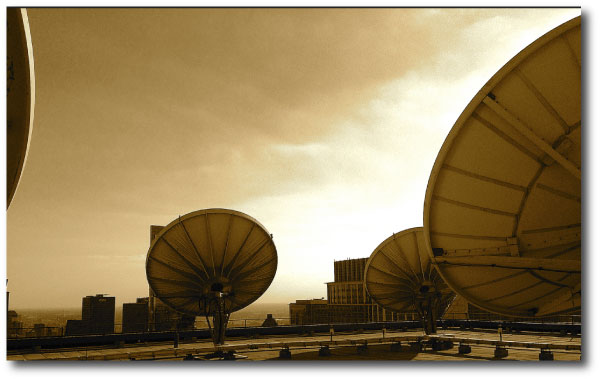
The message in the Cold War flying saucer books was crystal clear. Watch the Skies. And I did — on many clear dark Central Illinois nights with a Sears catalog 50mm refracting telescope…

Back to Friday’s class. We adopted the following form for the Fermi-Drake equation
$${N} = \Lambda ~f_{\star \rm{app}}~f_{\rm pl}~f_{\rm quqHP}~f_{\rm life}~f_{\rm macro}~f_{\rm intel}~f_{\rm tech}~L\,,$$
where \(N\) is the number of broadcasting civilizations in the galaxy, \(\Lambda\) is the number of stars formed per year in the Milky Way, \(f_{\star \rm{app}}\) is the fraction of stars with main sequence lifetimes long enough to support the development of a broadcasting civilization, \(~f_{\rm pl}\) is the fraction of stars with planets, \(~f_{\rm HP}\) is the average number of “habitable” planets per star, \(~f_{\rm life}\) is the fraction of these habitable planets that develop life, \(~f_{\rm macro}\) is the fraction of life-bearing planets that develop macroscopic life, \(~f_{\rm intel}\) is the fraction of macroscopic life-bearing planets that develop an “intelligent” life form (e.g. one that can orient itself abstractly in time), \(~f_{\rm tech}\) is the fraction of intelligent species that develop an understanding of the Maxwell Equations and build radios, and \(L\) is the civilization lifetime in years.

We defined and estimated two versions of \(L\). \(L_{\rm radio}\) is the average length of a time that a civilization leaks modulated electromagnetic signals into space. \(L_{\rm extinct}\) is the lifetime of the civilization, marked from the understanding of Maxwell’s equations to the point where the equations are collectively no longer understood.

The first few terms in the equation have been elevated from the realm of science fiction. I’ve adopted values of \(~\Lambda=10\,{\rm stars~yr^{-1}}\), \(~f_{\star \rm{app}}=0.75\), and \(~f_{\rm pl}=0.75\). Note that \(~\Lambda=10\,{\rm stars~yr^{-1}}\) is admittedly on the high side, even for 4.5 Gyr ago when star formation was somewhat more prevelant in the Galaxy.

Here is the table of values for the unknown terms, as estimated by the class members. I tried not to influence the results by telegraphing currently fashionable guesses. Twenty responses were collected:

\(f_{\rm HP}\) \(f_{\rm Life}\) \(f_{\rm Macro}\) \(f_{\rm Intel}\) \(f_{\rm Tech}\) \(L_{\rm Radio}\) \(L_{\rm Extinct}\)
0.10 0.01 0.3 0.1 0.2 1000 100000
0.10 0.70 0.01 0.6 0.001 500 10000
0.40 0.60 0.01 0.1 0.9 500 3000
0.20 0.90 0.08 0.4 0.002 500 500
0.01 0.90 0.05 0.001 0.2 1000 10000
0.01 0.1 0.1 0.01 0.001 1000 1000
0.10 0.01 0.1 0.1 0.01 100 1000
0.40 0.1 0.05 0.5 0.6 100000000 1000000
0.01 0.4 0.01 0.01 0.9 1000 10000
0.30 0.001 0.032 0.6 0.001 200 200
0.01 0.8 0.1 0.7 0.9 1000 1000
0.10 0.0001 0.01 0.001 0.02 500 150
0.10 0.2 0.1 0.01 0.1 10000 100000
0.10 0.9 0.25 0.01 0.5 10000 500000
0.30 0.001 0.01 0.6 0.9 500 3000
0.30 0.05 0.3 0.01 0.01 1000 1000
0.10 0.01 0.1 0.00001 0.00000001 300 5000
0.30 0.01 0.00001 0.01 0.0001 5000 5000
0.05 0.01 0.03 0.3 0.015 1000 150
0.02 0.01 0.1 0.01 0.001 100 100

With results:

Civilizations Currently Broadcasting in the Milky Way Galaxy
Average # 16,875
Median # 0.0016
Standard deviation 73,500
Max 337,500
Min 2.8125e-13

Civilizations Currently Present in the Milky Way Galaxy
Average # 185
Median # 0.013
Standard deviation 735
Max 3,375
Min 2.8125e-13

A smooth distribution of estimates for \(~{N}\) can be generated by drawing randomly from the list of estimates for each uncertain term in the equation, and then repeating for many estimates of \(~{N}\). Here are the histograms of estimates for the number of civilizations broadcasting from the galaxy and the number of civilizations present in the galaxy. The \(x\)-axes are \(\log_{10}N\).

Screen-Shot-2014-12-18-at-4.29.07-PM

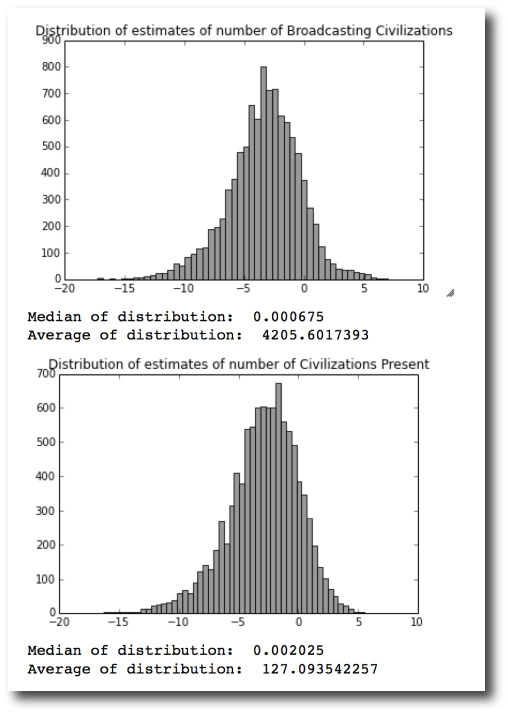
The estimates point to the possibility that a civilization broadcasts for longer than intelligent members of the species exist. Two people implied this, by submitting values \(L_{\rm radio}>L_{\rm extinct}\). Looking at the table, there is one case where \(L_{\rm radio}\gg L_{\rm extinct} \gg \langle L \rangle\). The large values for \(L\) submitted by this person are causing the Average estimate for \(~{N}\) to substantially exceed the median estimate for \(~{N}\).

Adopting the \({ N=0.002}\) median of this distribution implies we need to look through \(\sim{n=500}\) galaxies to find the nearest broadcasting civilization, and that our nearest neighbors are \(\sim{ 8}\) Megaparsecs away. By the time one receives a message and replies to it, the intended recipient has long since gone extinct.

Rocket Summer

Screen-Shot-2014-12-13-at-12.12.56-PM

In 1997, Ray Bradbury’s The Martian Chronicles was reissued by William Morrow Press. It’s a book that’s on my shelf.

In the original edition, published in 1950, the stories were set in what is now the present day, starting with Rocket Summer, dated to January 1999, and ending with The Million Year Picnic, set in October 2026.

Screen-Shot-2014-12-13-at-12.12.27-PM

For the 1997 edition, the dates for the stories were all pushed back by thirty one years. The rocket summer still lies sixteen years in the future, but the imposed literary device seems hollow, stop-gap, ineffective. Mars of 1950 is a forever different world than Mars of today, which, satisfyingly, is also populated by two waves of explorers from Earth. Meteor-borne archeobacteria, perhaps still clinging to existence in the warmth of the deep subsurface, and a cadre of faintly autonomous, sometimes faintly anthropomorphic robots and satellites that pine eagerly for attention on social media. 2836 tweets. 1.76M followers.

Screen-Shot-2014-12-13-at-12.25.39-PM

50 oklo

Screen-Shot-2014-12-07-at-2.28.58-PM

In writing about the rise of the data centers earlier this year, I suggested the “oklo” as the cgs unit for one artificial bit operation per gram per second. That post caught the eye of the editor at Nautilus Magazine, who commissioned a longer-form article and a series of short interviews, which are on line here.

In writing the Nautilus article, it occurred to me that the qualifier “artificial” is just that: artificial. A bit operation in the service of computation should stand on its own, without precondition, and indeed, the very word oklo serves to reinforce the lack of any need to draw a distinction. The Oklo fossil reactors operated autonomously, without engineering or direction more than two billion years ago. In so doing, they blurred snap-judgment distinctions between the natural and the artificial.

Several years ago, Geoff Manaugh wrote thoughtfully about the Oklo reactors, drawing a startling connection to a passage in the second of William S. Burroughs’s cut-up novels:

I’m reminded again here of William Burroughs’s extraordinary and haunting suggestion, from his novel The Ticket That Exploded, that, beneath the surface of the earth, there is “a vast mineral consciousness near absolute zero thinking in slow formations of crystal.” Here, though, it is a mineral seam, or ribbon of heavy metal—a riff of uranium—that stirs itself awake in a regularized cycle of radiative insomnia that disguises itself as a planet. Brainrock.

Revising the definition,

1 oklo = 1 bit operation per gram of system mass per second,

brings the information processing done by life into consideration. Our planet has been heavily devoted to computation not just for the past few years, but for the past few billion years. Earth’s biosphere, when considered as a whole, constitutes a global, self-contained infrastructure for copying the digital information encoded in strands of DNA. Every time a cell divides, roughly a billion base pairs are copied, with each molecular transcription entailing the equivalent of ~10 bit operations. Using the rule of thumb that the mass of a cell is a nanogram, and an estimate that the Earth’s yearly wet biomass production is 1018 grams, this implies a biological computation of 3×1029 bit operations per second. Earth, then, runs at 50 oklo.

Using the Landauer limit, Emin=kTln2, for the minimum energy required to carry out a bit operation, the smallest amount of power required to produce 50 oklo at T=300K is ~1 GW. From an efficiency standpoint, DNA replication by the whole-Earth computer runs at about a hundred millionth of the theoretical efficiency, given the flux of energy from the Sun. The Earth and its film of cells does lots of stuff in order to support the copying of base pairs, with the net result being ~200,000 bit operations per erg of sunlight globally received.

Viewed in this somewhat autistic light, Earth is about 10x more efficient that the Tianhe-2 supercomputer, which draws 17,808KW to run at 33.8 Petaflops.


optical data transmissions

Screen-Shot-2014-11-28-at-6.24.11-PM

The amount of information that can be carried on a laser diode-driven fiber optic cable is staggering. The current state-of-the-art is of order a petabit per second over 50 km, with a direct power consumption of order 100 milliwatts, as described in this press release from NTT, and in primers on optical communication.

When data is transmitted via optical fiber, no signal leaks into space at all (other than a trivial quantity of waste heat). From the standpoint of eavesdropping civilizations, Earth is going dark, presenting a fashionable and much-remarked potential solution to the Fermi Paradox.

To order of magnitude, fiber optic cables currently employ 10^-16 ergs to transmit one bit of information over a distance of one centimeter. It’s interesting to compare this with the energy throughput and transmission efficiency of the first recorded description of an optical information transmission network.

In The Information — A History  A Theory A Flood, James Gleick draws attention to a passage that appears in Aeschylus’ Agammemon describing how a chain of eight signal bonfires transmitted the news of Trojan defeat over the course of a single night to Clytemnestra, scheming, four hundred miles away in Sparta.

Aeschylus’ full passage is worth tracking down and is thrilling to read; a satisfyingly direct antecedent to NTT’s press release describing their record-setting petabyte per second optical data transmissions.

LEADER:

Yet who so swift could speed the message here?

CLYTEMNESTRA:

From Ida’s top Hephaestus, lord of fire,
Sent forth his sign; and on, and ever on,
Beacon to beacon sped the courier-flame.
From Ida to the crag, that Hermes loves,
Of Lemnos; thence unto the steep sublime
Of Athos, throne of Zeus, the broad blaze flared.
Thence, raised aloft to shoot across the sea,
The moving light, rejoicing in its strength,
Sped from the pyre of pine, and urged its way,
In golden glory, like some strange new sun,
Onward, and reached Macistus’ watching heights.
There, with no dull delay nor heedless sleep,
The watcher sped the tidings on in turn,
Until the guard upon Messapius’ peak
Saw the far flame gleam on Euripus’ tide,
And from the high-piled heap of withered furze
Lit the new sign and bade the message on.
Then the strong light, far-flown and yet undimmed,
Shot thro’ the sky above Asopus’ plain,
Bright as the moon, and on Cithaeron’s crag
Aroused another watch of flying fire.
And there the sentinels no whit disowned,
But sent redoubled on, the hest of flame
Swift shot the light, above Gorgopis’ bay,
To Aegiplanctus’ mount, and bade the peak
Fail not the onward ordinance of fire.
And like a long beard streaming in the wind,
Full-fed with fuel, roared and rose the blaze,
And onward flaring, gleamed above the cape,
Beneath which shimmers the Saronic bay,
And thence leapt light unto Arachne’s peak,
The mountain watch that looks upon our town.
Thence to th’ Atreides’ roof-in lineage fair,
A bright posterity of Ida’s fire.
So sped from stage to stage, fulfilled in turn,
Flame after flame, along the course ordained,
And lo! the last to speed upon its way
Sights the end first, and glows unto the goal.
And Troy is ta’en, and by this sign my lord
Tells me the tale, and ye have learned my word.

Given that the message was one bit, the signal coding was at the Shannon Limit. The route can be correlated with current-day geographic features,

Screen-Shot-2014-11-28-at-6.18.03-PM

and then traced out in Google Earth:

Screen-Shot-2014-11-28-at-6.17.44-PM


The bonfire on Mt. Ida that signaled the end of the Trojan War probably consumed about a cord (3.62 cubic meters) of wood and emitted about 5×10^12 ergs/sec over a span of an hour, for a transmission efficiency of order 10^9 ergs per centimeter per bit. A mere three thousand years has brought twenty five orders of magnitude of improvement.

With the take-away being that the quality of the message is likely superior in importance to the quantity.

Brown Dwarfs

BD

The layout of the solar system is at least moderately atypical. There should be roughly four Earth masses worth of planets inside Mercury’s orbit. And Jupiter, with its large mass, its close-to-circular orbit, and its 10+ year period is an oddball at the 10% (and probably more impressive) level.

At the start of the 1990s, the narrative for how the future, futuristic discovery of extrasolar planets would unfold was informed by the contents of the solar system. I was supposed to be doing my thesis work on modeling the infrared spectra of protostars. But somehow, L1551, and its spartan low-res spectrum, seemed dull and unappealing and far away from any every-day concern. Then, as now, the evolution of protostellar disks sternly needed to be understood. Look at the first page of any review article on protostellar disks from two decades ago. Save the references, it could be employed in almost unaltered form today. I avoided walking past my adviser’s door due to my creeping, near-complete lack of any progress.

At that time, Doppler velocity measurements and astrometry were scheduled to gradually improve to the point where the orbital influences of Jupiter’s extrasolar analogs would eventually become apparent, and that time lay hazily in the future. Brown dwarfs (of which no airtight examples were known) were a way station for the impatient. There seemed something electrifying about the possibility that a dim failed star might be drifting by, just few light years away. I decided to drop the the disk spectra. All at once, I felt energized and engaged. Soon, we had a paper submitted. It was neither a memorable nor an important contribution, but it was the product of a genuine curiosity and focused effort. The upshot of lots of modeling and evolutionary calculations and hand-wringing and earnest e-mails was that “our work affirms the likelihood that the stellar mass function in the solar neighborhood is increasing at masses near the bottom of the main sequence and perhaps at lower masses”. More to the point, the best, wholly uncontroversial guess was that there would end up being about 10 brown dwarfs within 5 parsecs.

In late 1995, 51 Peg b somehow short-circuited the brown dwarfs’ front-row mystique. As the extrasolar planet count mounted, I paid little (or sometimes no) attention to the steady accumulation of discoveries within the Sun’s immediate 5-parsec environs.

Last week, while preparing for my class on order-of-magnitude estimation, I looked at Wikipedia’s list of nearest stars and brown dwarfs. I was surprised to realize that there are now thirteen brown dwarfs and counting within five parsecs, several more than we had guessed back in 1992. I was particularly startled by WISE 0855-0714, which was discovered just this year by Kevin Luhman. It is precisely the object whose prospect seemed so exciting half a lifetime ago. One percent the mass of the Sun. Photosphere plunged into icy deep freeze. Utterly black to the eye, save the occasional faint crackling glow of lightning from deep within.

photographic

Screen-Shot-2014-04-17-at-6.59.14-PM

Kepler 168f has been the subject of substantial media coverage over the past week. This newly confirmed planet orbits a red dwarf with roughly half the mass and radius of the Sun, receives about 27% of the insolation that the Earth receives, and, assuming that it has a terrestrial density, is about 40 to 50% more massive than Earth. On the oklo.org exoplanet valuation scale, designed in 2009 to make objective comparisons between potentially habitable planets, Kepler 186f would buy a round-trip ticket to Newark, clocking in at a respectable $655.

The accompanying image of this planet, however, is absolutely stunning. I stared at it for a long time, tracing the outlines of the oceans and the continents, surface detail vivid in the mind’s eye. Yes, ice sheets hold the northern regions of Kepler 186f in an iron, frigid grip, but in the sunny equatorial archipelago, concerns of global warming are far away. Waves lap halcyon shores drenched in light like liquid gold.

It’s interesting to look at the New York Times articles on habitable planets that have been published over the past century.

The first mentions are generally associated with reports of stern public talks given by prominent astronomers. For example, this news item, from 1931, is full of shaky typography and unfounded speculations, but it has no illustrations, and is clear up front, furthermore, that pictures are not available.

russellLectureNYT

The first actual habitable exoplanet discovery reported by the New York Times was Gliese 581c back in ’07. The press release image for this one looks downright amateurish in comparison to Kepler-168. The lighting, the perspective, and the geometry are all woefully off. The star looks like a traffic stoplight, “red to be exact”.

Screen-Shot-2014-04-19-at-3.59.27-PM

By 2010, front-page-news-making habitable planets still tended to be hand-drawn, but they were beginning to show a few signs of life:
Screen-Shot-2014-04-17-at-9.23.10-PM

A big step forward came in 2011, with this lil’ “Goldilocks” (feat. HD 85512b):

Screen-Shot-2014-04-17-at-9.22.00-PM

I think this was the first NYT-published image of a newly discovered habitable planet that could be misconstrued as a photograph by a reasonable person who did not read the fine print, or who perhaps did not even notice the fine print on the tiny screen of a mobile device on the bus to work.

Super Planet Crush Crash

Screen-Shot-2014-04-08-at-10.31.16-AM

The Crash at Crush is a perennial go-to narrative in the long-running effort to goad disinterested students into obtaining a much-needed grasp of the the principles of classical mechanics.

From the Wikipedia:

Crush, Texas, was a temporary “city” established as a one-day publicity stunt in 1896. William George Crush, general passenger agent of the Missouri-Kansas-Texas Railroad (popularly known as the Katy), conceived the idea to demonstrate a train wreck as a spectacle. No admission was charged, and train fares to the crash site were at the reduced rate of US$2 from any location in Texas. As a result about 40,000 people showed up on September 15, 1896, making the new town of Crush, Texas, temporarily the second-largest city in the state.

It seems that William George Crush either failed (or more likely never enrolled) in Physics 101. The energy released from the impact of the trains and the explosion of their boilers led to several deaths and many injuries among the 40,000 spectators.

Fast-forwarding 118 years, we find that Stefano “Doc” Meschiari, another Texas entrepreneur, has once again harnessed physics in the name of spectacle with his browser-based video game Super Planet Crash. (Name changed at the last moment from Super Planet Crush in order to duck potential legal challenges from the recently IPO’d purveyors of Candy Crush).

In the time-honored tradition of stoking publicity, a press release was just issued:

April 7, 2014
Contact: Tim Stephens (831) 459-2495; stephens@ucsc.edu

Orbital physics is child’s play with Super Planet Crash

A new game and online educational resources are offshoots of the open-source software package astronomers use to find planets beyond our solar system

For Immediate Release

SANTA CRUZ, CA–Super Planet Crash is a pretty simple game: players build their own planetary system, putting planets into orbit around a star and racking up points until they add a planet that destabilizes the whole system. Beneath the surface, however, this addictive little game is driven by highly sophisticated software code that astronomers use to find planets beyond our solar system (called exoplanets).

The release of Super Planet Crash (available online at www.stefanom.org/spc) follows the release of the latest version of Systemic Console, a scientific software package used to pull planet discoveries out of the reams of data acquired by telescopes such as the Automated Planet Finder (APF) at the University of California’s Lick Observatory. Developed at UC Santa Cruz, the Systemic Console is integrated into the workflow of the APF, and is also widely used by astronomers to analyze data from other telescopes.

Greg Laughlin, professor and chair of astronomy and astrophysics at UC Santa Cruz, developed Systemic Console with his students, primarily Stefano Meschiari (now a postdoctoral fellow at the University of Texas, Austin). Meschiari did the bulk of the work on the new version, Systemic 2, as a graduate student at UC Santa Cruz. He also used the Systemic code as a foundation to create not only Super Planet Crash but also an online web application (Systemic Live) for educational use.

“Systemic Console is open-source software that we’ve made available for other scientists to use. But we also wanted to create a portal for students and teachers so that anyone can use it,” Laughlin said. “For the online version, Stefano tuned the software to make it more accessible, and then he went even further with Super Planet Crash, which makes the ideas behind planetary systems accessible at the most visceral level.”

Meschiari said he’s seen people quickly get hooked on playing the game. “It doesn’t take long for them to understand what’s going on with the orbital dynamics,” he said.

The educational program, Systemic Live, provides simplified tools that students can use to analyze real data. “Students get a taste of what the real process of exoplanet discovery is like, using the same tools scientists use,” Meschiari said.

The previous version of Systemic was already being used in physics and astronomy classes at UCSC, Columbia University, the Massachusetts Institute of Technology (MIT), and elsewhere, and it was the basis for an MIT Educational Studies program for high school teachers. The new online version has earned raves from professors who are using it.

“The online Systemic Console is a real gift to the community,” said Debra Fischer, professor of astronomy at Yale University. “I use this site to train both undergraduate and graduate students–they love the power of this program.”

Planet hunters use several kinds of data to find planets around other stars. Very few exoplanets have been detected by direct imaging because planets don’t produce their own light and are usually hidden in the glare of a bright star. A widely used method for exoplanet discovery, known as the radial velocity method, measures the tiny wobble induced in a star by the gravitational tug of an orbiting planet. Motion of the star is detected as shifts in the stellar spectrum–the different wavelengths of starlight measured by a sensitive spectrometer, such as the APF’s Levy Spectrometer. Scientists can derive a planet’s mass and orbit from radial velocity data.

Another method detects planets that pass in front of their parent star, causing a slight dip in the brightness of the star. Known as the transit method, this approach can determine the size and orbit of the planet.

Both of these methods rely on repeated observations of periodic variations in starlight. When multiple planets orbit the same star, the variations in brightness or radial velocity are very complex. Systemic Console is designed to help scientists explore and analyze this type of data. It can combine data from different telescopes, and even different types of data if both radial velocity and transit data are available for the same star. Systemic includes a large array of tools for deriving the orbital properties of planetary systems, evaluating the stability of planetary orbits, generating animations of planetary systems, and performing a variety of technical analyses.

“Systemic Console aggregates data from the full range of resources being brought to bear on extrasolar planets and provides an interface between these subtle measurements and the planetary systems we’re trying to find and describe,” Meschiari said.

Laughlin said he was struck by the fact that, while the techniques used to find exoplanets are extremely subtle and difficult, the planet discoveries that emerge from these obscure techniques have generated enormous public interest. “These planet discoveries have done a lot to create public awareness of what’s out there in our galaxy, and that’s one reason why we wanted to make this work more accessible,” he said.

Support for the development of the core scientific routines underlying the Systemic Console was provided by an NSF CAREER Award to Laughlin.