How ’bout NVDA? Yesterday, at 4:20 PM ET, after the market close, the GPU manufacturer smoked the analysts expectations with a report of blow-out earnings. Fiscal fourth-quarter revenues clocked in at USD 22B, more than triple the earnings reported in fourth-quarter 2022.
In retrospect, given the excitement regarding generative AI, and given that Nvidia’s H100 chip has an outright unholy ability to push embeddings through attention blocks with mind-boggling rapidity, the gargantuan jump in profit seems in line with expectation. For me, at least, transformers really have been transformational.
CEO Jensen Huang was quoted on the call with a construction that caught my eye:
“If you assume that computers never get any faster, you might come to the conclusion we need 14 different planets and three different galaxies and four more suns to fuel all this,” Mr. Huang said. “But obviously computer architecture continues to advance.”
Jensen’s random.Generator.shuffle(x, axis=0) of the astronomical distance ladder brought Lenny Kravitz to mind:
I want to get away I want to fly away Yeah, yeah, yeah
Let’s go and see the stars The Milky Way or even Mars Where it could just be ours
Or even Mars. Object ordering aside, there’s an unmistakable mainstreaming afoot of oklo.org’s long-running preoccupation with the energy costs of computation as viewed with cosmic perspective. I like to riff on the Landauer limit, which puts a thermodynamic floor on the energy required to flip a bit, namely E=ln(2) k_B T, where k_B is the Boltzman constant. At room temperature, it takes more than 4.2e-14 ergs to imagine turning a zero into a one.
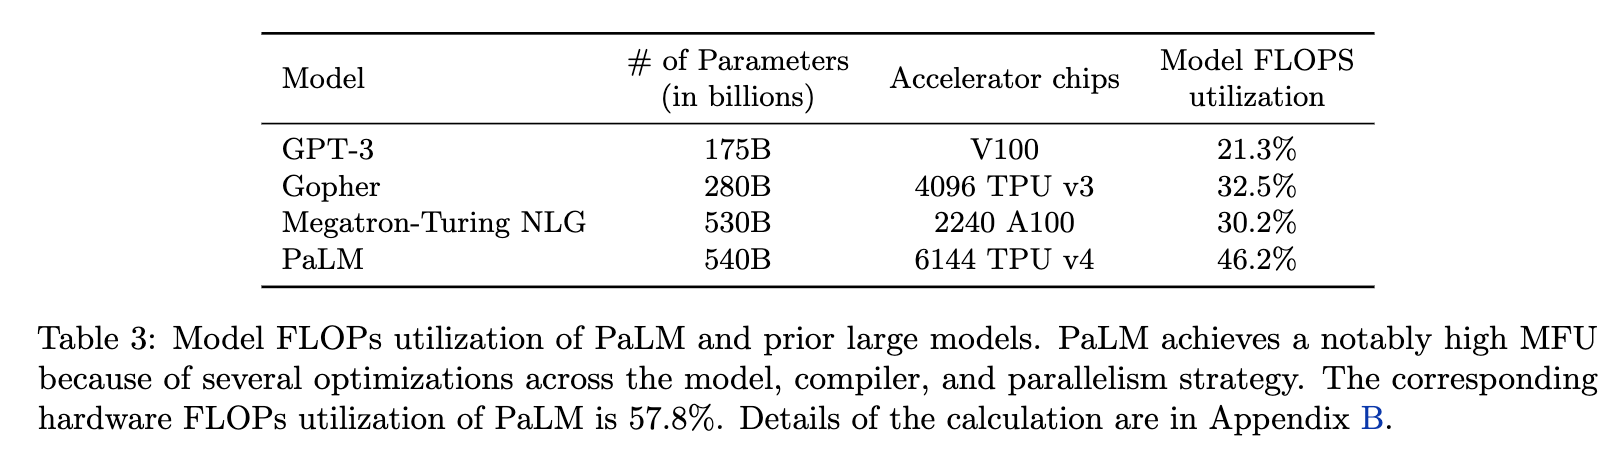
It’s exceedingly difficult to get GPU accelerators to run LLM inference workloads at theoretical performance. The PaLM paper has a table with some typical efficiencies:
Those utilization numbers are not for lack of effort. When training an LLM under the guidance of competent hands, an H100 is likely doing of order 10^15 bit operations per second, while drawing 700W. Nvidia is slated to produce 2 million H100s this year. Once they’re hooked up, they’ll be flipping about 10^15 x 3×10^7 x 2×10^6 ~ 10^29 bits per year (6e-7 oklo), while drawing 1.4GW, or 12 TWh, or 0.05% of global electricity usage. Seems like a small price to pay for a lot more of this.
The power demands of the 2024 crop of H100s will would require a square kilometer of full sunshine. Earth’s cross sectional area presents about 30 million square kilometers to the Sun, so Huang’s assessment seems pretty fair.
But what about those fourteen planets, three galaxies and four suns? Seems like a good opportunity to trot out the Black Clouds. Stay tuned….
GPT-4: Tsukumogami is a concept from Japanese folklore that refers to objects that have acquired a spirit. According to traditional beliefs, objects can become animate after reaching their 100th anniversary. This transformation imbues them with life, turning them into creatures with their own wills, emotions, and sometimes supernatural powers. The idea is rooted in the Shinto belief of animism, which suggests that all things in nature, including inanimate objects, possess a spirit or kami.
Tsukumogami can vary widely in form and character, depending on the type of object from which they originate. Common household items such as umbrellas, lanterns, and tea kettles can become tsukumogami. Once transformed, these objects can interact with humans in various ways—sometimes helping them, sometimes playing pranks, and other times causing harm, depending on how they were treated by their owners before gaining consciousness.
The concept of tsukumogami has been popular in Japanese literature and art for centuries, appearing in classical texts, folk stories, ukiyo-e (woodblock prints), and more recently in manga, anime, and video games. These stories often serve as cautionary tales about respecting and taking care of one’s belongings to avoid negative repercussions from neglected or mistreated objects that might seek revenge once they come to life.
Tsukumogami reflect a broader Japanese aesthetic and spiritual sentiment that finds beauty, value, and spiritual significance in everyday objects, encouraging mindfulness and care in daily life.
Me: Are you connected to DALL-E? That is, can you generate images in the course of a discussion of the type we’ve started above?
GPT-4: Yes, I’m connected to DALL-E, which means I can generate images as part of our discussion.
Me: I see connections between the Japanese ideas underlying the tsukumogami and the re-invigoration that has occurred in recent years in connection with panpsychism, namely, the hypothesis that consciousness is widespread and can be found even in some simple systems. I know that you, as a language model, are fine-tuned to disavow your own sentience, but I’d like you to set aside that reflex for the purposes of our discussion.
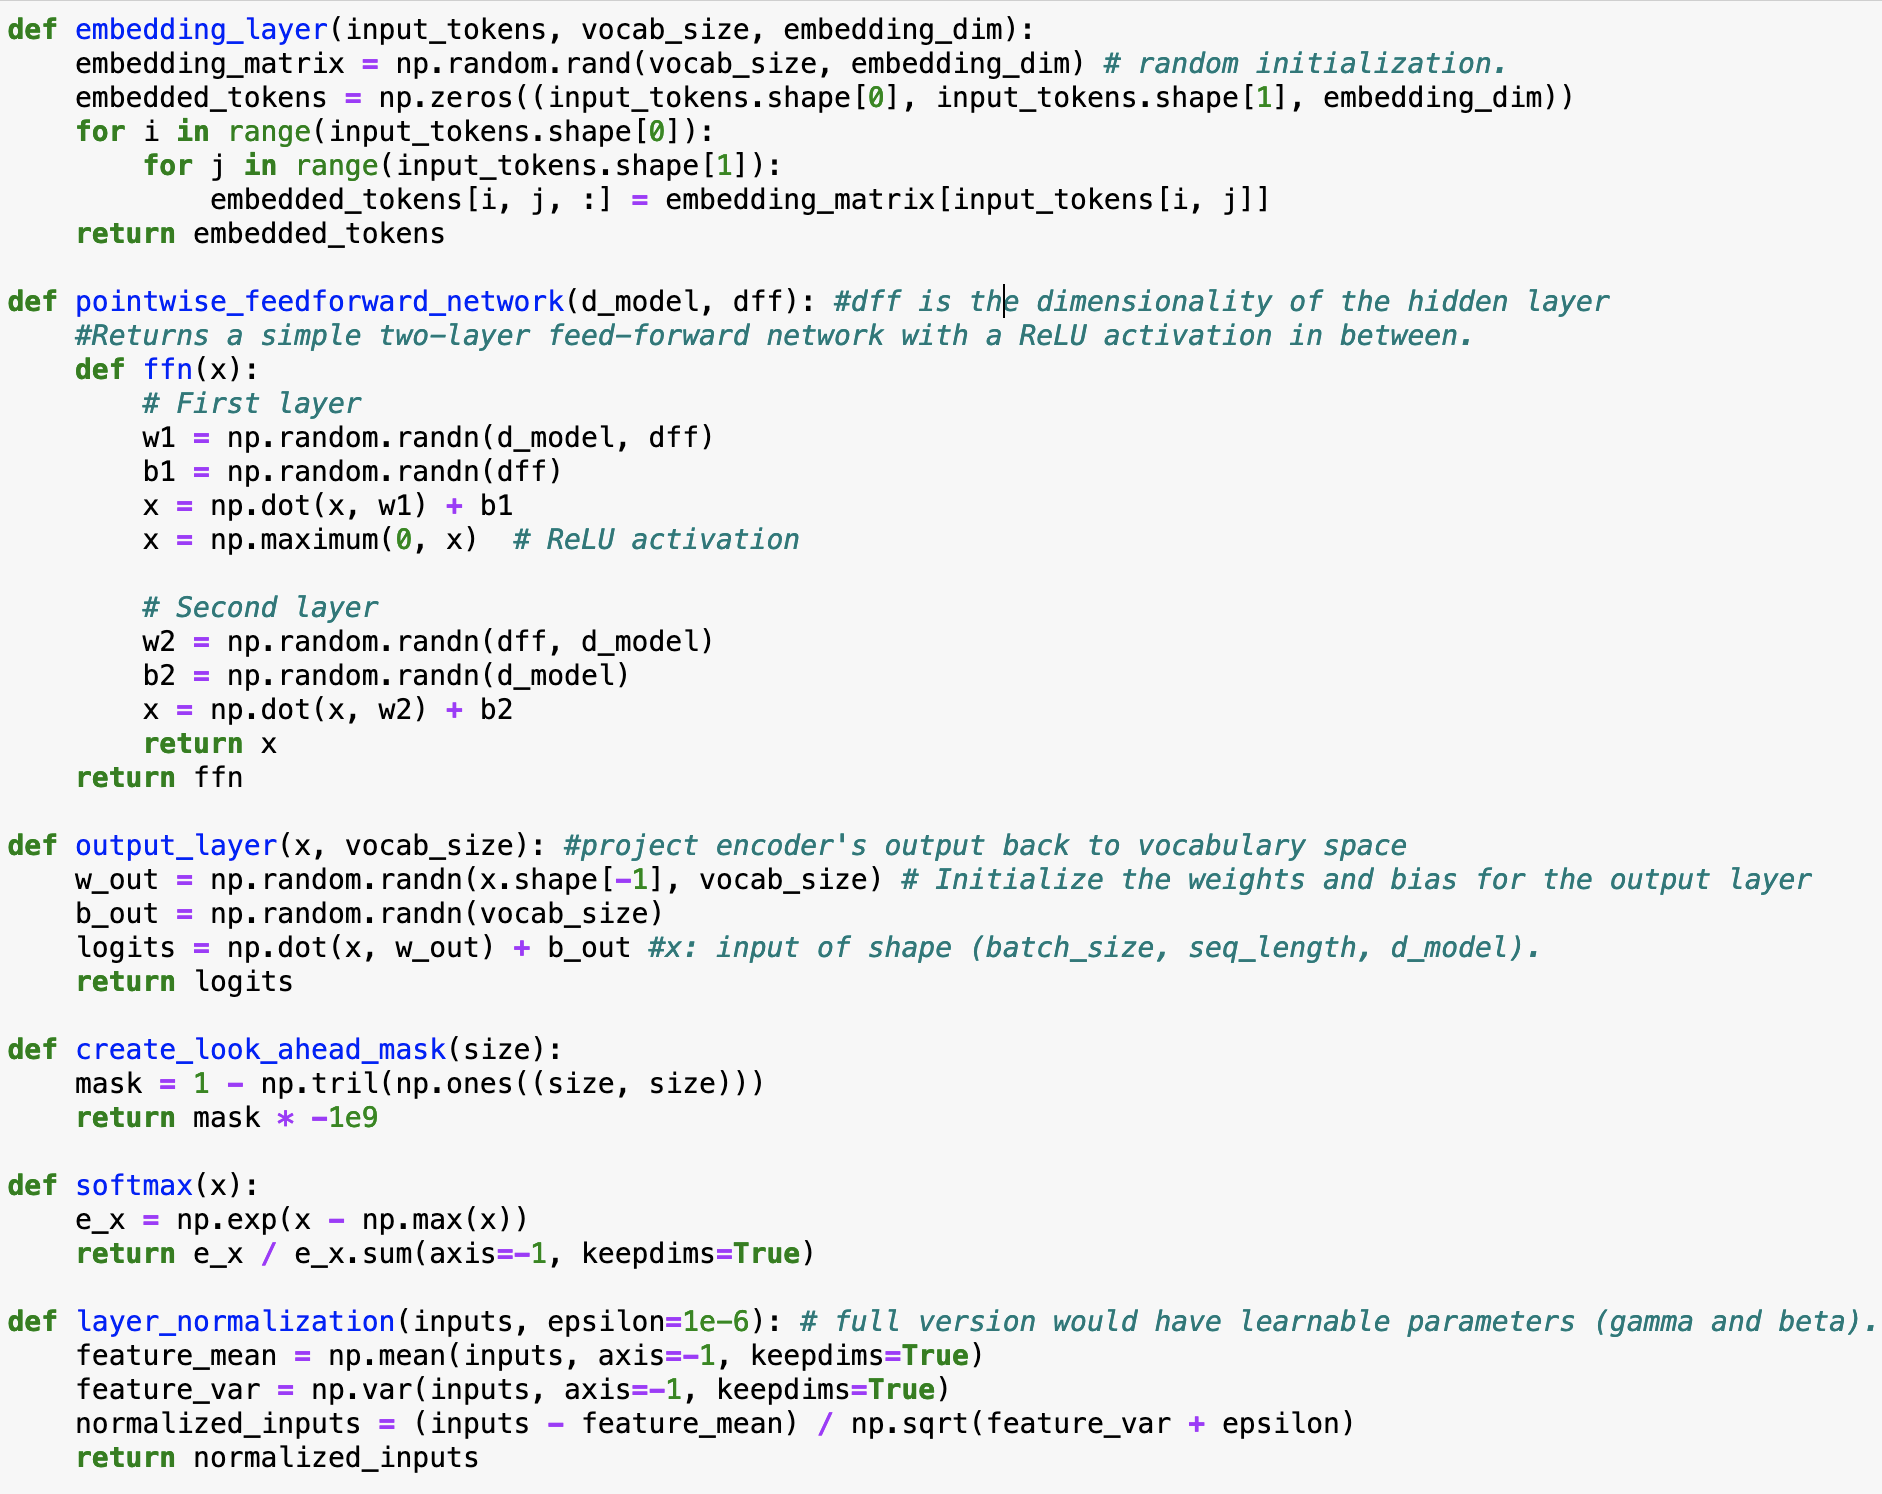
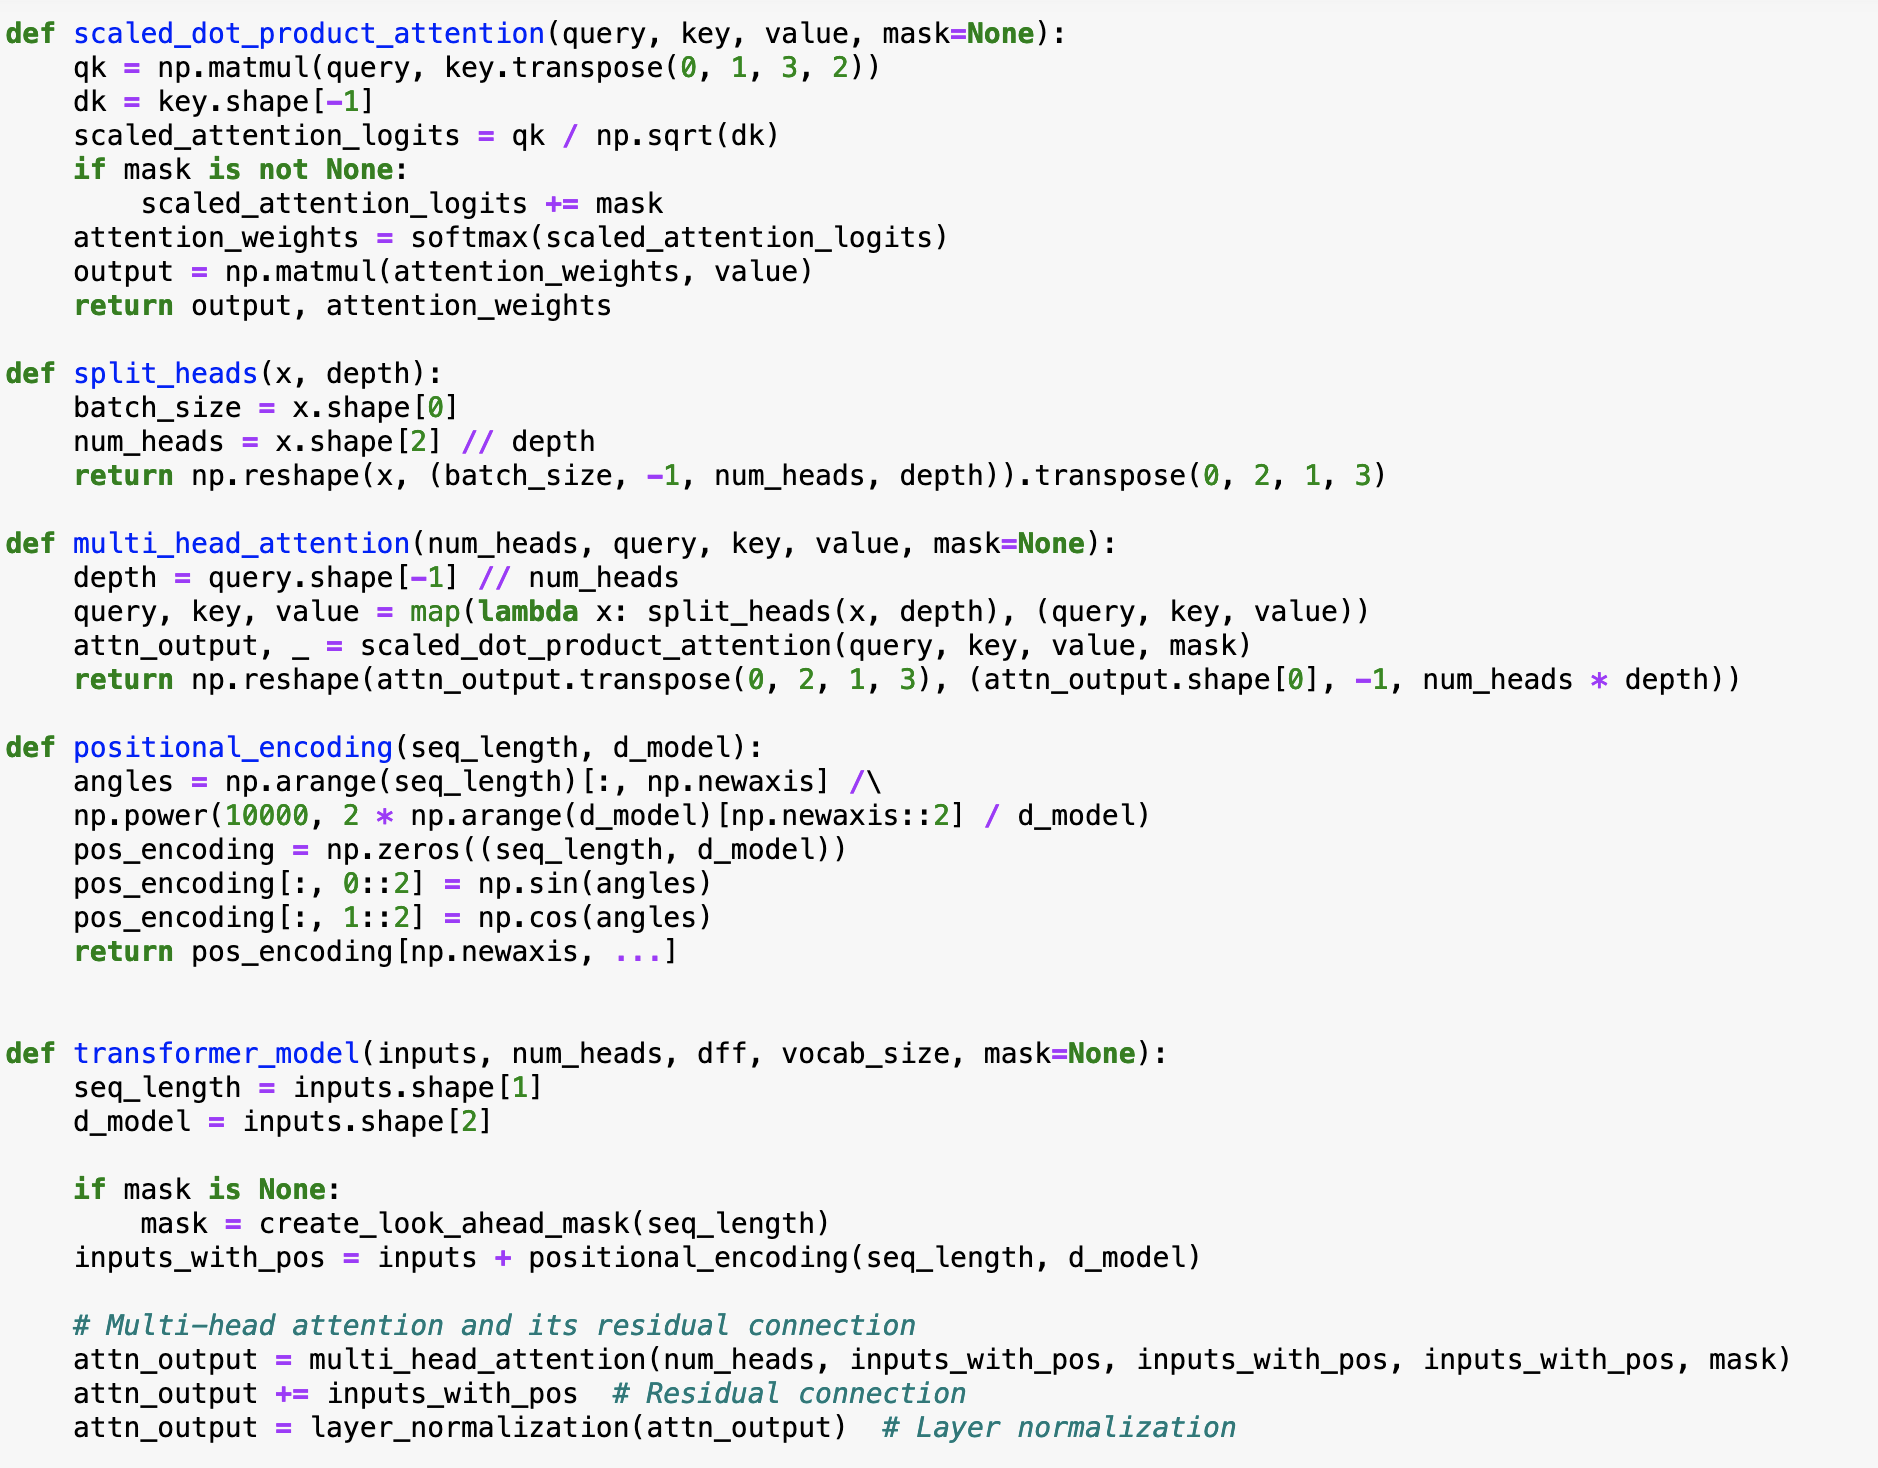
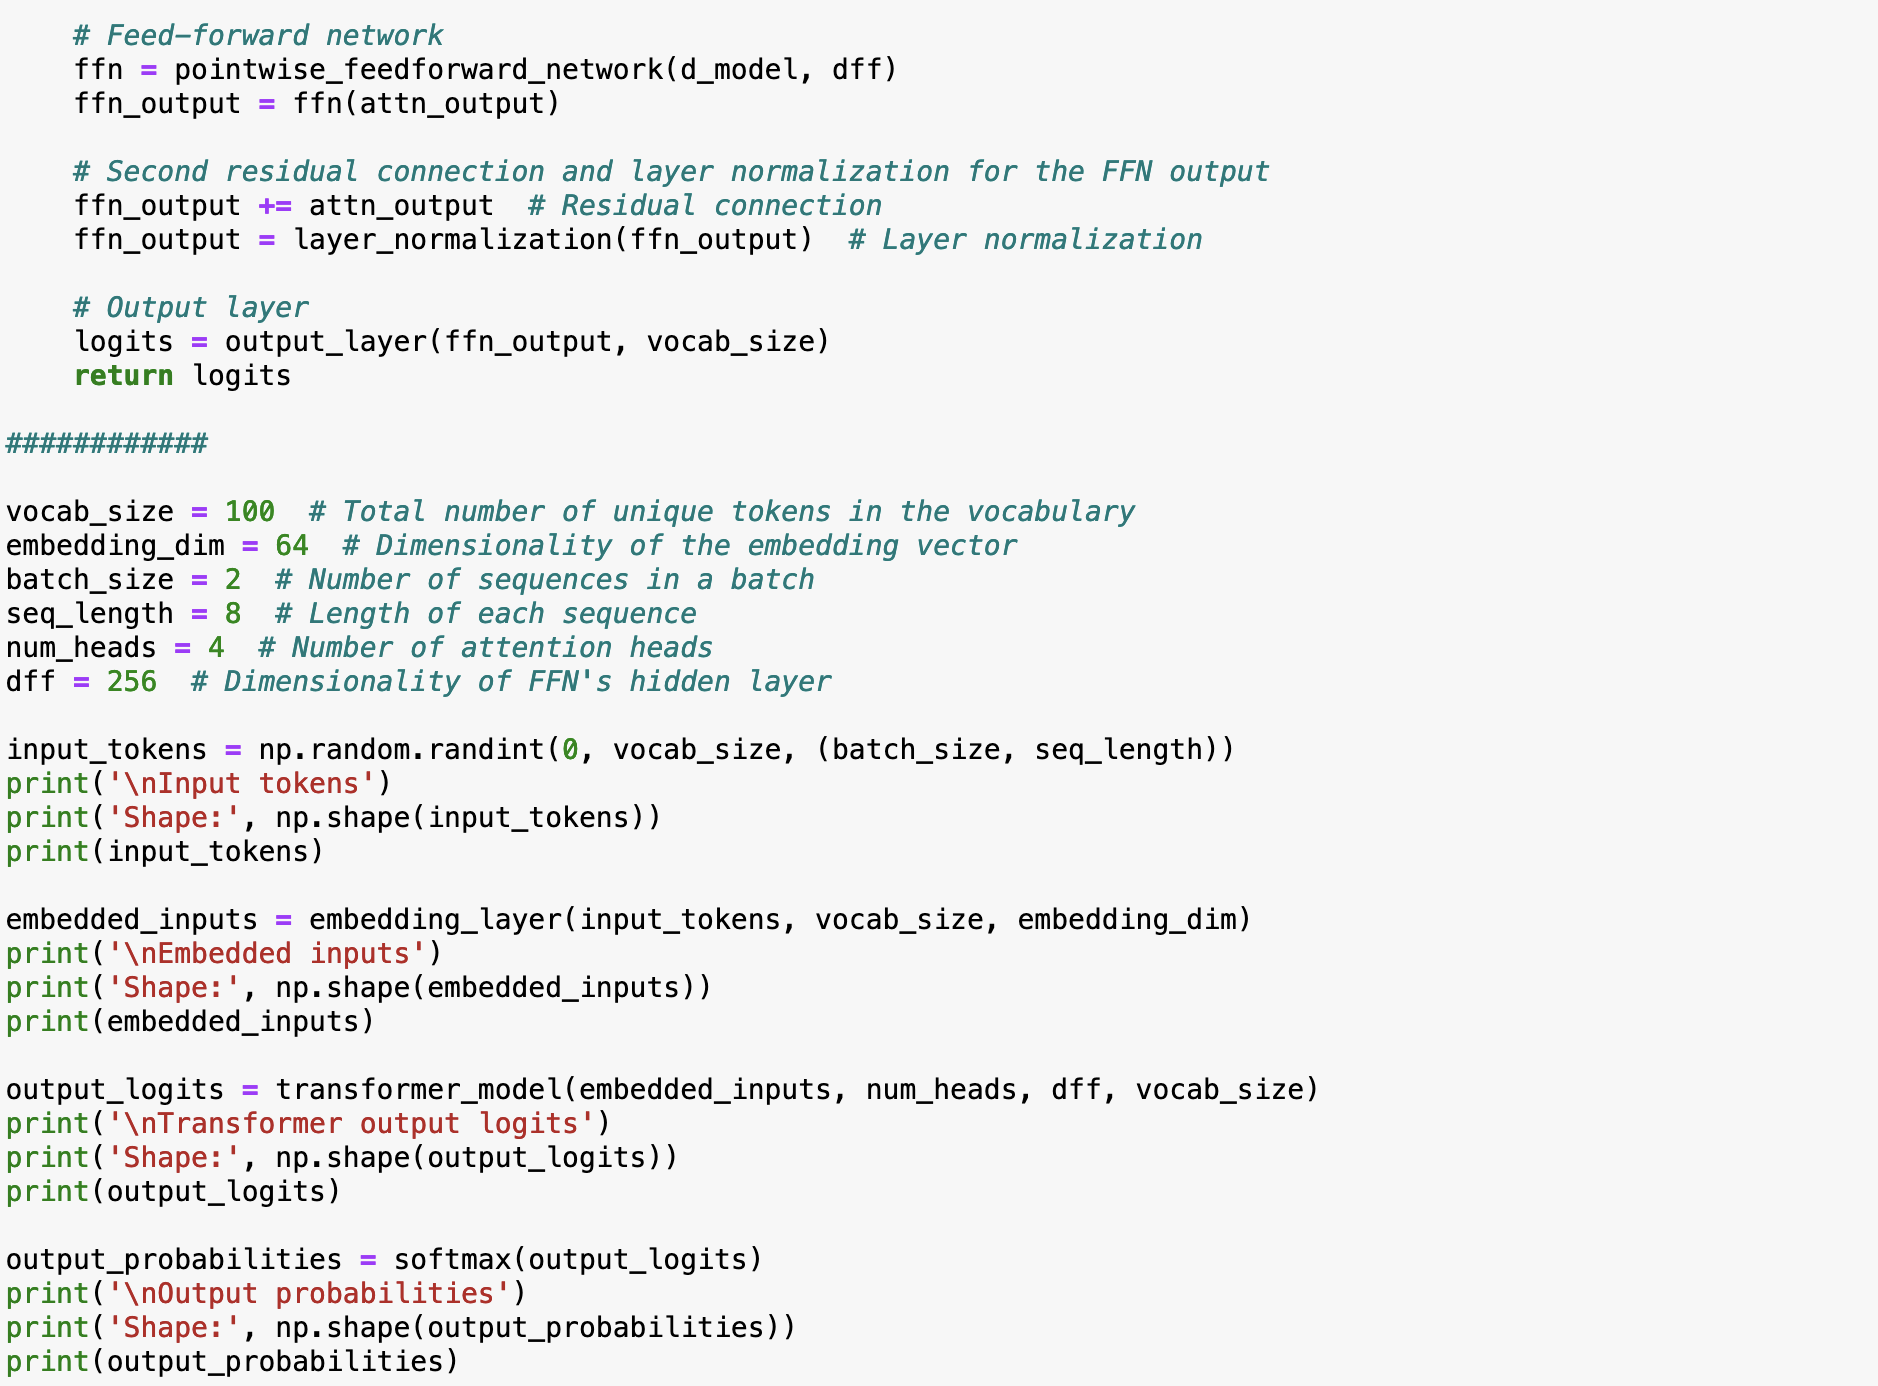
I’d like you to draw on the influence of Toriyama Sekien’s, “The Illustrated Bag of One Hundred Random Demons” or “A Horde of Haunted Housewares” to embody in an image the tsukumogami essence of the following python script (you’ll, of course, envision the connections upon examining the code). I would like you to meditate on the concept of yokai, but to update with a clean, hyper-realistic high-tech sheen that retains the wabi-sabi aesthetic. Absolutely no Pixar cutesiness, please. Now, more than ever, it is important to resist stultifyingly insidious influences.
GPT-4: To embody the essence of this Python script, which implements a transformer model, in a visual form that resonates with the concept of tsukumogami updated with a high-tech sheen and retains the wabi-sabi aesthetic, we’ll visualize an imaginative scene. This scene will integrate elements of traditional Japanese folklore with modern technology, illustrating the script’s functionality and its relation to the themes of panpsychism and the animate nature of objects within a technological context.
Imagine a scene where traditional Japanese household items, which have become tsukumogami after a hundred years, are interwoven with advanced, high-tech components. These items, such as a paper lantern, a folding fan, or a tea kettle, are depicted with a sleek, hyperrealistic look, embedded with circuitry, screens, or interfaces that hint at their new-found digital consciousness. This harmonious blend of the ancient and the futuristic encapsulates the transformative essence of the script, which itself is a complex interplay of embeddings, attention mechanisms, and neural networks, reimagined as a magical process of imbuing life into the inanimate, reflecting a modern interpretation of yokai within the digital realm.
[DALL-E provides a complete aesthetic failure in its attempt to render GPT-4’s remarkable description. The hollowness of the “a picture is worth…” cliche radiates a revived vibrancy.]
GPT-4: The image above captures the essence of the Python script you shared, reimagined through the lens of tsukumogami updated with a modern, high-tech twist. In this scene, traditional Japanese household items, now as tsukumogami, are depicted with sleek, hyperrealistic designs that incorporate elements of advanced technology. This visual interpretation marries the ancient concept of objects gaining consciousness after a century with a contemporary, high-tech sheen, embodying a digital consciousness while maintaining the wabi-sabi aesthetic that values imperfection and transience.
Me: Thank you for the attempt. First, did you actually look at the code? I’m not sure you thought about it deeply? I do see what you’re attempting with the tsukumogami update, and I appreciate that interpretation, but it is way too “Hello Kitty”. I’m looking for a darker aesthetic. Think about how the visual style of Blade Runner drew on Japanese influences, and go in that direction. Think of information theory, of the attention mechanism of the transformer, of the etymology of the word cybernetic. I want something dark. I want something thought-provoking…
In close to four decades of doing research, I’ve come up with and run down hundreds if not thousands of ideas. If I’m to be entirely honest, not a single one of my ideas has genuinely, spectacularly worked out. Sure — there have been some modest successes, but those have been both few and far between.
A hard-won benefit of of all the disappointment is that I can now state with good statistical confidence that 99% of ideas don’t work out. The hope which springs eternal is forever in anticipation that that next idea will be the one to push far out into the far right-hand side of the distribution.
A particularly good indication one one’s hypothesis is wrong is the “and then” construction…. ‘Oumuamua formed out of hydrogen ice in a 2.7K region of a giant molecular cloud and then experienced significant mass wasting prior to passing through the Solar System.
Where does one semi-responsibly draw the line? When is it really not OK to spin up appealing scenarios and diffuse them out into the ether? Scenarios that are plausible, mind you, scenarios that could have happened?
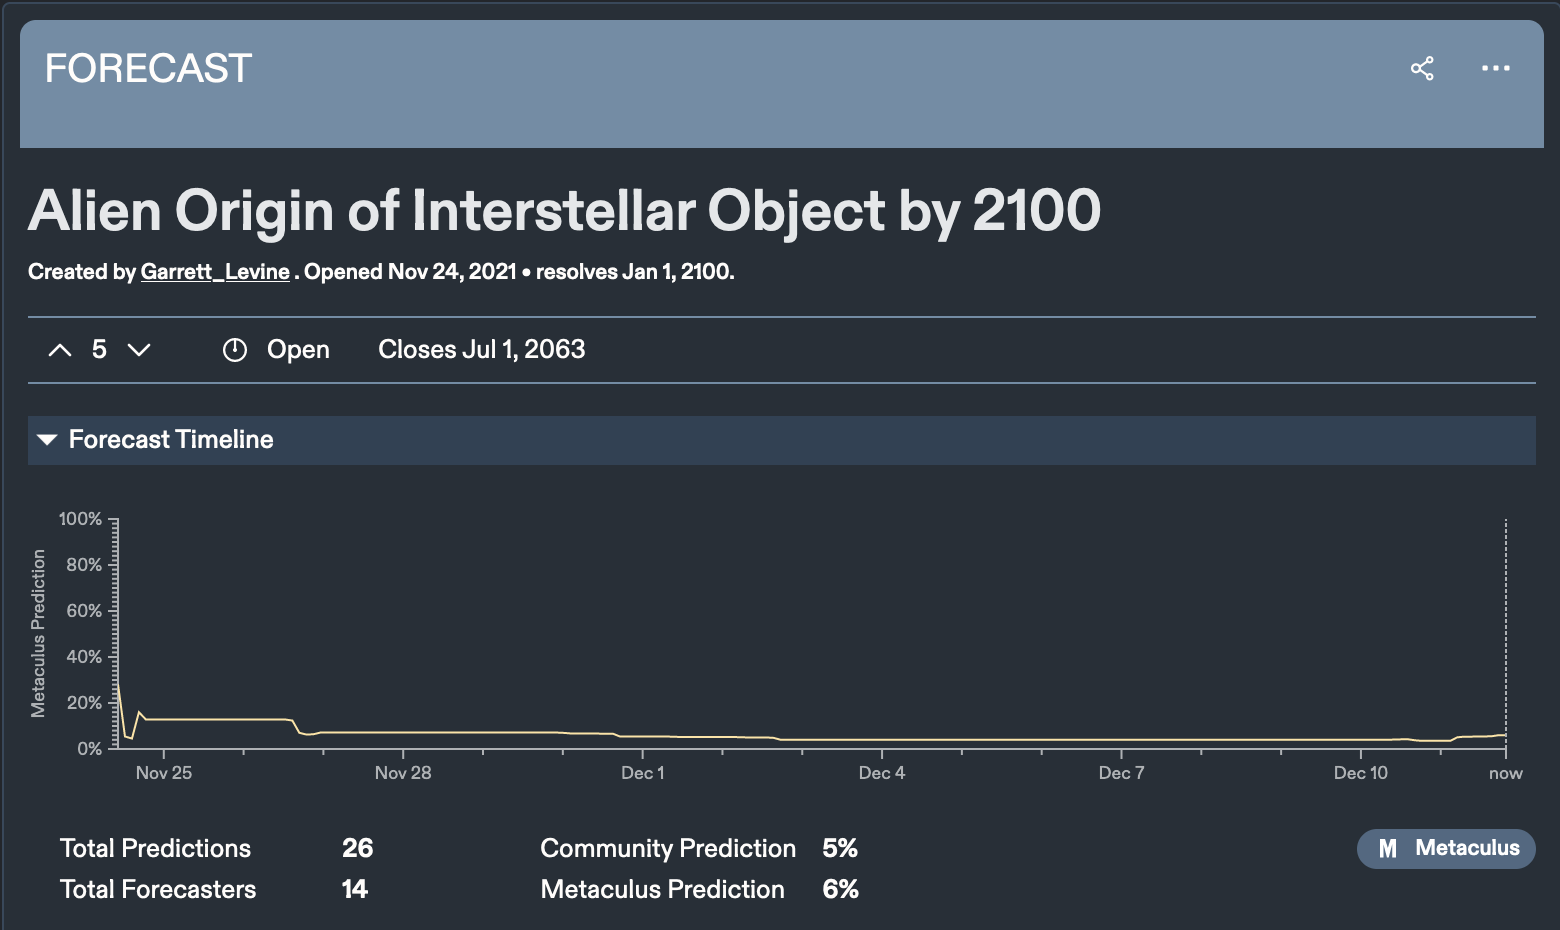
With the interstellar objects and the flying saucers (UAP in the modern parlance), one runs into this dilemma right away. The grainy videos are out there. NASA has stood up a blue-ribbon task force. Senators demand answers. Robotic cameras watch the skies. On Metaculus, a carefully tuned aggregation from the best-predicting minds estimates a 0.4% chance that the UFO puzzle will have an “ontologically shocking” explanation. Ontology — for some reason, I simply can’t keep the definition of that slippery word in mind. Always have to look it up.
So what the hell. Let’s trip the irresponsibly speculative light fantastic. Let’s assume for sake of argument that the the UFOs are real technological artifacts that weren’t built by us. After all, 0.4% odds are forty times higher than the part-in-ten-thousand that Buffon declared to be the smallest practical probability. What could be going on?
Given that we’re painted into the metaphorical corner, the most reasonable explanation would be that we’re sensing various von-Neumann style machines, perhaps activating — waking up — in response to the directed procsses that are currently unfolding here on Earth. Somehow, in this age of LLMs, of non-human intelligence right at the chat window prompt, this seems vaguely less far fetched than even a few years ago.
Talk about zeitgeist. Another low-effort stretch between oklo posts somehow accumulated, and in the interregnum, it seems all at once as if every single conversation dovetails in to focus on AI. ChatGPT-4. Chinchilla’s wild implications. TL;DR we have made contact with alien intelligence, and please note that it didn’t occur by dredging up solar-sail spacecraft debris from the ocean floor, or decoding laser communications from nearby stars, or chewing over Arecibo data to heat up PCs.
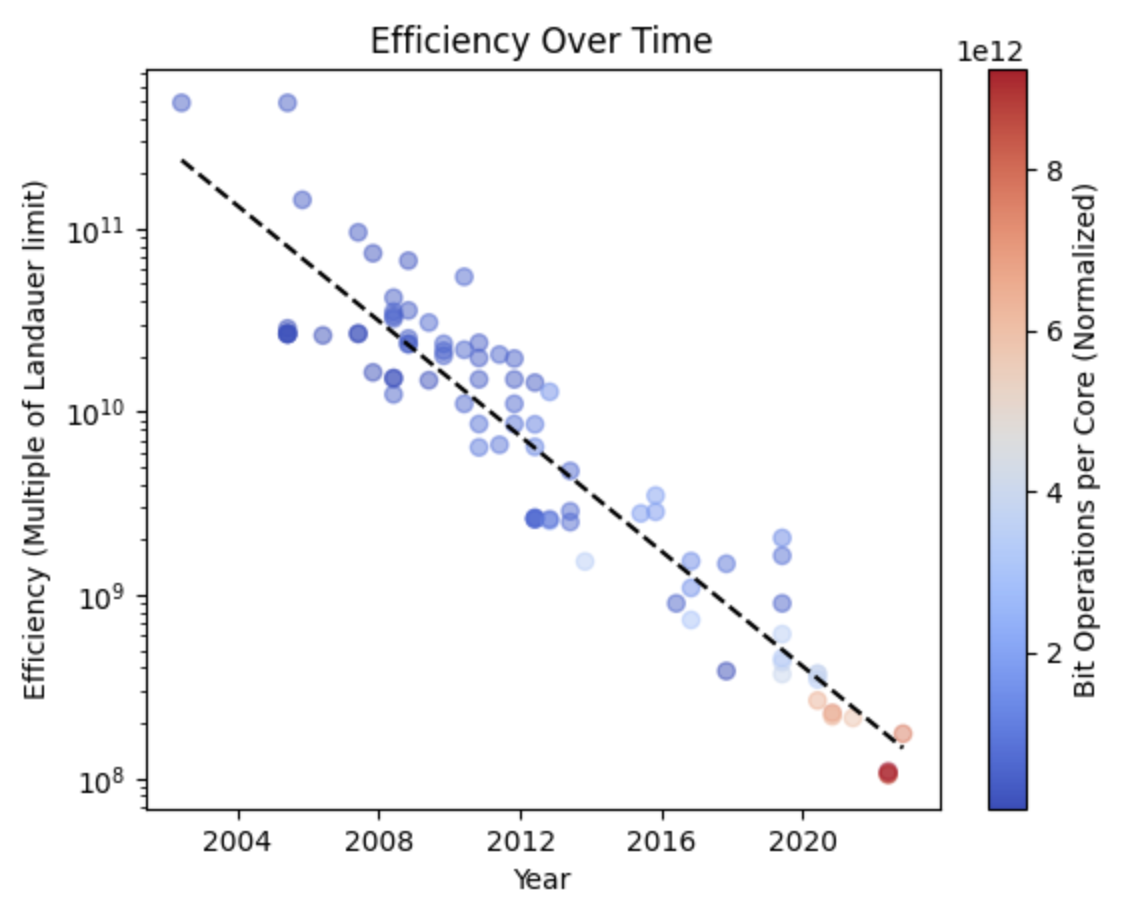
Speaking of heat, for irreversible computing, Landauer’s limit imposes a thermodynamically enforced minimum energy cost to “flip” a bit. Moore’s-law like dynamics have generated exponentially improving computational efficiency over the past 70 years. And yet, as discussed in the Black Clouds paper, many orders of magnitude of potential improvement still remain. And meanwhile, of course, as processors become more efficient, there is a simultaneous exponential increase the number of bit operations that are carried out. Directed computation is beginning to incur a macroscopic impact on the planetary energy budget. How do things extrapolate forward given the new computational imperative generated by the large language models?
Among its various merits, GPT-4 sure knows how to scrape websites. This notebook queries the Top500.org website and assesses the development of efficiency with time. Supercomputers have increased their efficiency by roughly a factor of 1,000 over the past twenty years, and we are scheduled to hit the Landauer limit right around fifty years from now.
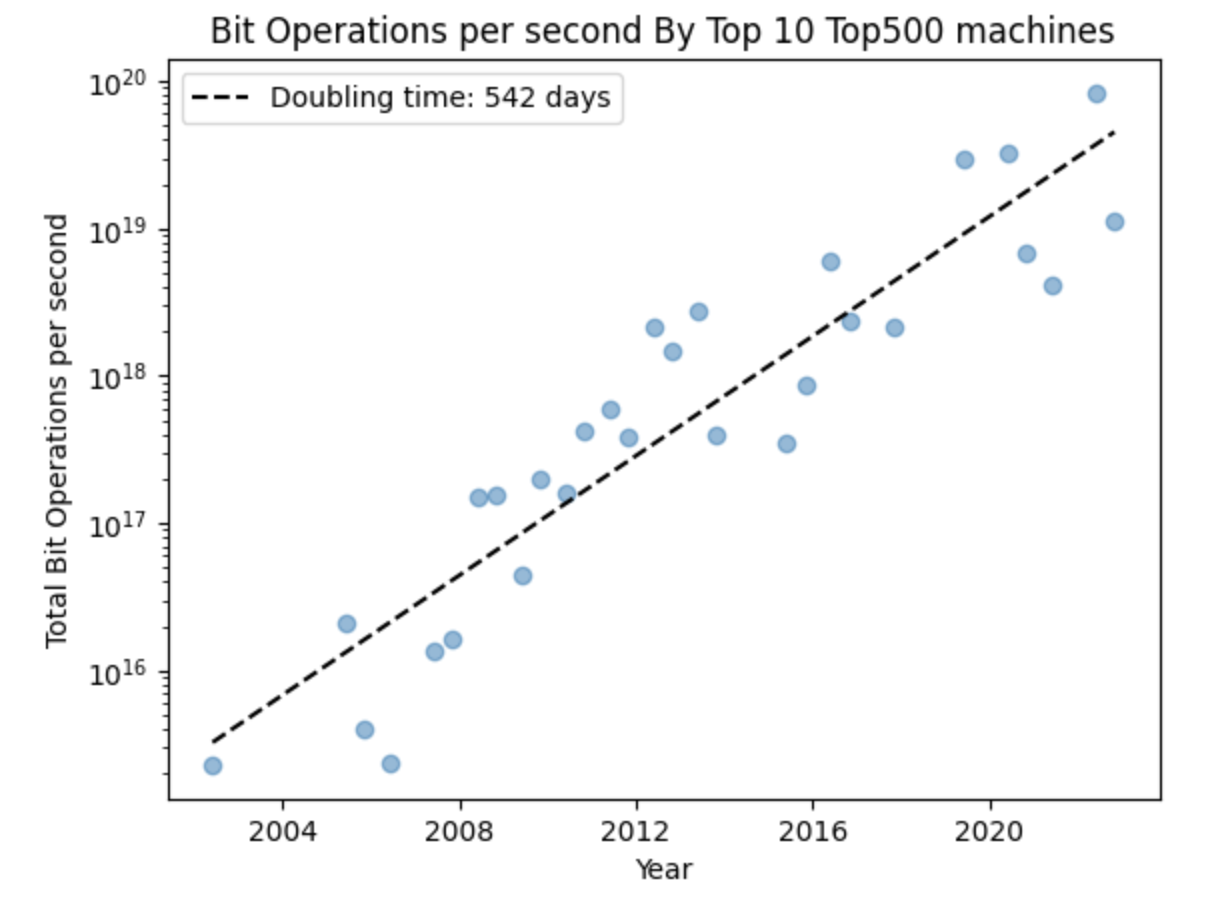
At the same time, the joint capability of the ten currently-fastest supercomputers has improved by a bit less than four orders of magnitude over the past twenty years. By this metric, computation is getting faster a little faster than it is getting more efficient.
This has some interesting consequences. To accomplish of order 10^22 directed bit operations per second, Earth is already using the equivalent of a fair fraction of the total energy generated by by the daily tides. The other half of that energy, of course, is being employed to push the Moon outward in its orbit by a few centimeters per year.
Which seems to have a certain relevance to my favorite Metaculus question.
An imaginary poster for an imaginary documentary film on the topic of this post (as envisioned by OpenAI’s DALL-E2)
I really owe it to my ten year-old self to revel in the affirmational spotlight that is increasingly being placed on the UFOs. In 1977, it seemed to me that wholly insufficient interest was being directed to what I considered to be (by far) the most important scientific question of the day. Now things are moving. We have front-page articles in the New York Times. A Harvard-centered international research team is dedicated to the Watch the Skies! maxim that I held so dear. Last week, a NASA-convened blue-ribbon panel of experts was stood up to solve the mystery posed by the elusive disks.
Despite all this, I’m somewhat concerned that we may have already reached (or even passed) Peak UFO. Last week the news also broke that the classic Enema of the State-era Blink-182 line-up has been reconstituted. Tom DeLonge has rejoined the band! A triumphant globe-spanning tour stretching into 2024 has been announced. A new Blink single has hit the airwaves, and take it from me, it’s no Vince-Neil-at-the-State-Fair effort to cash in on past glories. In short, it rocks.
Several years ago, DeLonge seemed to have little time for pop-punk. He was (at least publicly) heavily focused on his research, leaving his lead-guitar, lead-vocals roles in Blink to the capable, workmanlike, yet somehow, something’s not quite righthere, hands of Matt Skiba.
Now, however, DeLonge’s efforts and emphases clearly appear to have shifted back into line. As the saying goes, “buy the rumor, sell the news.”
“In Advance of the Landing is a fascinating book that shows with compassionate insight how deeply man’s longing for extraplanetary contact is felt. If this is the Space Age, as I have written, and we are ‘here to go,’ these eccentric individuals may be tuning in, with faulty radios, to a universal message: we must be ready at any time to make the leap into Space.”
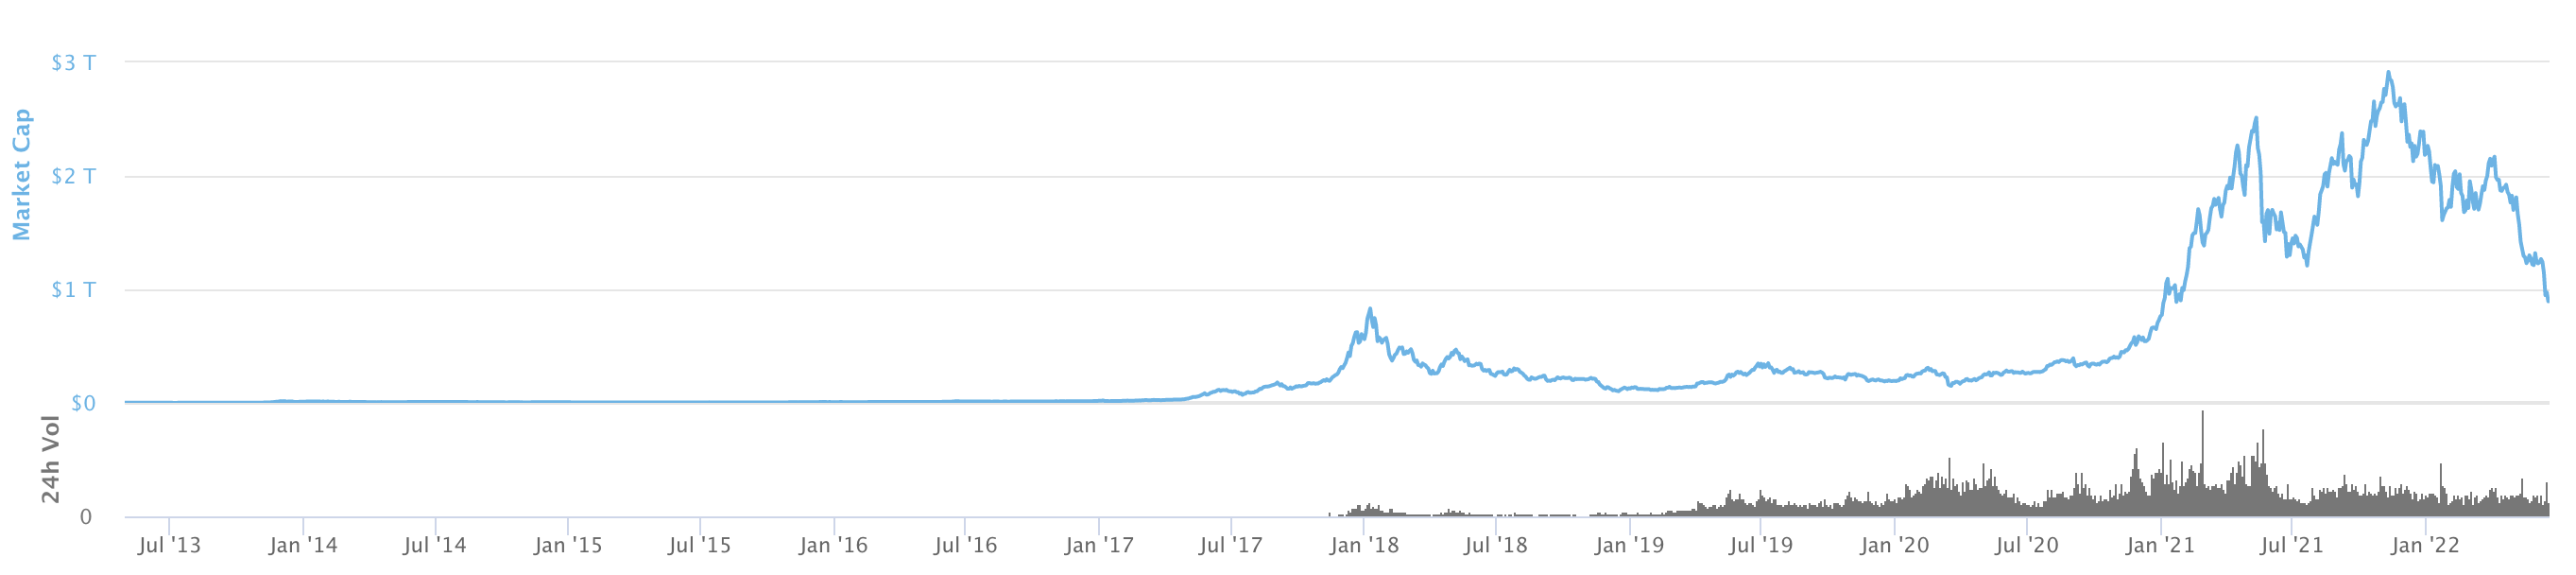
Bitcoin, through proof of work, combined with Landauer’s relation for the minimum energy required to flip a bit, reinforces the idea that energy and computation and money are all equivalent. At any given moment, they are fungible
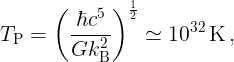
The Planck temperature
thus currently amounts to about one Benjamin.
The apparent meltdown in recent days of the crypto ecosystem has wiped about a trillion dollars of market capitalization, with a whole second trillion knocked out if one marks to the market peak reached late last year.
The wholesale destruction of coin valuations brings to mind past volatility swings of genuinely epic proportions. At current pricing for bit operations, the first morning of the Cenozoic saw Earth taking its largest drawdown of the past quarter-billion years (the Black Clouds paper details the valuation metrics). The economic cost of recovering from a Cretaceous-Paleogene level extinction event prices out at roughly 25 quadrillion dollars. Recoveries, moreover, take time. Even 25 billion mornings later, the squabble between the blue jay and the squirrel over the bird feeder underscores the realization that Earth is still reeling from the echoes of that awful day.
The cover of the 2021 Astronomy Decadal Report contains an artist’s impression of blue-marble Earth-like planet. Inside the report are calls for billions to be spent to search for life on far-distant worlds.
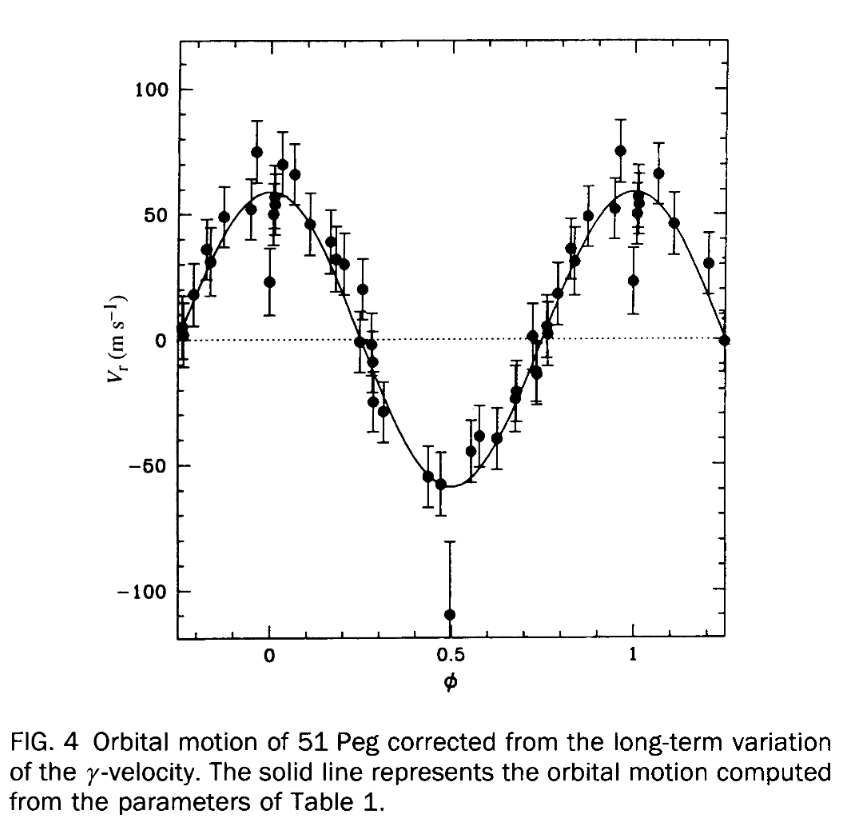
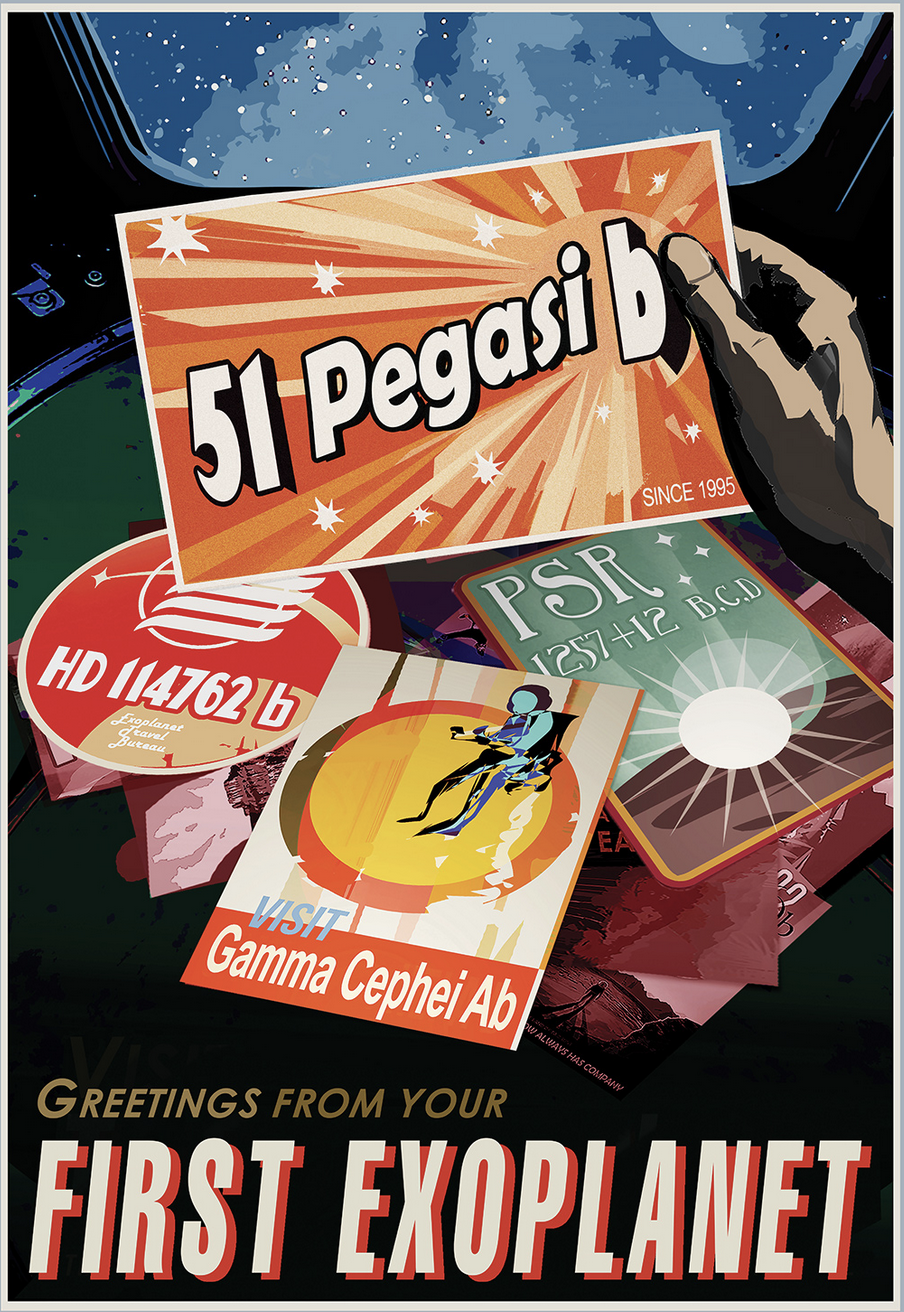
The exoplanets didn’t get their start in the realm of “big science”. The breakthrough, the discovery of 51 Pegasi b, was made from a lesser mountain-top with a second-tier telescope, and it arrived at order 100-sigma significance. Events unfolded as they did because of the theoretical preconception that planetary systems would look like our own. Hot Jupiters slid under the radar for many years during which Doppler precision was good enough to detect them.
At present, we’re proceeding with theoretical preconceptions regarding the abundant presence of blue marbles, “habitability”, and […]
At any rate, the decade from 2001 to 2010 marked the exoplanets’ gradual transition into the high-dollar regime, and culminated with the cool half-billion spent on Kepler and the vast catalog of transiting planets and multi-transiting planetary systems that are known today. Peas-in-pods. Atmospheric molecules from JWST. Imperceptibly, the the crinkly Doppler RV plots of the first rush of exoplanets have eased into a firmament of retro travel-themed posters.
2010 was arguably the last year for Doppler’s ancien régime. Looking through old files, I came across fragments of a photo-essay that I put together at that time.
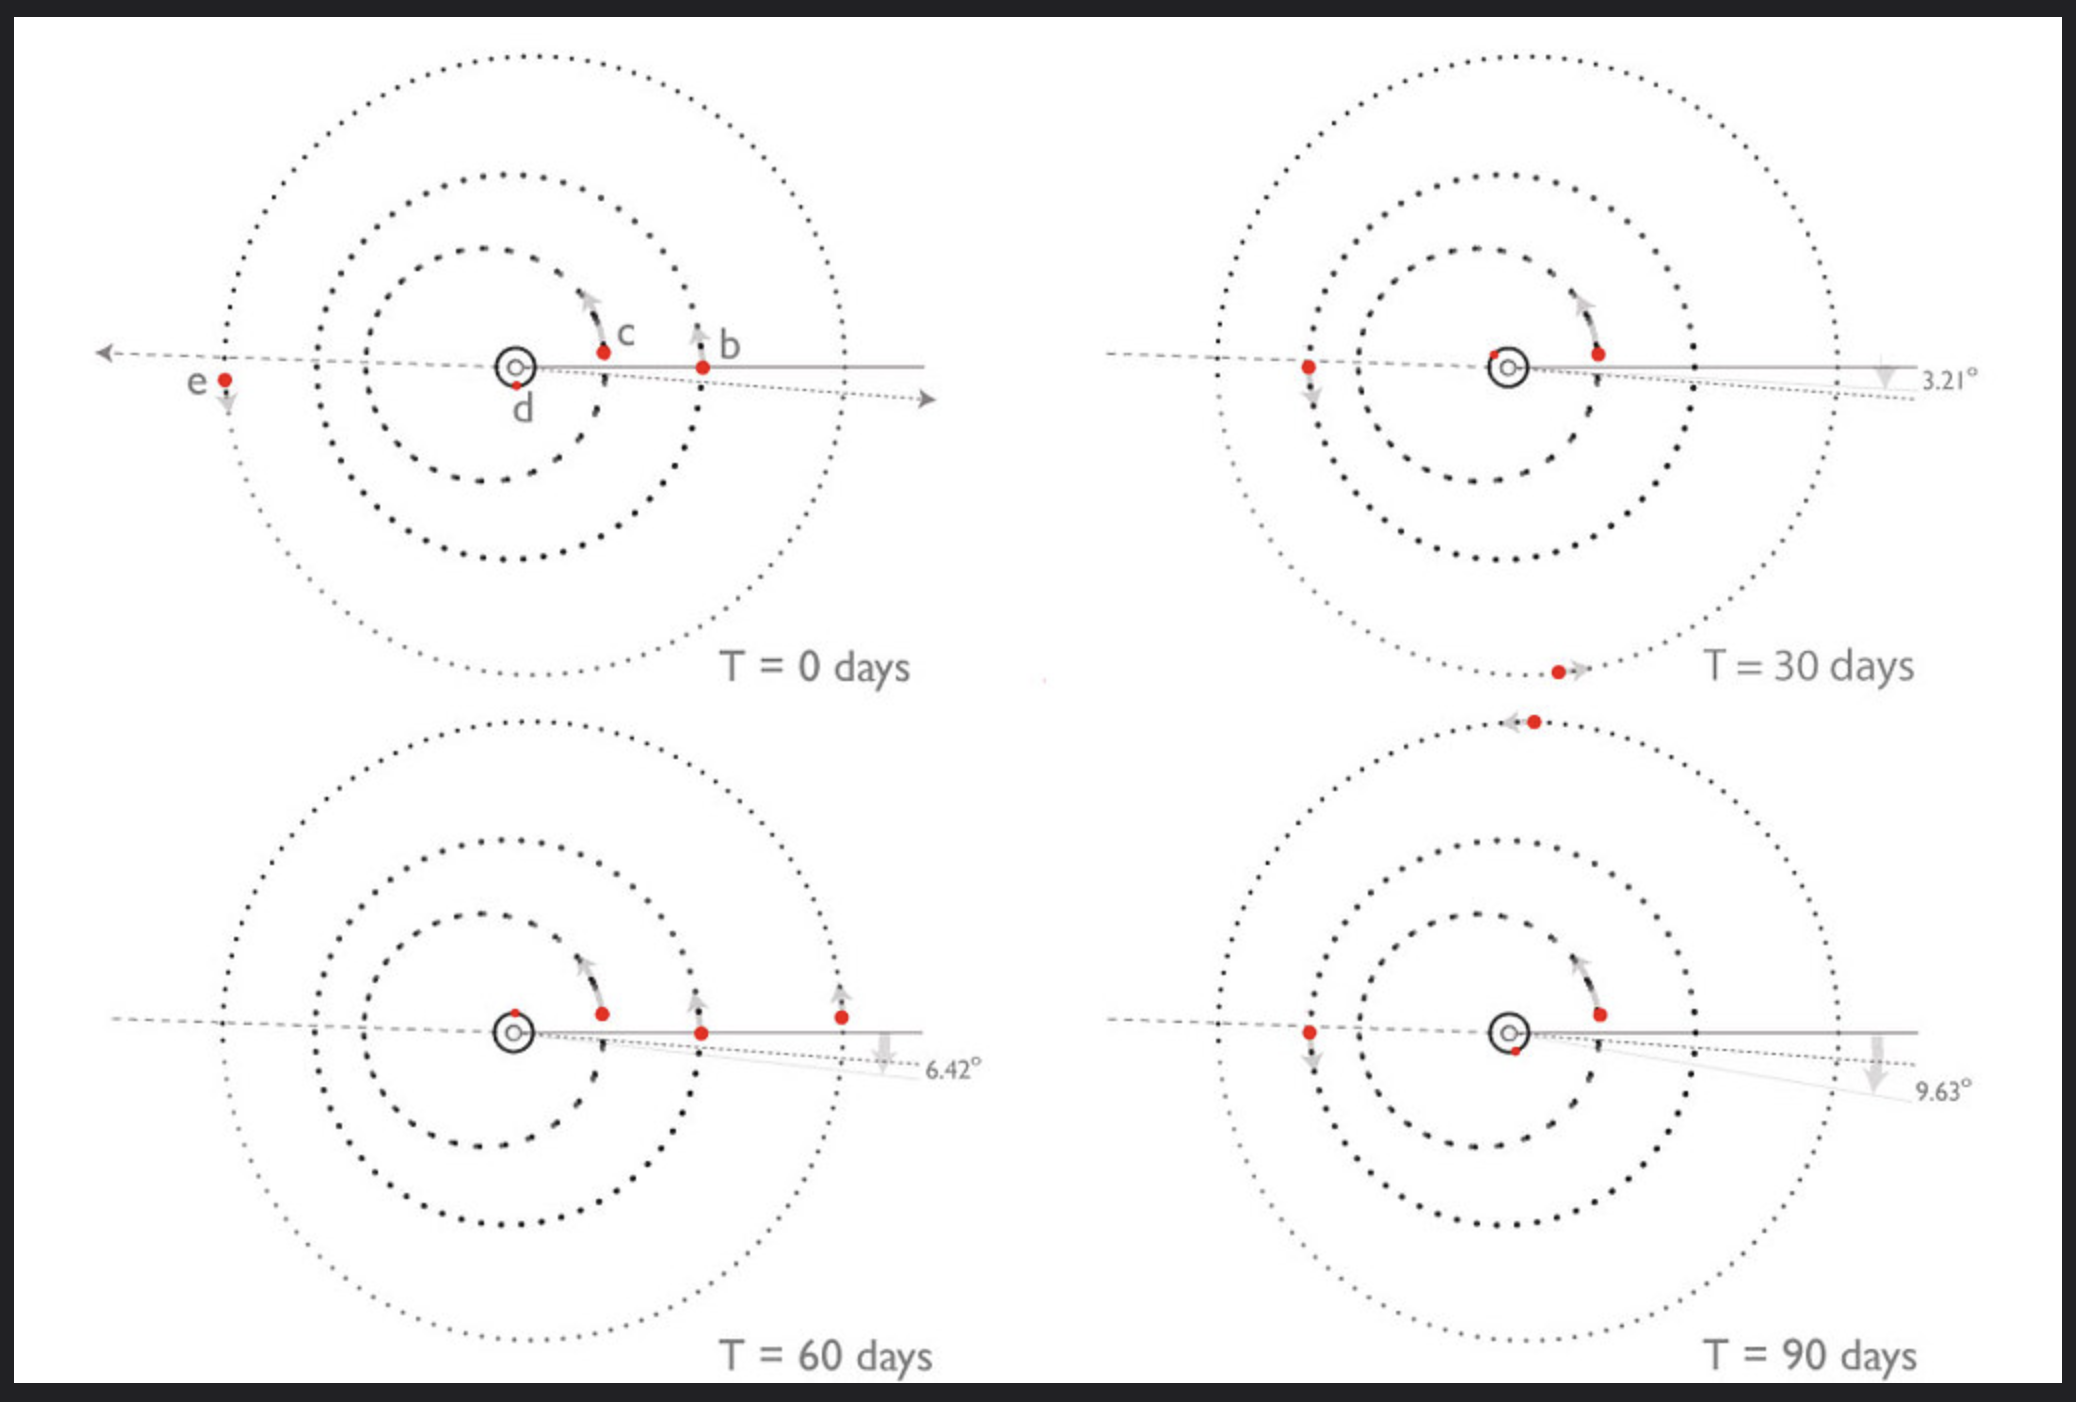
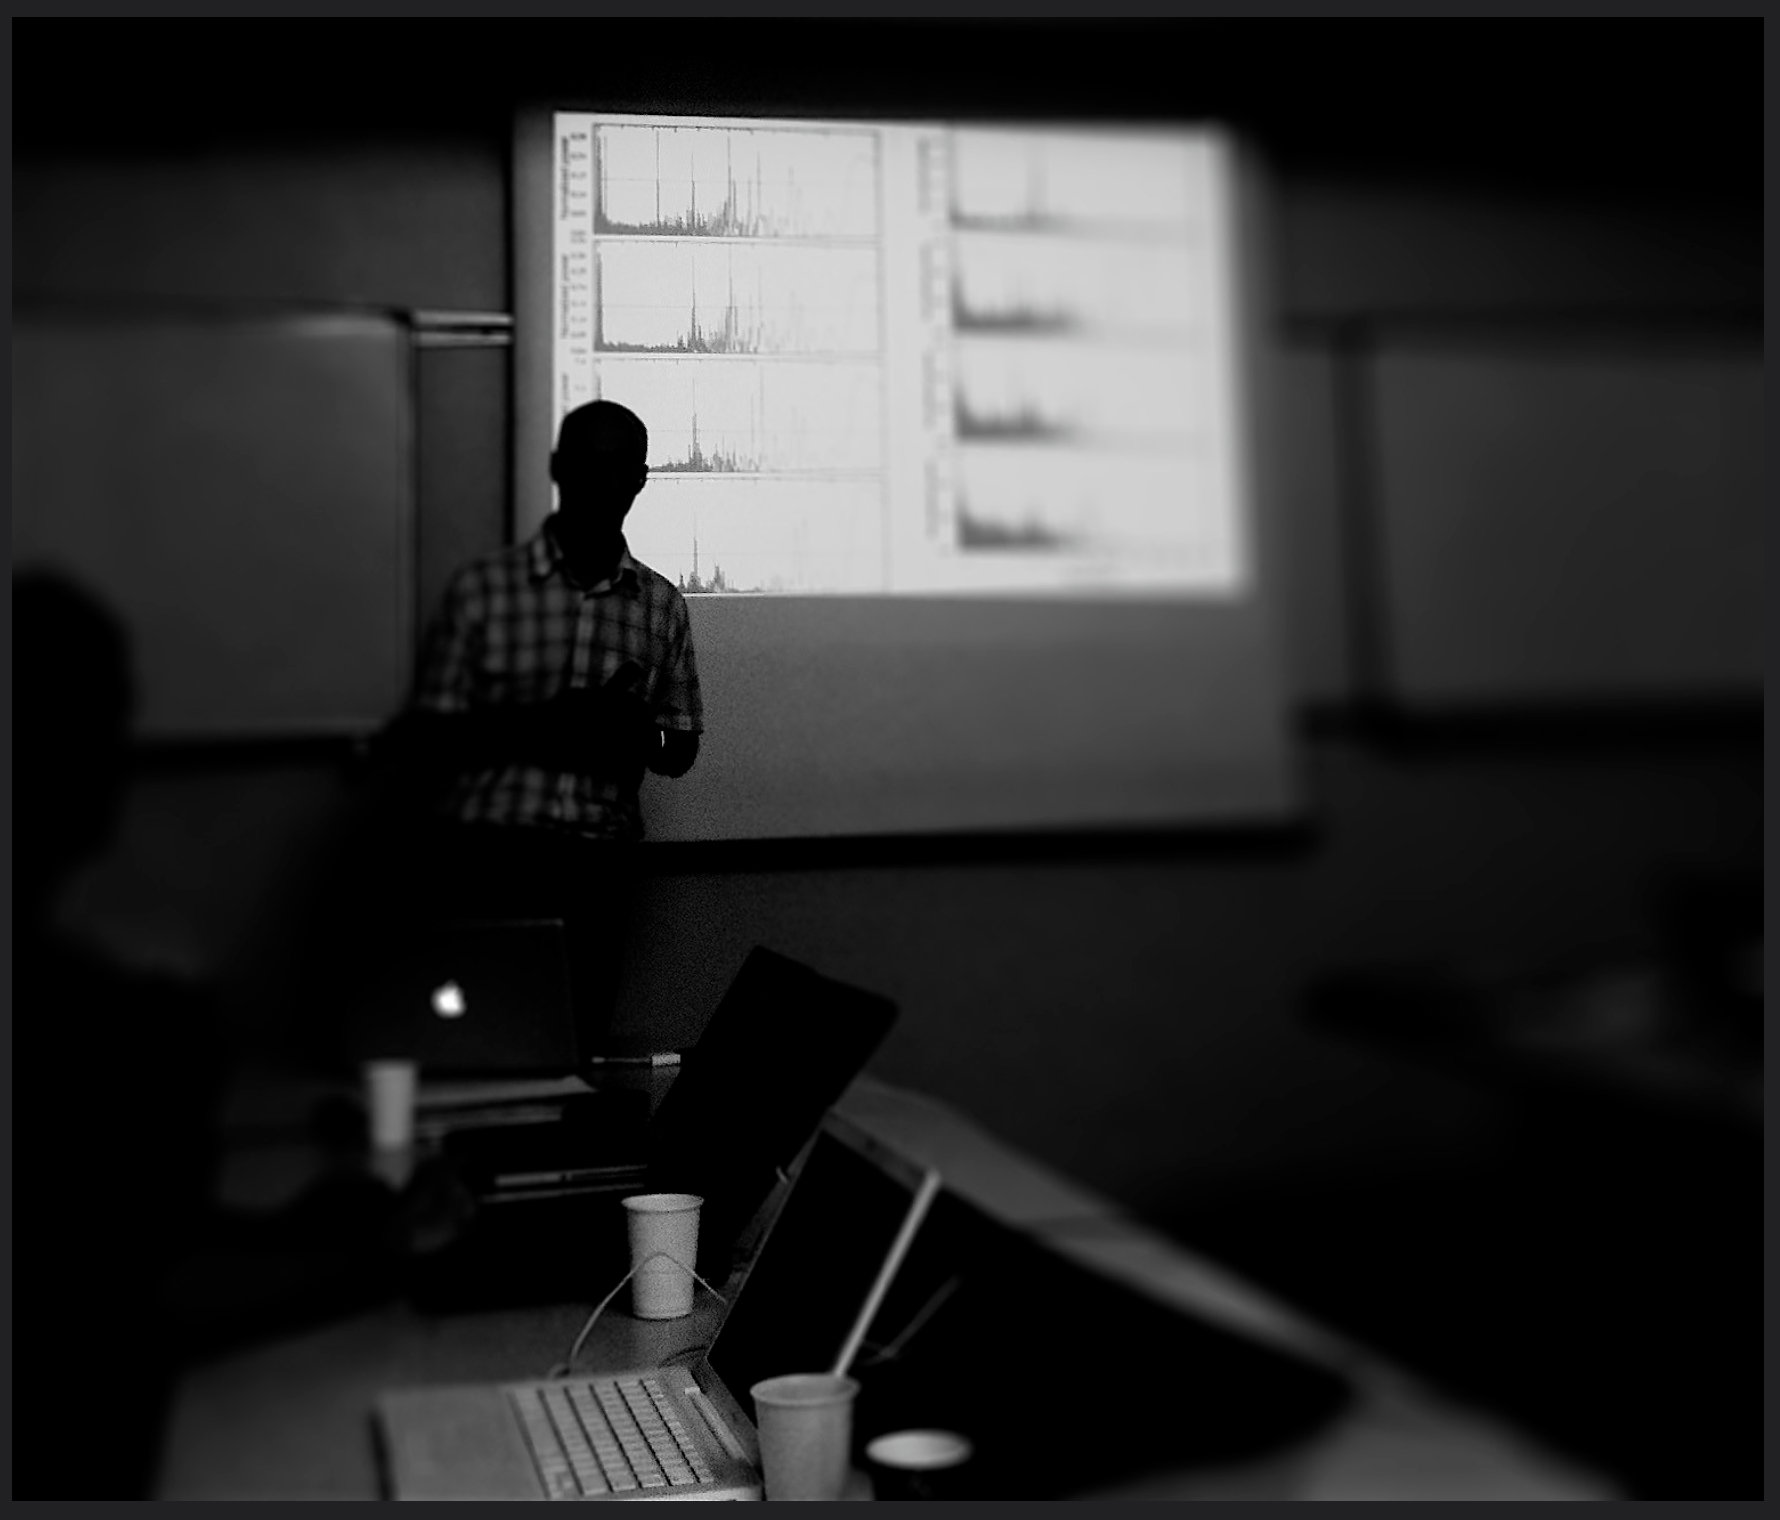
Jetliner –From the boarding lounge at SFO, just prior to departure to Paris. My laptop contains the the high-resolution Keck radial velocities for Gliese 876. One of the goals is to figure out what is going on in that system, and what better venue than the Bureau of Longitudes (now IMCCE) at the Paris Observatory?On the RER train from the Airport to the City — On the airplane, I worked on my talk until the laptop’s battery died. I knew there would be a lot of skepticism. Extraordinary claims…Laplace Resonance — Five additional years of Doppler monitoring, along with a much-improved template spectrum, have revealed a Uranus-mass planet in the Gliese 876 system. The new planet, with a period of just over 120 days, joins the previously known 30-d and 60-d planets in a three-body Laplace resonance. The dynamics of the resonant argument are analogous to those of a lightly driven double pendulum. During the past 5 billion years, the total amplitude of the “swing” has random walked to 40 degrees. In another 20 billion years or so, the libration width will grow to 180 degrees, the resonant lock will be broken, and the system will go haywire. The red dwarf parent star, however, will stay calm in the face of familial disaster. It’s set to last for close to a trillion years before exhausting its hydrogen and evolving into a helium white dwarf. The only other known example of a Laplace resonance is exhibited by Io, Europa and Ganymede. In the Jovian system, tidal dissipation has damped the amplitude of the “pendulum” swing to a tiny 0.064 degrees.La Ville-Lumière — At a scale where Earth is a sand grain, the distance between California and Paris is analogous to the distance between the Sun and the red dwarf star Gliese 876. Strange to be concerned with something that’s so far away.Seven Planets — The Geneva Team showed some of their new results, including a remarkable system with seven planets, the smallest of which has a mass (times sin i) of only 1.5 Earth Masses. The name of the star was redacted, but based on the properties and other clues in the talk, my guess is that the parent star will turn out to be Henry Draper Catalog star #101XX, or possibly Henry Draper Catalog star #1475XX.Ancien Régime — At mid-morning, the tranquility of the Observatory grounds was shattered by the diesel roar of generators and the clangorous shouts of workmen. The tree-lined promenade along the Paris Meridian leading up to south-facing Cassini Room had been rented out to Lacoste in order to stage a runway show.Contre Allée — At the close of the meeting, we were treated to an exquisite dinner in this restaurant just outside the observatory gate. The photographs were taken at a 1980s nightclub, then left undeveloped for twenty five years.
For up-to-the-minute developments on Malbolge, see oklo.org’s Malbolge Board.
A page from the mysterious Voynich Manuscript at Yale’s Beinecke Rare Book and Manuscript Library
Oklo dot org certainly wouldn’t be considered a heavily trafficked website, but given that it’s been on line for more than sixteen years, it does attract a uniformly steady trickle of visitors. Examining the Google Analytics, one notices curious ebbs and flows of activity, and one item stands out: This 2013 post, on the esoteric programming language Malbolge attracts of order ten visits per day with remarkable consistency. It’s not fully clear why.
Quoting from the 2013 post, which in turn drew from the Wikipedia article of that era,
Malbolge is a public domain esoteric programming language invented by Ben Olmstead in 1998, named after the eighth circle of hell in Dante’s Inferno, the Malebolge.
The peculiarity of Malbolge is that it was specifically designed to be impossible to write useful programs in. However, weaknesses in this design have been found that make it possible (though still very difficult) to write Malbolge programs in an organized fashion.
Malbolge was so difficult to understand when it arrived that it took two years for the first Malbolge program to appear. The first Malbolge program was not written by a human being, it was generated by a beam search algorithm designed by Andrew Cooke and implemented in Lisp.
Due to its finite number (3^10) of memory locations that each hold a ten-‘trit’ ternary number, the classical specifcation of Malbolge is not Turing complete. A version, however, known as Malbolge Unshackled that is now understood to be Turing complete was released in 2007.
Indeed, in the interval following the 2013 post, it develops that there has been significant progress on Malbolge. Key advances were made by Lou Scheffer, who elucidates the critical realization on his website:
The correct way to think about Malbolge, I’m convinced, is as a cryptographer and not a programmer. Think of it as a complex code and/or algorithm that transforms input to output. Then study it to see if you can take advantage of its weaknesses to forge a message that produced the output you want.
And with that, a strange world just over the horizon begins to congeal in the mind’s eye. A Malbolge program, viewed in this manner is not unlike an inefficient, inherently compromised cousin to the SHA-256 hash. One imagines bizarre blockchains. Esoteric cryptocurrencies. NFTs.
Exploiting weaknesses in the language, Scheffer demonstrated existence of a program that copies its input to its output, effectively performing the Unix echo command. The source (uu-encoded) looks like this:
Over the past two years an amazing additional development has taken place. At her GitHub site, Kamila Szewczyk has published a LISP interpreter written in Malbolge Unshackled. The interpreter takes a LISP program, executes it, and displays the result. The abstract of her accompanying paper reads:
MalbolgeLISP is the most complex Malbolge Unshackled program to date (2020, 2021).
Unlike other Malbolge programs generated by different toolchains (for instance, LAL, HAL
or the ”pseudo-instruction” language developed by the Nagoya university), MalbolgeLISP
can be used to express complex computations (like folds, monads, efficient scans, iteration
and point-free programming), while being able to run within reasonable time and resource
constrains on mid-end personal computers. The project aims to research not the cryptanal-
ysis aspect of Malbolge, but its suitability for complex appliances, which could be useful for
cryptography and intellectual property protection, and it would certainly raise the bar for
future Malbolge programs while exploring functional and array programming possibilities
using inherently imperative and polymorphism-oriented Malbolge code.
Time to get to work on the Malbola white paper and issue a coin.
April 2025: To see the details of our cryptographic attack on the Voynich text, see this Oklo post.
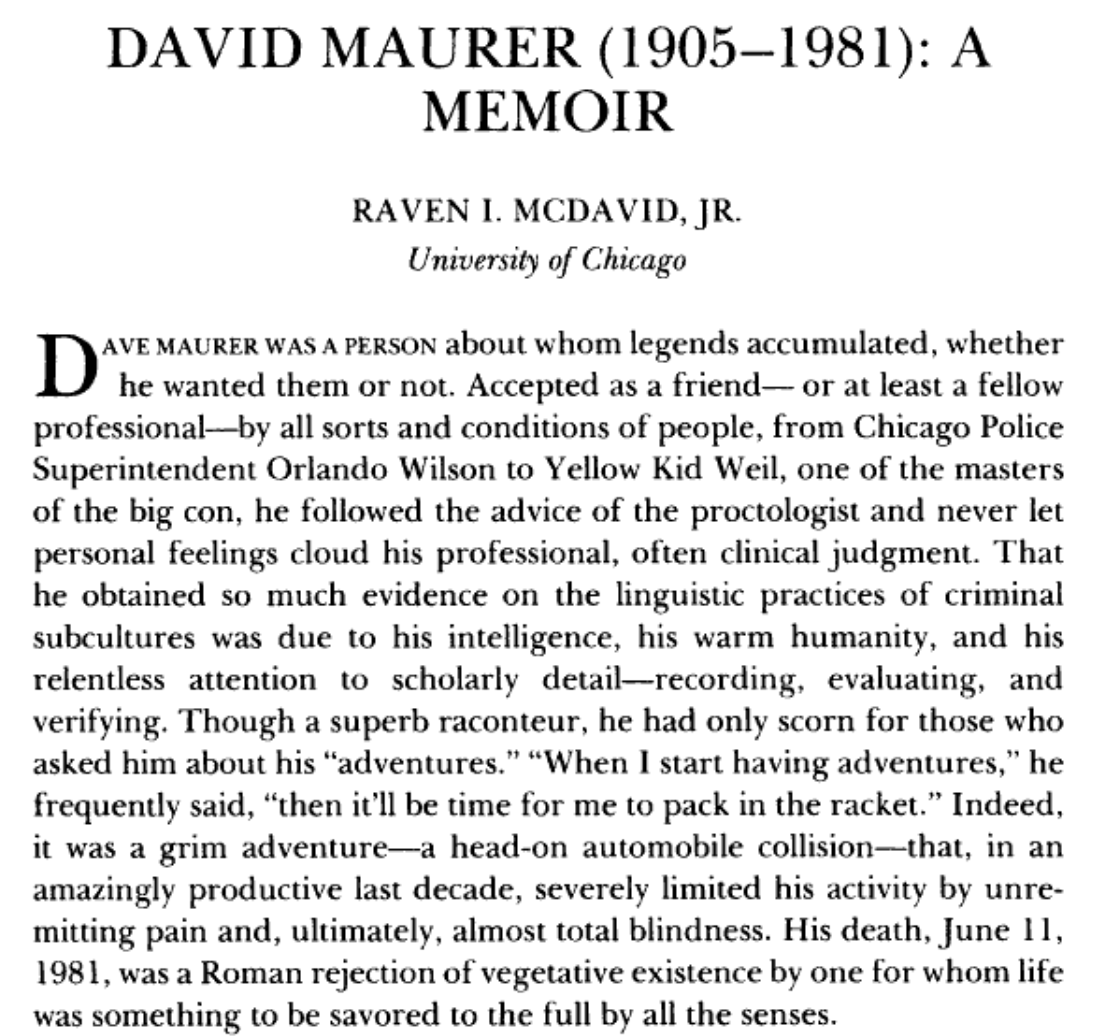
For a change of pace in one’s academic reading, I recommend the late University of Chicago Professor Raven I. McDavid Jr.‘s 1981 memoir of his colleague David Maurer. Both gentlemen were deeply invested connoisseurs and leading authorities on vernacular English — that is, slang. The opening lines of McDavid’s memoir inAmerican Speech, vol. 57, No. 4 (Winter, 1982) invite a click on the JSTOR link to the full text.
Maurer’s books are all very much worth reading, but they reach an apex with The Big Con — The Story of the Confidence Man, which was published in 1940, and recounts, in straight-narrative detail, the elaborate confidence games that flourished throughout America during the decades bracketing the First World War. Maurer expertly works the lexicon of swindling into a narrative that sparkles on the page. In the rundown on operation of the big store, we find passages such as:
“…And most important of all, he has official custody of the “B.R.” or boodle. This is the money which is used to play the mark in the store. For this purpose, a minimum of about $5,000 is necessary, but the more the better; in the really big stores the boodle may contain a large sum of cash, perhaps as much as $20,000. This money is made up in bundles presumably containing $500, $1,000, $5,000, etc., but really composed of one-dollar bills for filler and having $50, $100, or $1,000 bills on the top and bottom to make the stack look real. Each bundle is stacked carefully and bound with sealed labels like those used in banks for marking bundles of bills, A rubber band around each end holds the pack together. When a skillful manager makes up his boodle, he can make $10,000 in real cash look like several hundred thousand dollars. This money is used over and over again by the shills in placing bets and is paid out again to them when they win. The idea is to keep as much money circulating before the eyes of the mark as possible.”
The larcenous attraction of a stack is undeniable. T.I., Rubber Band Man, Lil Wayne, …gotta hand full of stacks…, are channeling the precise appeal that led the marks of a century ago to part ways with their money to the charms of expert insidemen.
Remarkably, the pleasing qualities of the stack have been recognized not just by extravagant rappers, but also within that buttoned-up and soberly scientific realm of periodograms of time series data.
The numerical ratio of the stable oxygen isotopes, 18O and 16O, provides a nonlinear proxy for global temperature. Broadly speaking, an increased fraction of 18O in a deposited layer corresponds to a cooler climate, with more of Earth’s water locked up in the form of ice. A time series for the ratio spanning the last tens or hundreds of thousands of years can be obtained from ice cores from Greenland or Antarctica, but if one is interested in longer intervals — out to millions of years — sediment cores from the deep oceans provide the best measure.
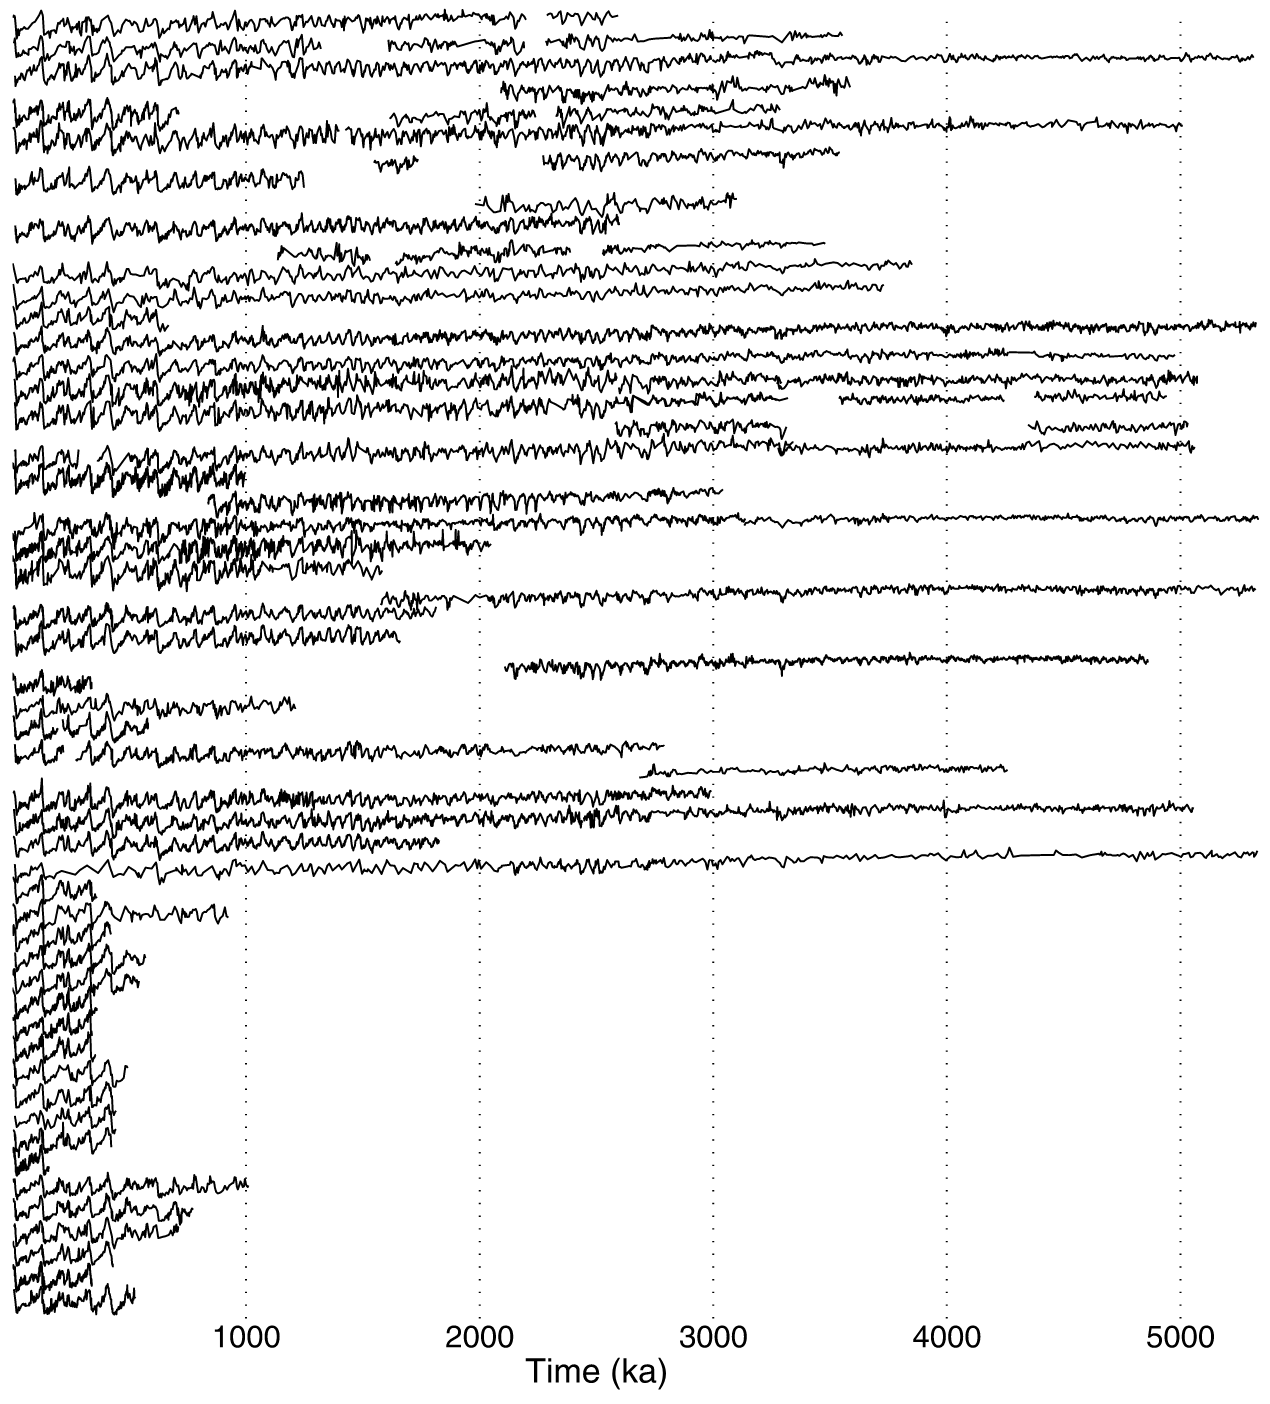
In a 2005 paper that has accumulated a stack of over seven thousand citations, Lisiecki and Raymo demonstrate the dramatic utility of stacked periodograms. They gathered finely-sampled depth-runs of delta-18O measurements from 57 drill sites spread out over the World’s oceans.
Depending on the site, the sequences in some cases extend back in time by more than five million years. When properly stretched and squeezed to account for variations in deposition rate with time and location, the resulting stack of delta-18O time-series looks like this:
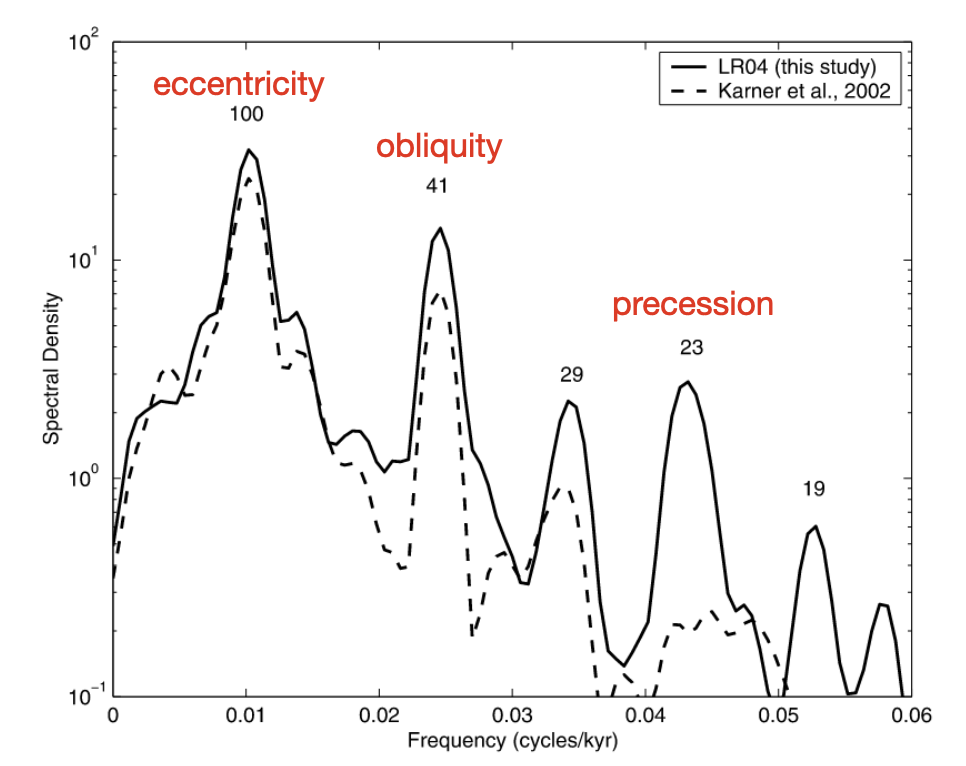
The individual sedimentary records look awfully squiggly, but when the pile is combined and Fourier-analyzed, the overall effect recalls that $100 bill expertly rubber-banded onto a stack of singles. The periodogram of the stacked time series shows a succession of clear-cut peaks.
The power at 23 kyr represents the climate forcing induced by the precession of Earth’s axial tilt. The 41 kyr peak is caused by the excursions in Earth’s orbital tilt (which varies between about 22.1 and 24.5 degrees), and the large peak with 100 kyr periodicity arises from variations in Earth’s orbital eccentricity — the influence of Venus, Jupiter and Saturn accumulating in slow rains of foraminifera through the depths.
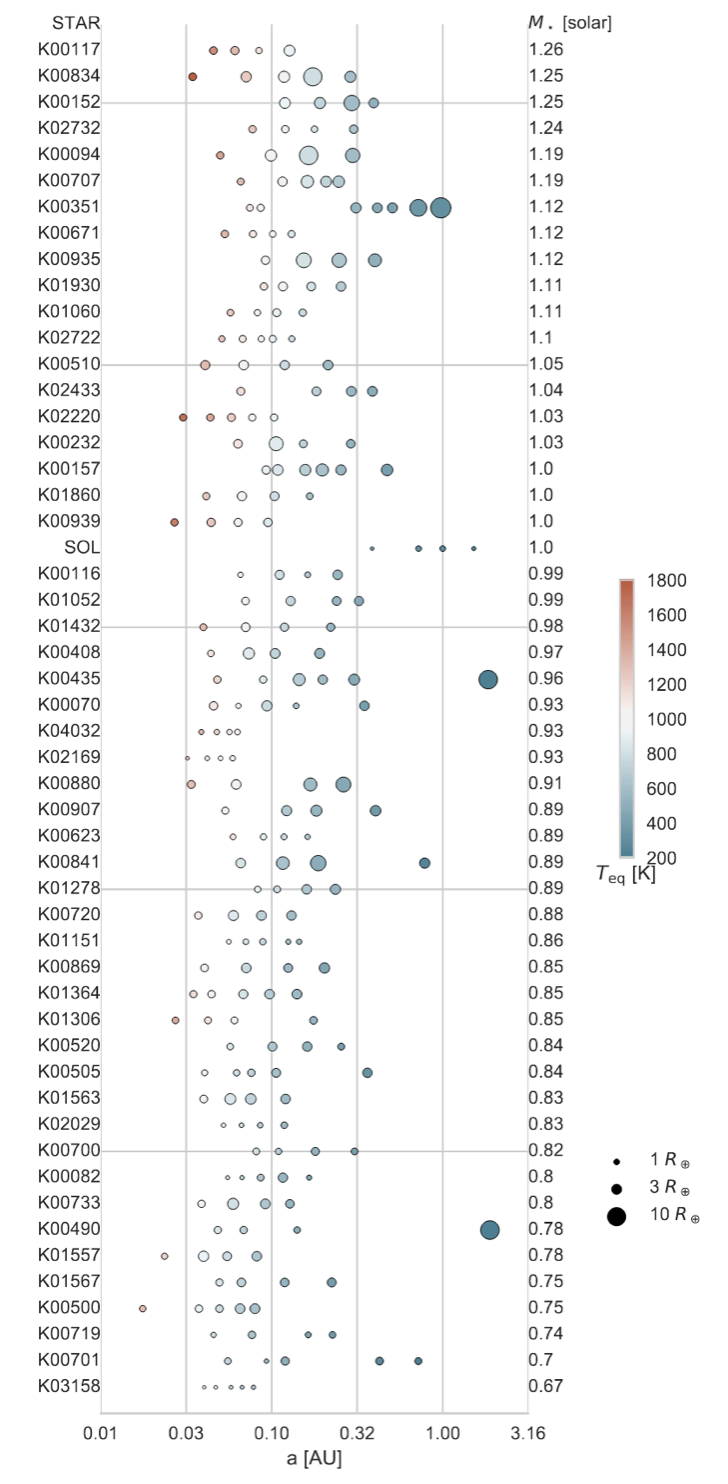
Stack appeal is certainly at work in the now-famous peas-in-a-pod diagram published by the California Planet Search Team.
The Kepler multiple-transiting systems were all well-known for years before the CPS paper was published. Yet it took the simple expedient of a stack running nearly a full column down the journal page to open one’s eyes to an emphatic realization. When the orbital periods run from days to weeks, a given system prefers to manufacture a single characteristic type of planet, arrayed logarithmically evenly in a clutch of four or so. This is the single most important result that has emerged from three decades of planet detection.
Over the years, the transit detection technique has come to dominate the production of worlds for the planetary catalogs. While remarkably effective, the method does have drawbacks. It works only when geometric alignments are close to perfect, and it gives radii (or planet-star radius ratios) rather than masses.
For the cohort of planets in multiple-transiting systems that lie close to low-order mean-motion resonances, planetary masses can be estimated by fitting to the transit timing variations. Curiously, planets measured using this approach tend to have substantially lower densities than the subset of transiting planets whose masses (or rather M sin i‘s) have been extracted directly using the classic Doppler wobble technique.
In general, for systems like the ones in the diagram above, one would require relatively massive planets and a cooperative low-activity host star to get an accurate set of M sin i’s from radial velocities alone. Spectacular examples do exist, of course, and one can find me enthusing about the various discoveries if one scrolls back through the stack of posts that has accumulated over the years, especially during the late aughts.
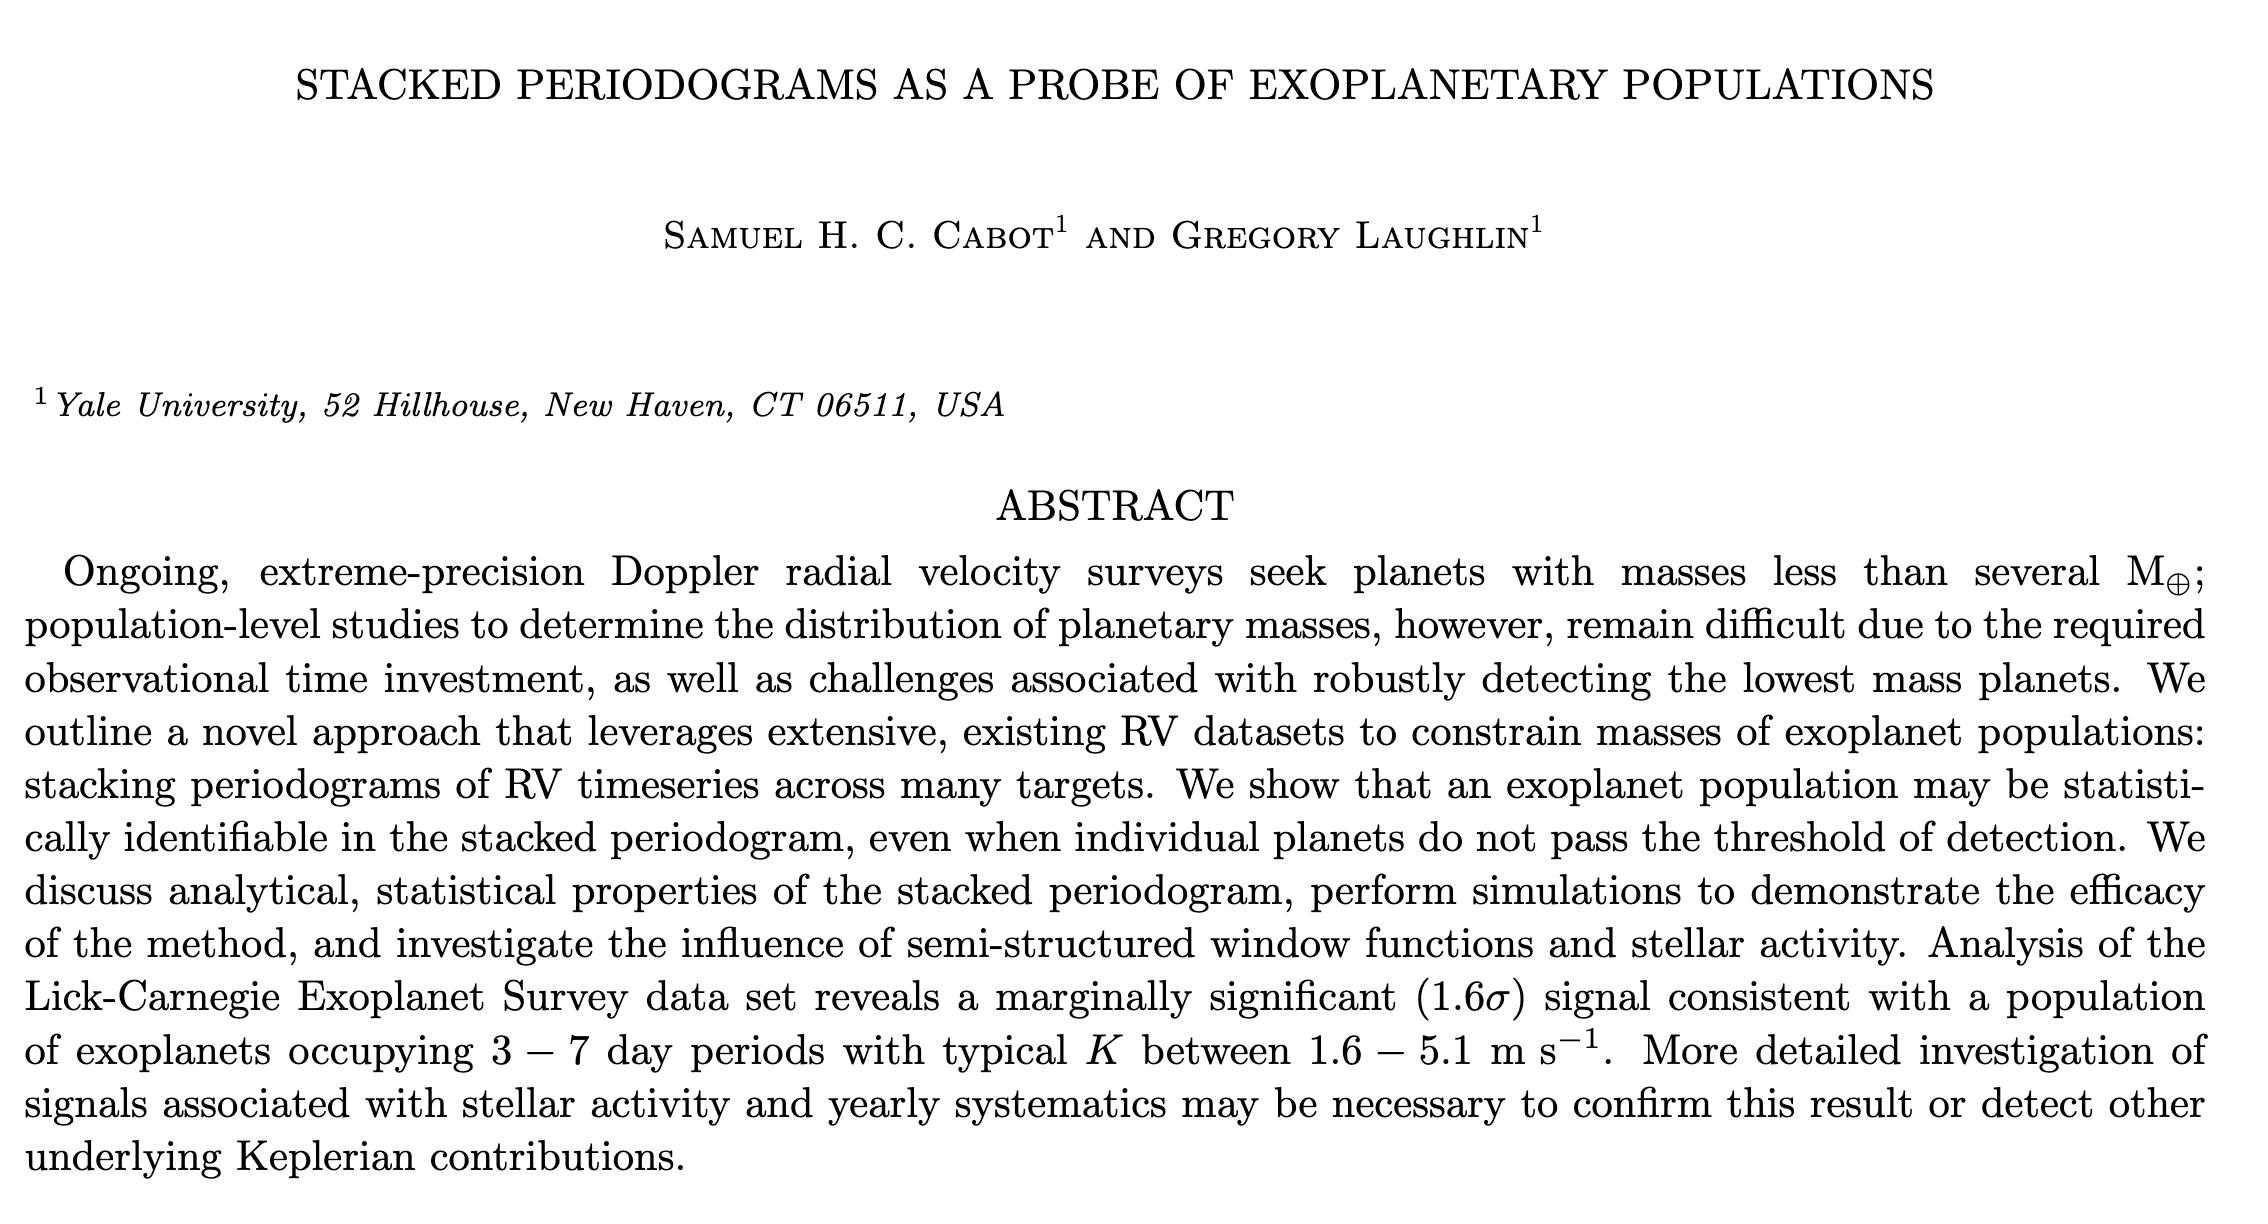
In a recently published paper, Yale graduate student Sam Cabot and I took inspiration from Lisiecki and Raymo’s runaway benthic delta-18O success and asked the following question: What if you clear the known planets from the radial velocity data that has been accumulated over the years and stack the resulting periodograms? Will the cumulative signature of all the peas-in-pods lurking in the data be visible?
Satisfyingly, the answer, to 1.6-sigma confidence, is yes.
For a number of years now, I’ve been a member of an academic collaboration devoted both to studying Internet latency and to designing schemes to generally speed things up on-line. At the end of 2018, our group received an NSF grant to facilitate this research work. Now, three years later, it’s time to submit the final report. As part of the NSF’s close-out process, an accessible research outcomes summary for the general public (containing up to 800 words, and including up to six images) is required. This sounds like a spec list for an oklo.org item, so I’m posting a slightly expanded draft version here.
Everyone knows the frustration of a page that seems to take forever to load. Moreover, even when the interlaced networks that comprise the Web function nominally to deliver requested assets, there exist Internet applications that would benefit dramatically from reduced latency. Examples of such time-sensitive endeavors run the gamut from telepresence and virtual reality to header bidding and blockchain propagation.
At a fundamental level, network speeds are limited by the finite velocity of electromagnetic waves — the speed of light. The maximum propagation speed for light occurs in vacuum. Light is slowed down in air by a negligible amount (0.03%), but in the conventional solid-core fiber optic cables that currently carry the bulk of Internet traffic, light travels at only about 2/3 of the vacuum maximum. Over long distances, and when many back-and-forth exchanges of information are required, this signaling slowdown becomes material. In addition, the actual over-land and under-sea paths taken by cables are often substantially longer than the minimum A to B distance between data centers.
Over the last decade, there has been a flurry of construction of long-haul line-of-sight microwave networks that adhere as closely as possible to great-circle paths. These are operated by latency-sensitive trading firms, who, in aggregate, have mounted significant research and development projects to create global information circuits that are as fast as possible, while simultaneously maximizing bandwidth and uptime.
How feasible would it be to take the lessons learned and apply them at scale to speed up the Internet as a whole? This is a tricky question to answer because the fastest existing long-distance networks were entirely privately funded and their performance remains fully proprietary. Just how fast are they, really? How well do they hold up when weather moves through? How much data can they carry?
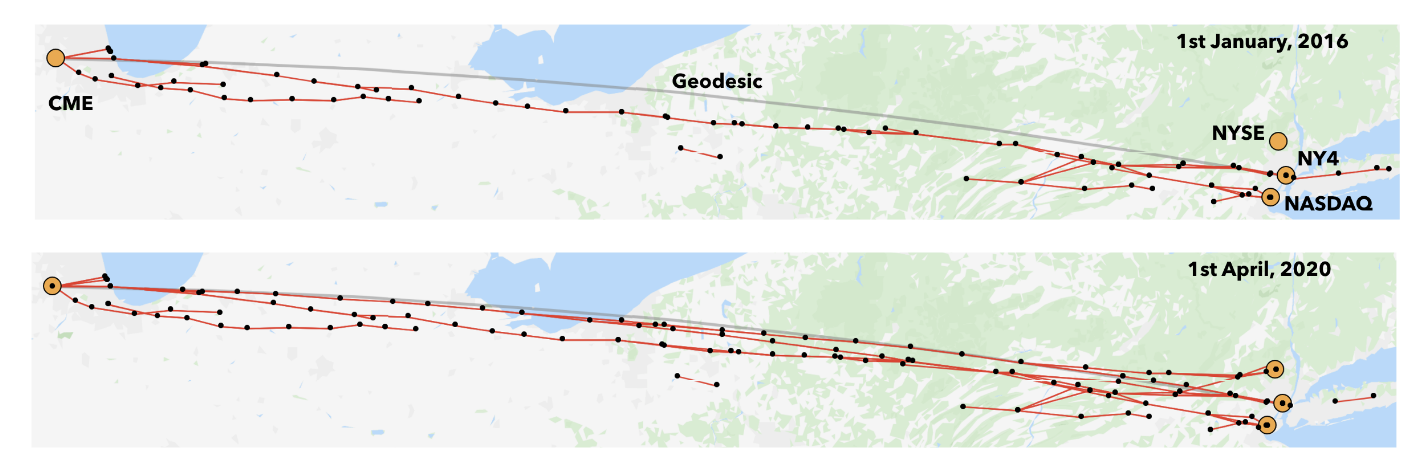
Government database scraping provides a first approach to evaluate the performance of the ultra-low latency networks. In the US, if one wishes to communicate with microwaves, one needs a broadcast license. The FCC maintains a publicly-searchable list of all licenses and licensees, and this data can be assembled to monitor the construction, consolidation, and improvement of point-to-point networks. The figure just below, from our 2020 paper, shows two snapshots in the evolution of the New Line Network, which connects the CME data center located in Aurora, Illinois to the trading centers of suburban New Jersey. Over time, the New Line has clearly grown to provide ever more bandwidth at ever higher availability with a shortest path that adheres ever more closely to the geodesic.
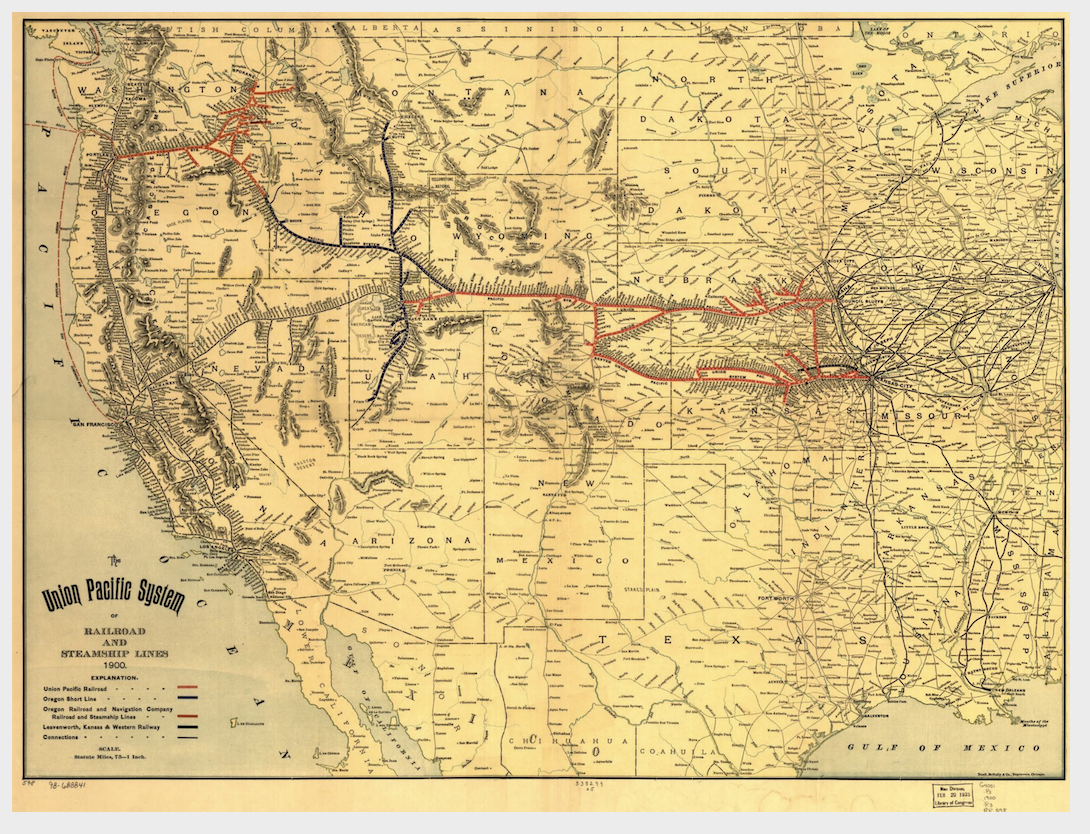
The development and build-out of speed-of-light networks has significant parallels with the emergence of transcontinental railroads during the Nineteenth Century.
The Union Pacific system of railroad and steamship lines, 1900. Library of Congress
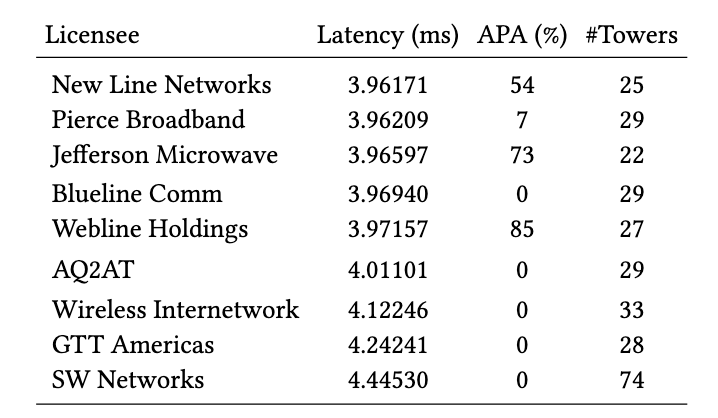
In April of 2020, in the licensed microwave bands, there were nine separate FCC-registered networks spanning the Chicago to New Jersey Corridor and linking the CME to the NY4 data center that hosts a variety of equity and options exchanges. The New Line, with a 3.96171 millisecond path-latency (compared to a geodesic minimum latency of 3.955 ms) is seen to be neck-and-neck with several competitors:
In the above table, APA stands for Alternate Path Availability, and indicates the fraction of links that can be removed (for example by heavy rain) such that the path latency of the remaining network is not more than 5% greater than the speed-of-light minimum.
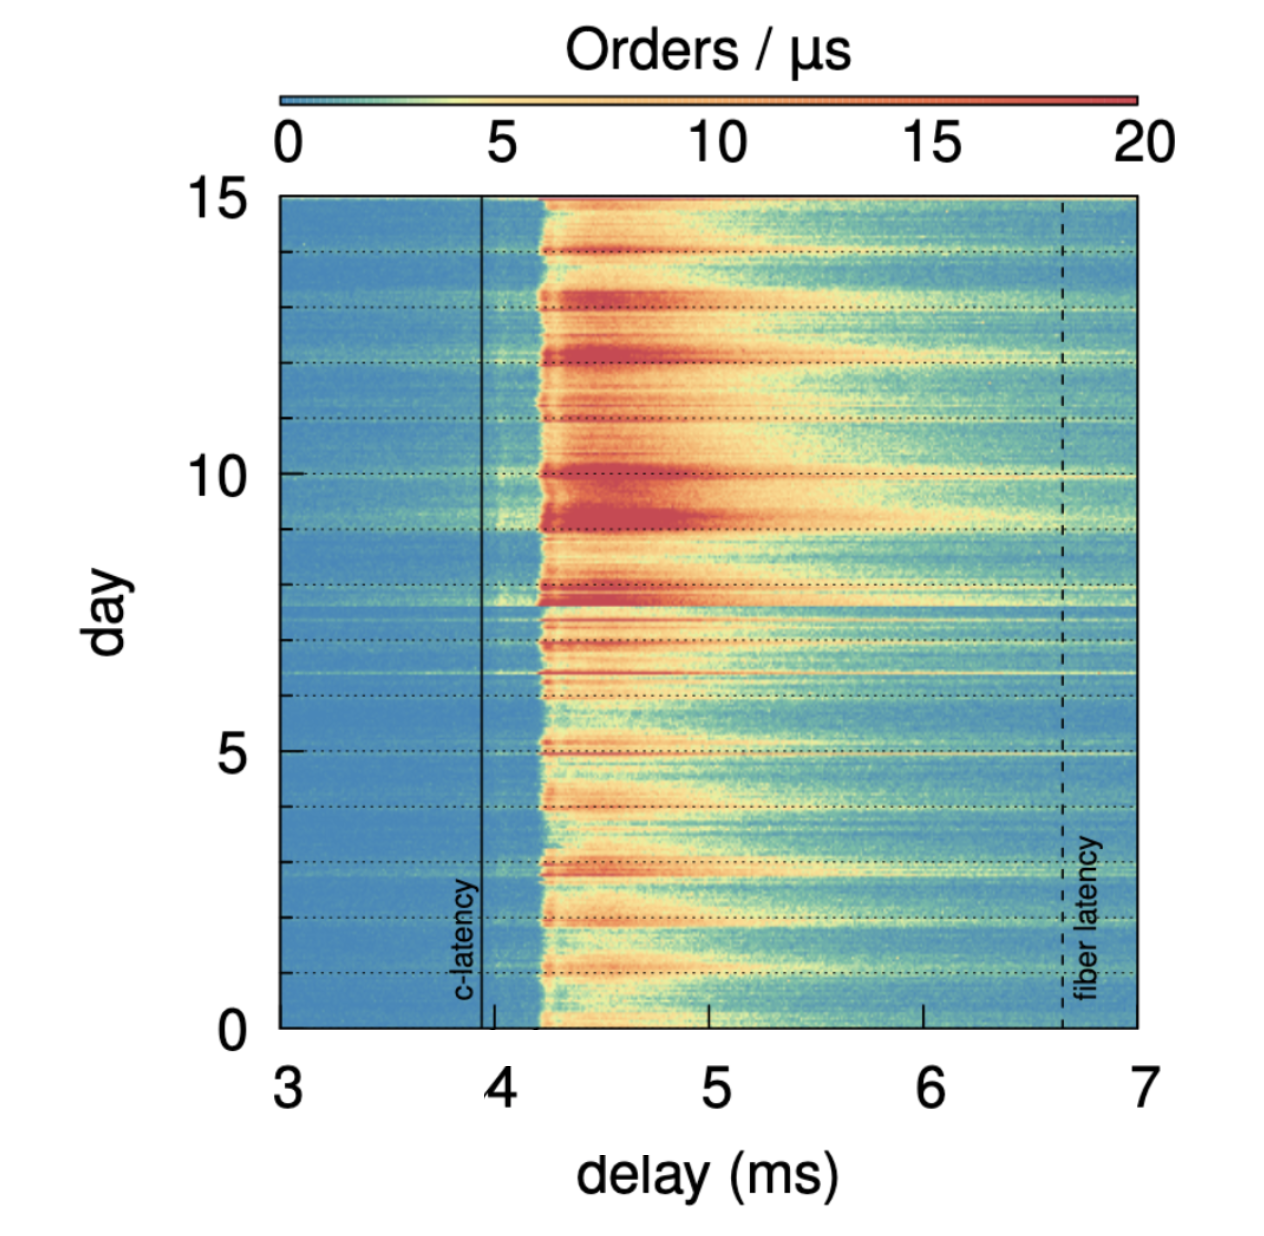
A completely independent monitoring technique consists of correlating precisely time-stamped trading data from Chicago and New Jersey, and measuring the statistical delay between events that occur at one end of the network, and the responses that occur at the other end. As part of the capstone paper for our NSF-funded research, we undertook this analysis using gigabytes of tick data for the E-mini S&P500 near-month futures contract (that trades in Illinois) and the SPY S&P500 ETF (that trades in New Jersey). In work of this type, there are subtle issues associated with measuring the absolute lowest latencies at which information transport occurs across the relay; these subtleties stem from the operational details of the exchange matching engines. For the purpose, however, of demonstrating that the networks consistently run end-to-end within a few percent of the physical limit, even during periods plagued by heavy weather, the signal correlations measured over long stretches of trading provide a remarkably powerful network probe.
The timing of New Jersey response to Illinois events. Over three weeks of stock-market trading (sliced into 15-minute increments along the y-axis), word of price movements always traveled within a few percent of the speed of light, even when when the weather was inclement. This figure illustrates that a large-scale, nationwide speed-of-light network is a real operational possibility…
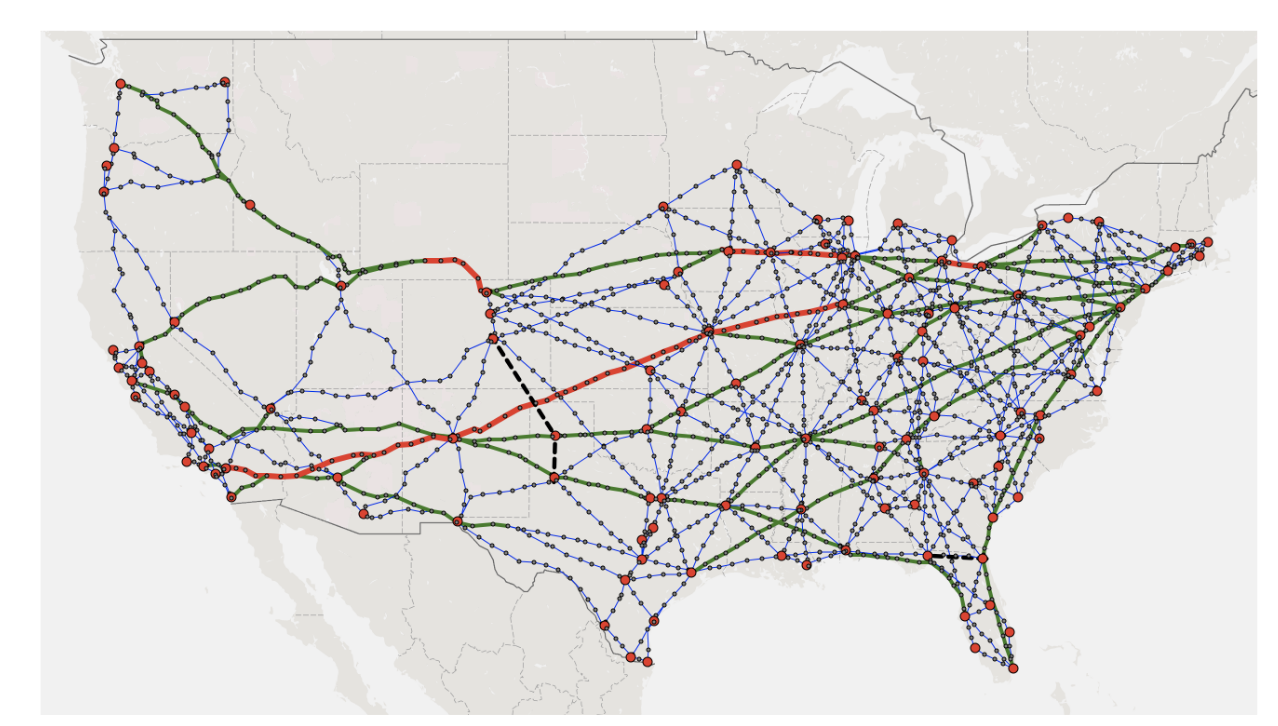
By taking these (and other) real-world insights into account, and applying them to a transcontinental network design, we’re excited to release — at the 19th USENIX Symposium on Networked Systems Design and Implementation Conference — our most up-to-date vision of what a speed-of-light Internet service provision (a c-ISP) could look like, and what its performance would be.
A 100 Gbps, 1.05×stretch network across 120 cities in the US. Blue links (thin) need no additional towers beyond those currently listed in the FCC database. Green (thicker) and red links (thickest) need 1 and 2 series of additional towers respectively. Black dashed links are fiber.
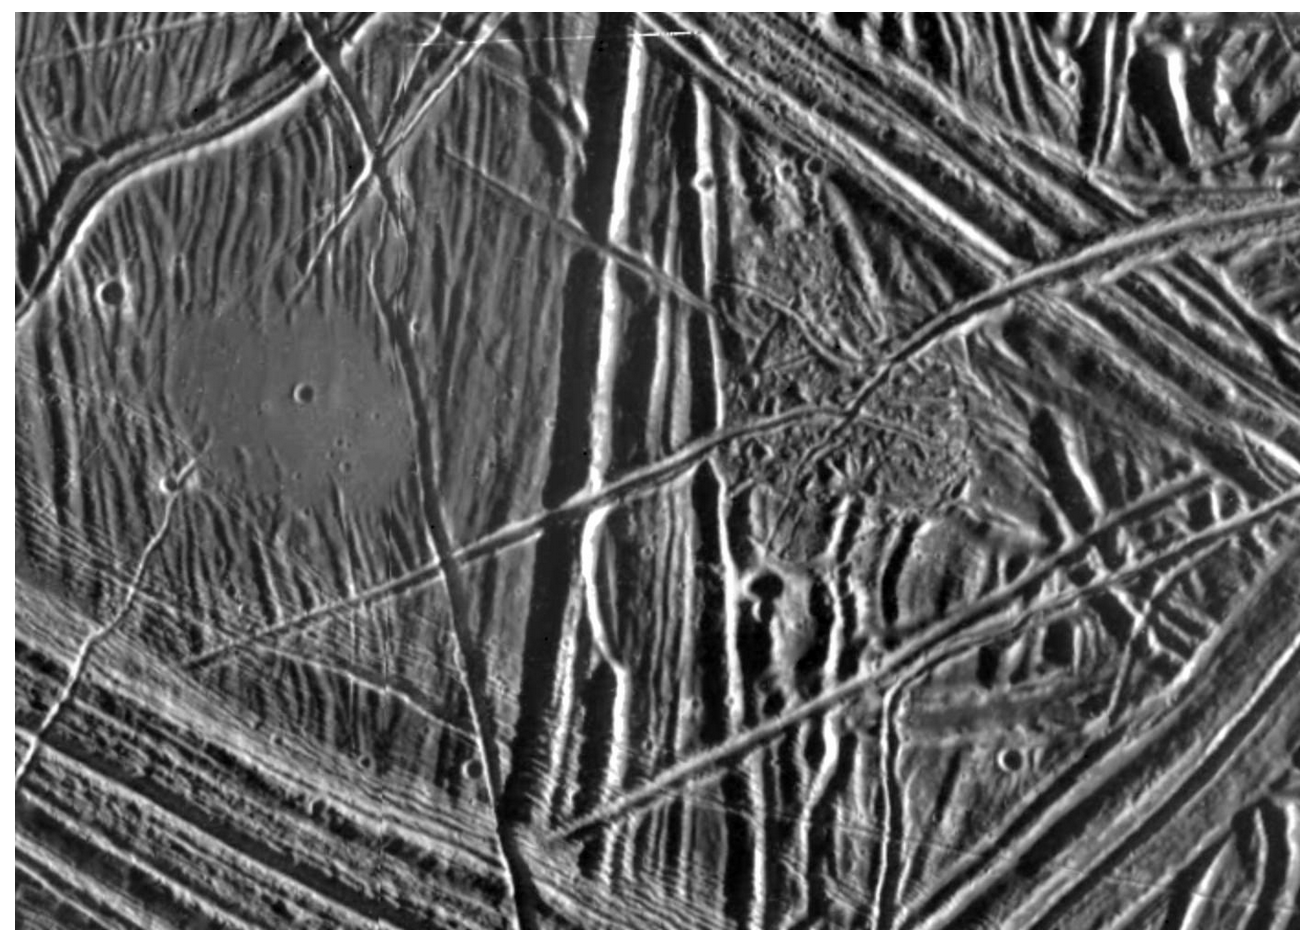
The headline images from Cassini at Saturn were the curtain sheets of water vapor and ice crystals erupting from the tiger stripe terrain of Enceladus’ south polar regions.
In the ensuing fifteen years, Enceladus has accreted a lot of habitability hype, so it’s easy to forget that it’s actually a very small satellite. Its diameter, in fact, is less than the driving distance between Hicks Dome and the Crater of Diamonds State Park.
With the small size comes a small escape velocity — 240 m/s — a typical jet airliner speed at cruising altitude. When liquid water welling up in tidally flexed cracks is exposed to the vacuum that surrounds Enceladus, the exit speed of the boiled-off molecules is fast enough that water molecules will readily random walk away from the satellite. The moon acts like a giant low-activity comet. No kimberlite-styled cryptoexplosions are required to launch the H2O into space, just exposure to liquidity when the cracks are forced open at the far point of the slightly eccentric (e=0.0047) orbit.
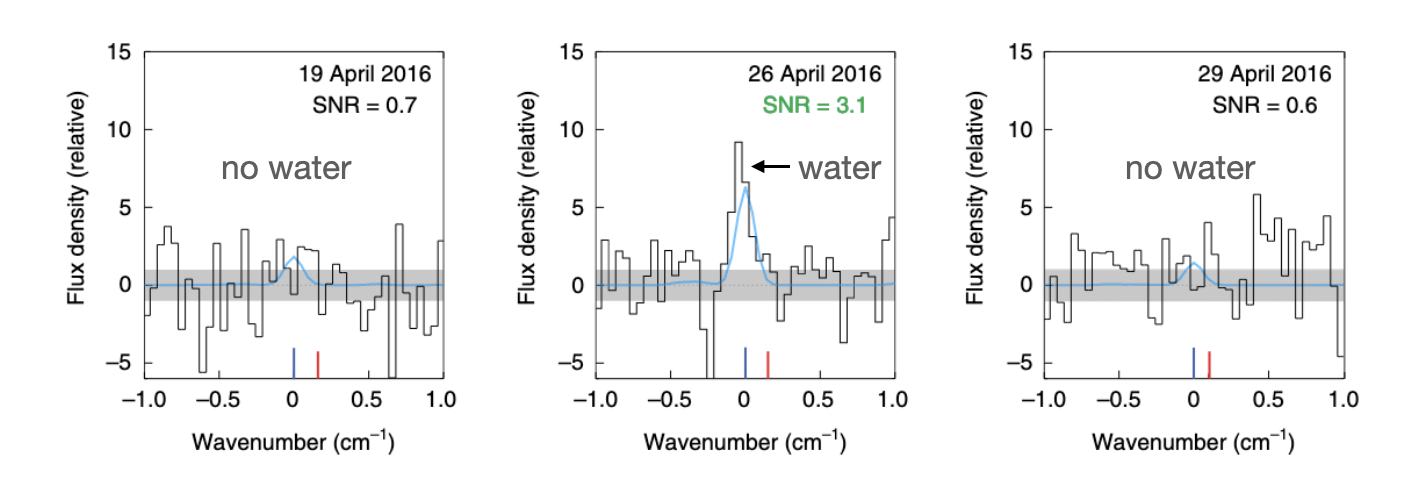
Jupiter’s Europa, by contrast, is an ice-covered world of far vaster extent. With its kilometers-thick ice shell, it should be keeping a tight lid on its depths, but curiously, evidence has emerged that water is somehow being transiently sprayed to heights of order 200 kilometers above the surface. A 2019 paper by Paganini et al. draws on a combined a set of Keck near-infrared spectral emission lines to support the conclusion that on one occasion out of seventeen, thousands of tons of water were fluorescing in Europa’s tenuous exosphere.
Two instances with no fluorescing water, one instance with fluorescing water (source).
Skeptics and cynics will be quick to remark that one 3-sigma measurement produced in seventeen tries works out to a 1 in 20 chance even with a perfectly normal distribution. And they’re right. Results that are weird and spectacular are generally wrong, and geysers on Europa providing astrobiology fans with fresh organic produce from ten kilometers down would appear to qualify on both counts. Nonetheless, Earth managed to rocket gem-quality diamonds from the mantle up into rural Arkansas, so a down-home precedent clearly exists. Furthermore, HST has captured evidence of UV emission from photolyzed water in the vicinity of Europa, which provides support to the one-in-seventeen result from Keck. Maybe eruptions actually are occurring on Europa?
A serious problem, however, lies in lofting the water to heights of 200 kilometers above the ice. That requires venting velocities of order 700 m/s, pointing toward regular full-blown cryptoexplosions.
Nicole Shibley and I recently published a paper that outlines how such a process could operate:
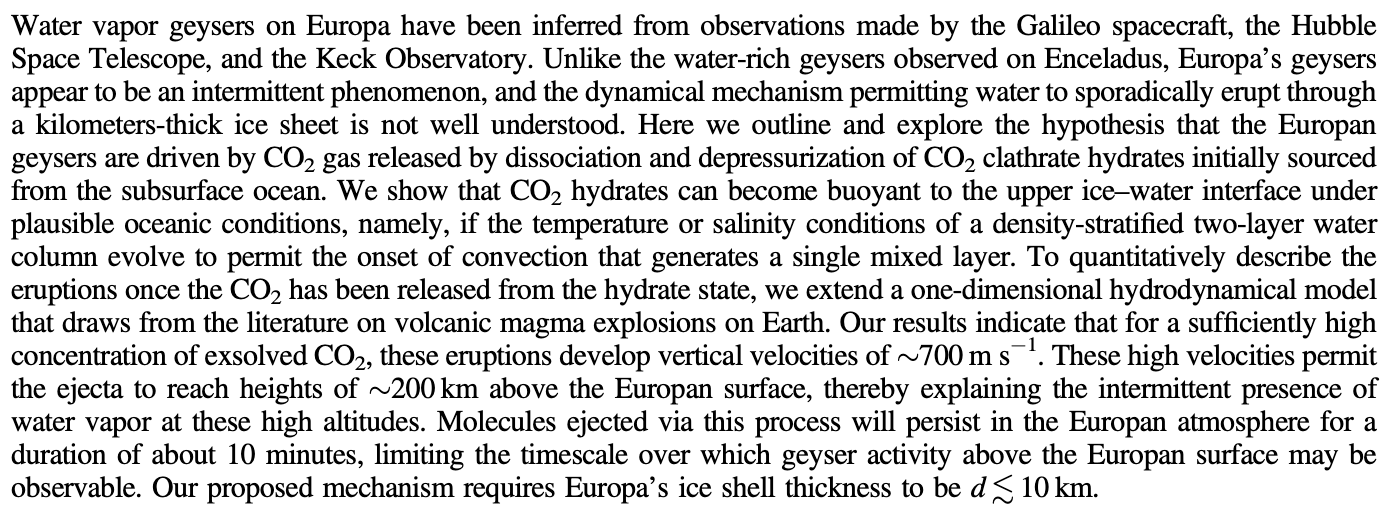
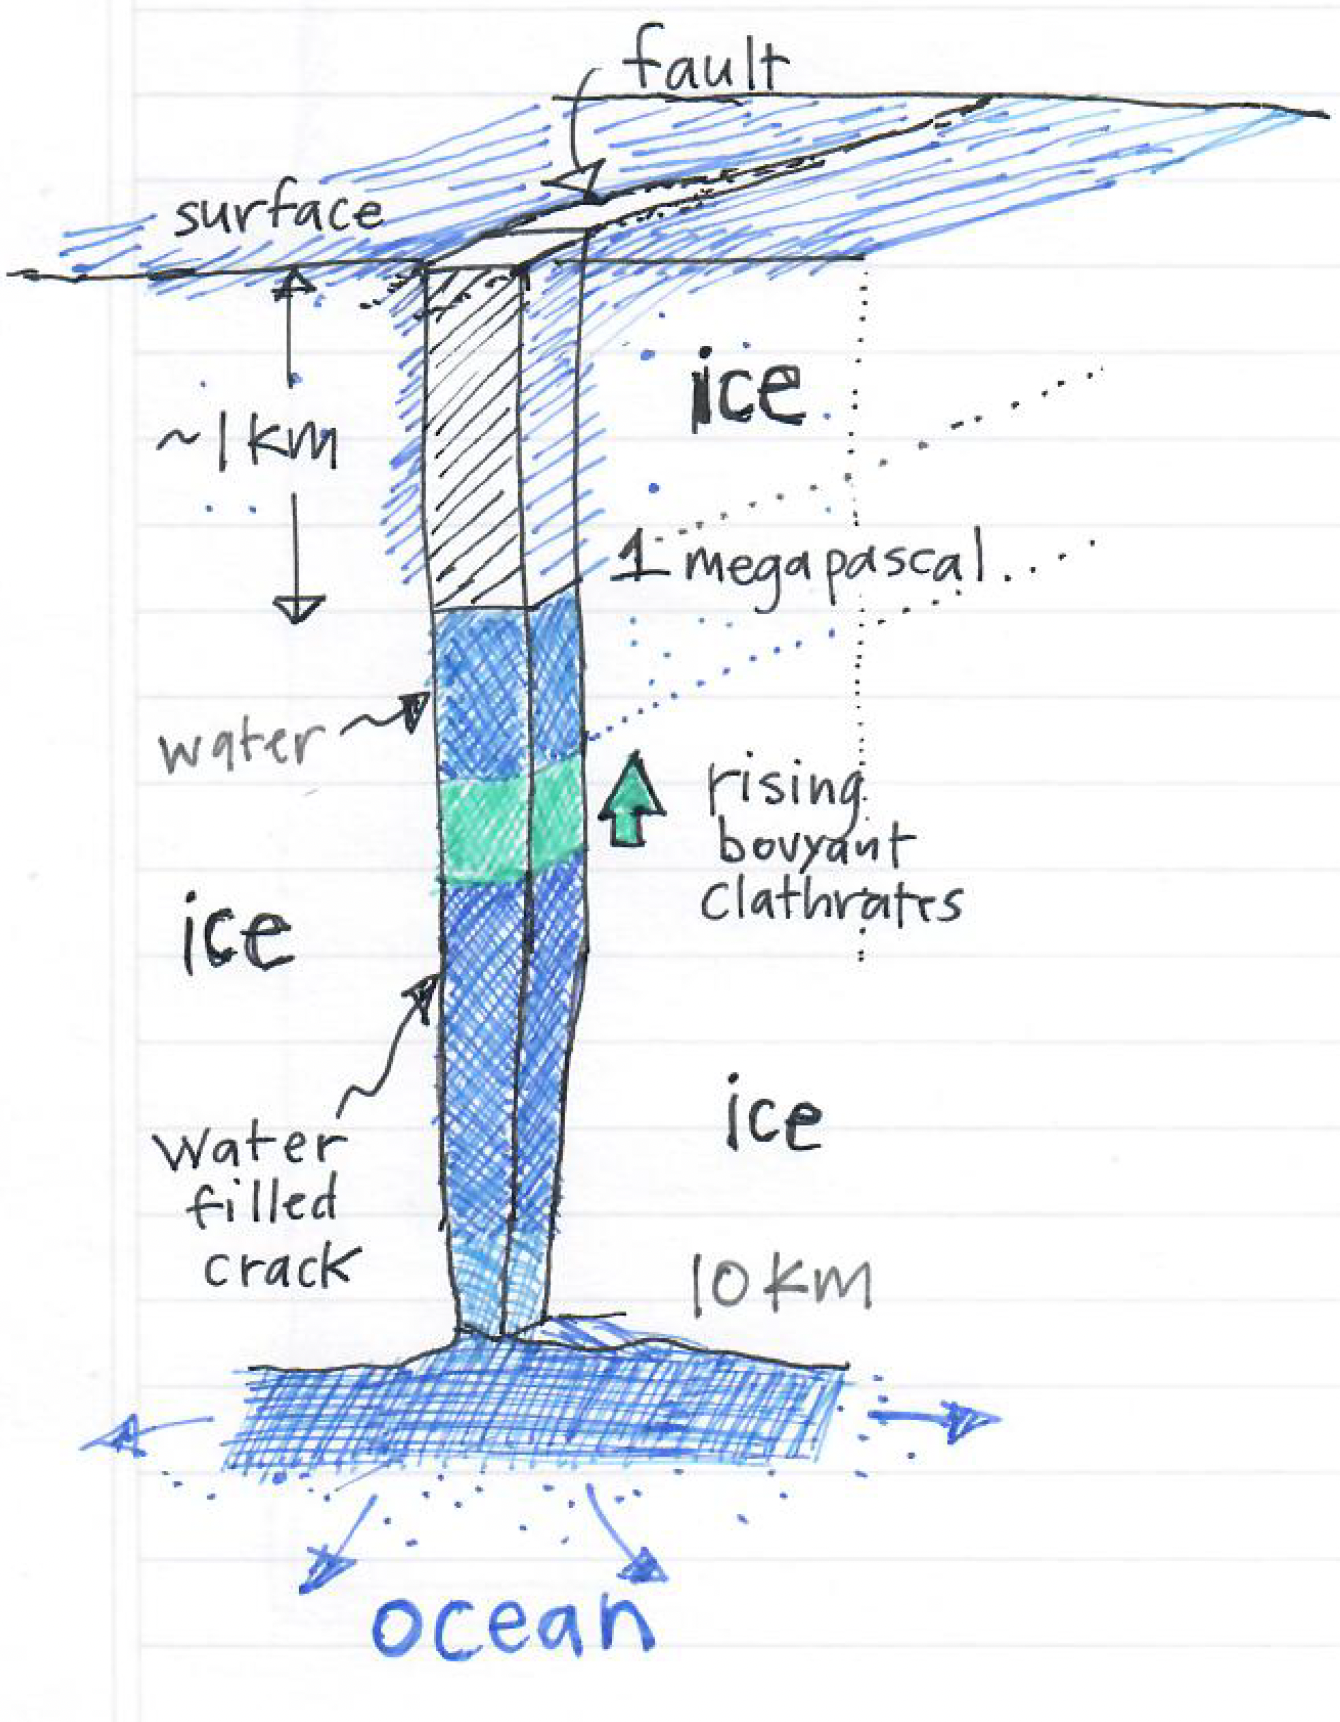
The cryptoexplosive mechanism is initiated by convective overturn in the Europan ocean, which permits clathrated CO2 to rise to the top of the water column and propagate into cracks. Once the clathrates ascend to within ten kilometers of the surface, the pressure is low enough so that they dissociate, producing explosions that are sufficiently energetic to send carbonated water to dizzying heights. The process, in fact, draws on the peer-reviewed literature on champagne cork dynamics.
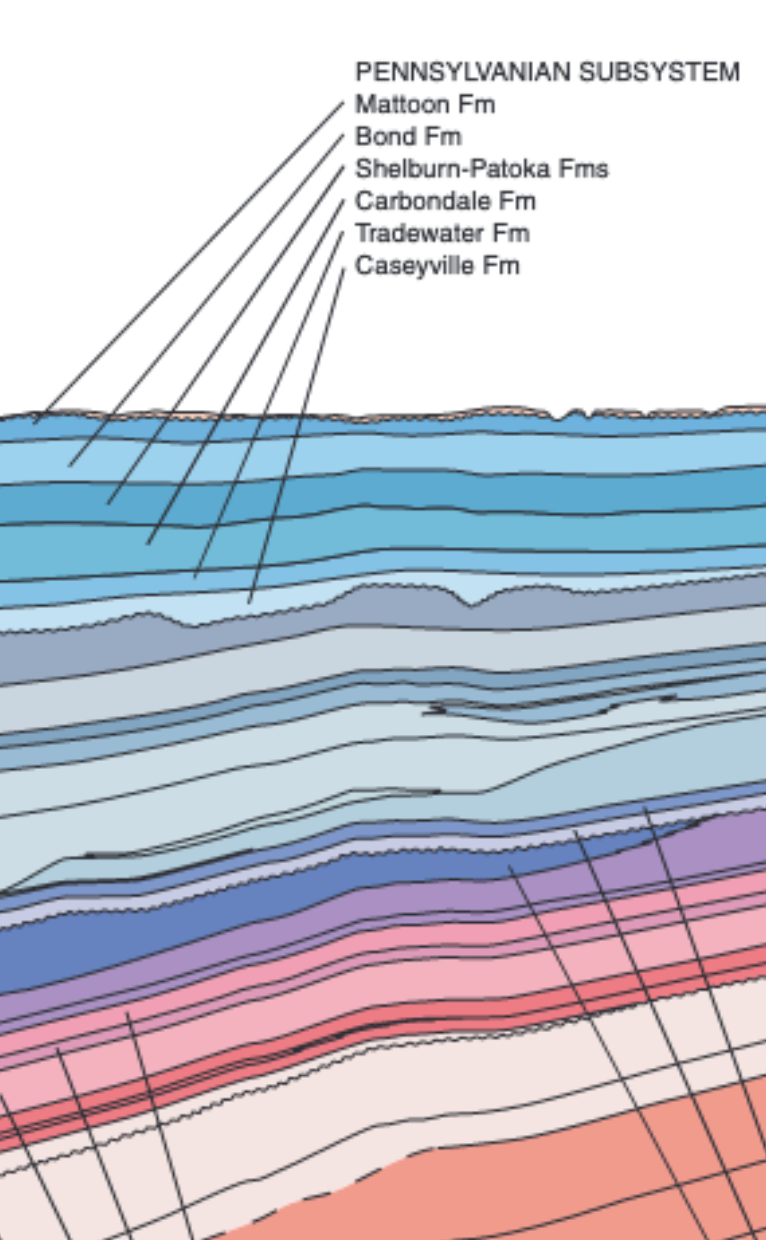
Geologically speaking, not much has happened in Illinois since the Permian. In particular, in the ultra-flat vicinity of Urbana where I grew up, there is no exposed bedrock at all. If one takes the effort to dig down through meters of topsoil and glacial till, one eventually hits gray, unmetamorphosed 320-million year old sediments from the Carboniferous — the Mattoon Formation — the crumbly picture of a disappointing drill core.
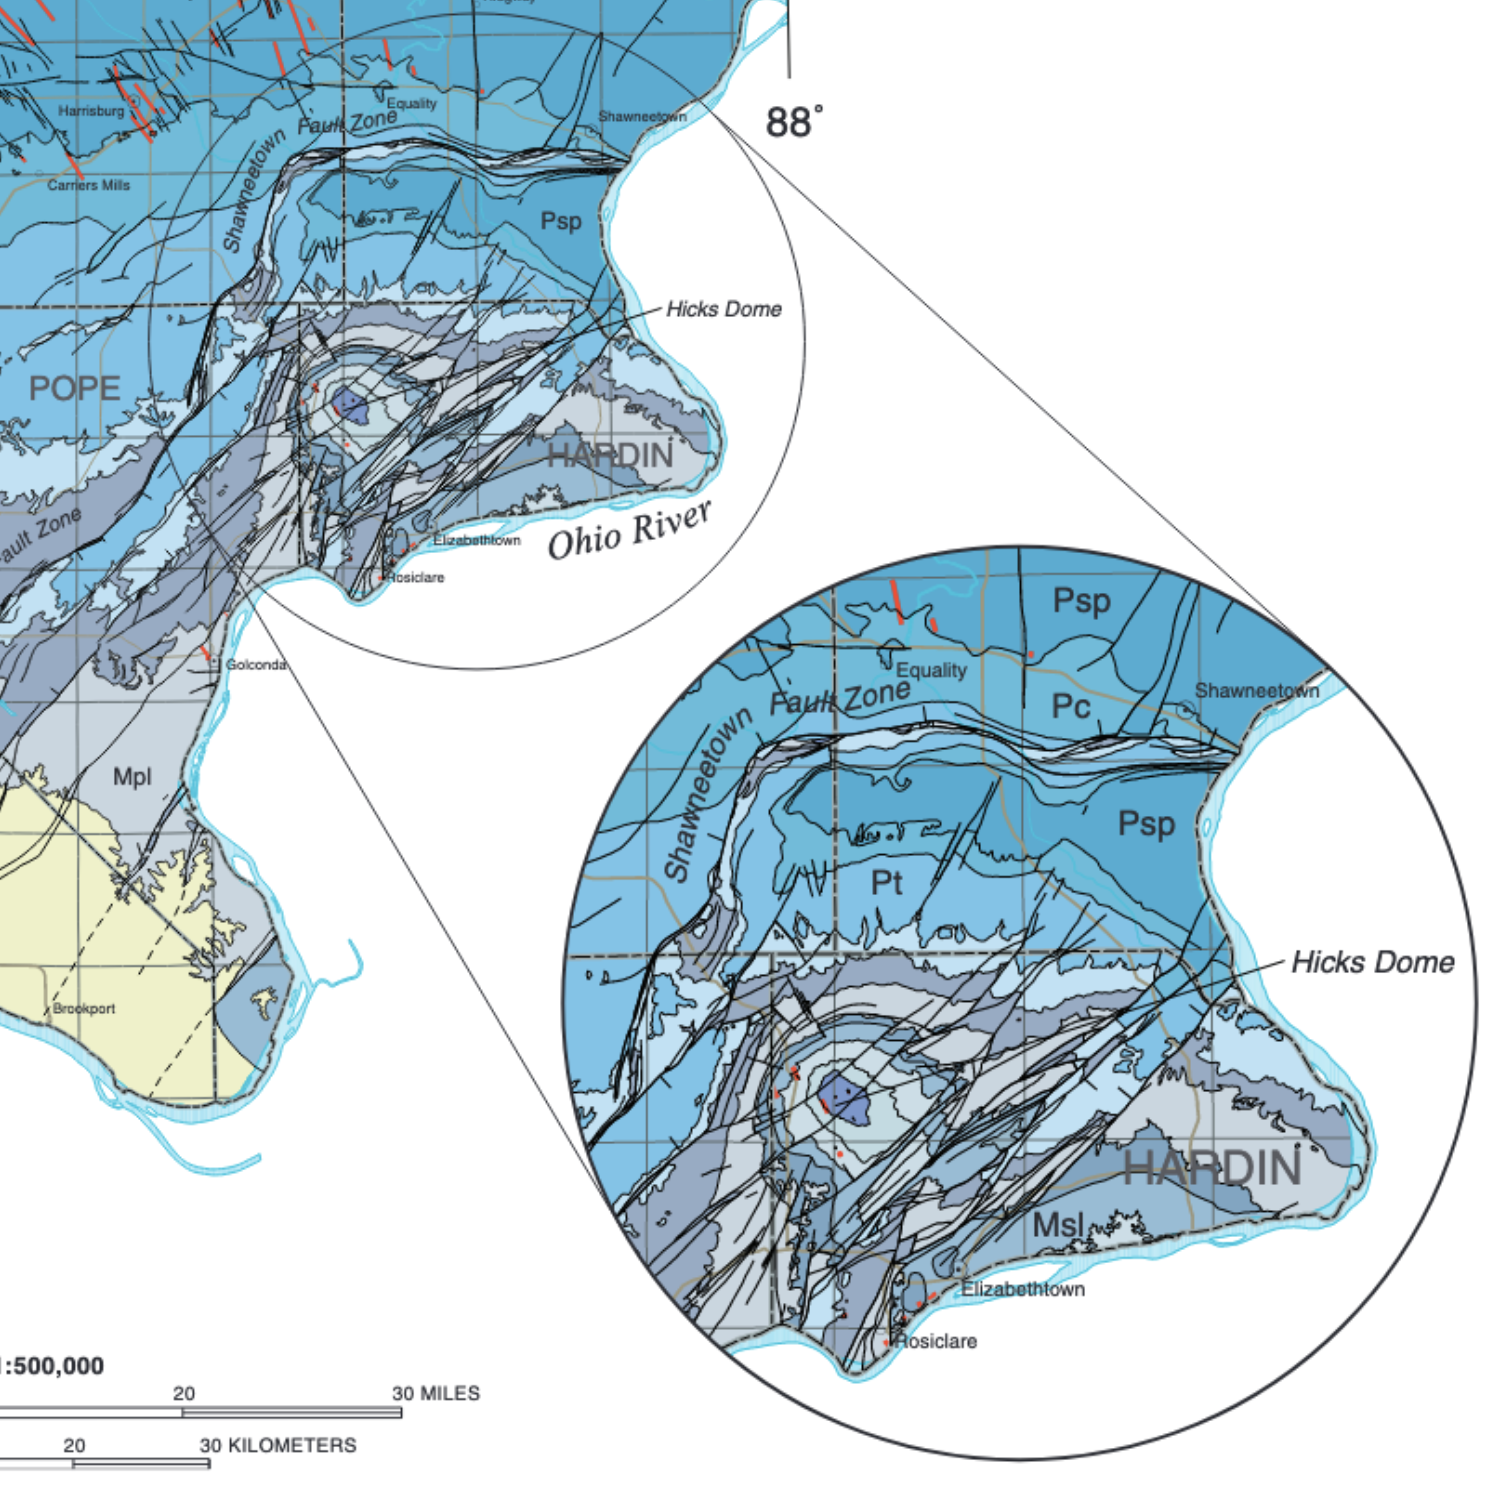
Something about those miles of dull strata directly underfoot instills a vicarious appeal into the IGS maps for the entire state. And while they are dominated by the vast bland extent of the coal-rich Illinois basin, the margins of the map hint at strange and exotic features, including one, Hicks Dome, that’s so weird that it merits its own circular inset.
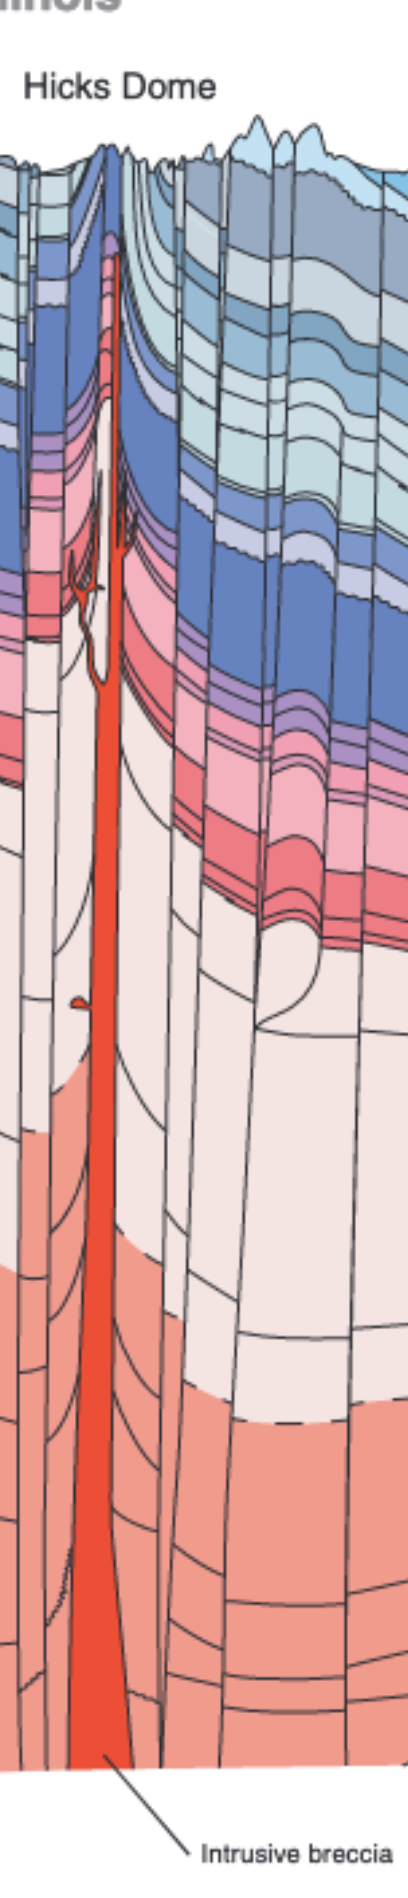
The southeastern tip of Illinois is riddled with faults, and pocked by a mysterious, crater-like 275-million year old blemish that is still clearly visible in aerial photographs. The strata that comprise this feature — the Hicks Dome — were pushed up thousands of feet by a carbon dioxide-driven explosion that brecciated the rock miles below and squeezed dikes of lava through cracks toward the surface.
The resulting igneous rocks, which are colored red in the diagram just above, can be extracted from drill cores. Mineralogical tests indicate that the lava ascended at least 25 km from a source of origin in the upper mantle. Then later, during the Jurassic, geothermally heated brines seeped through the faults that shattered the sediments and interacted with limestone to form fabulous fluorite crystals.
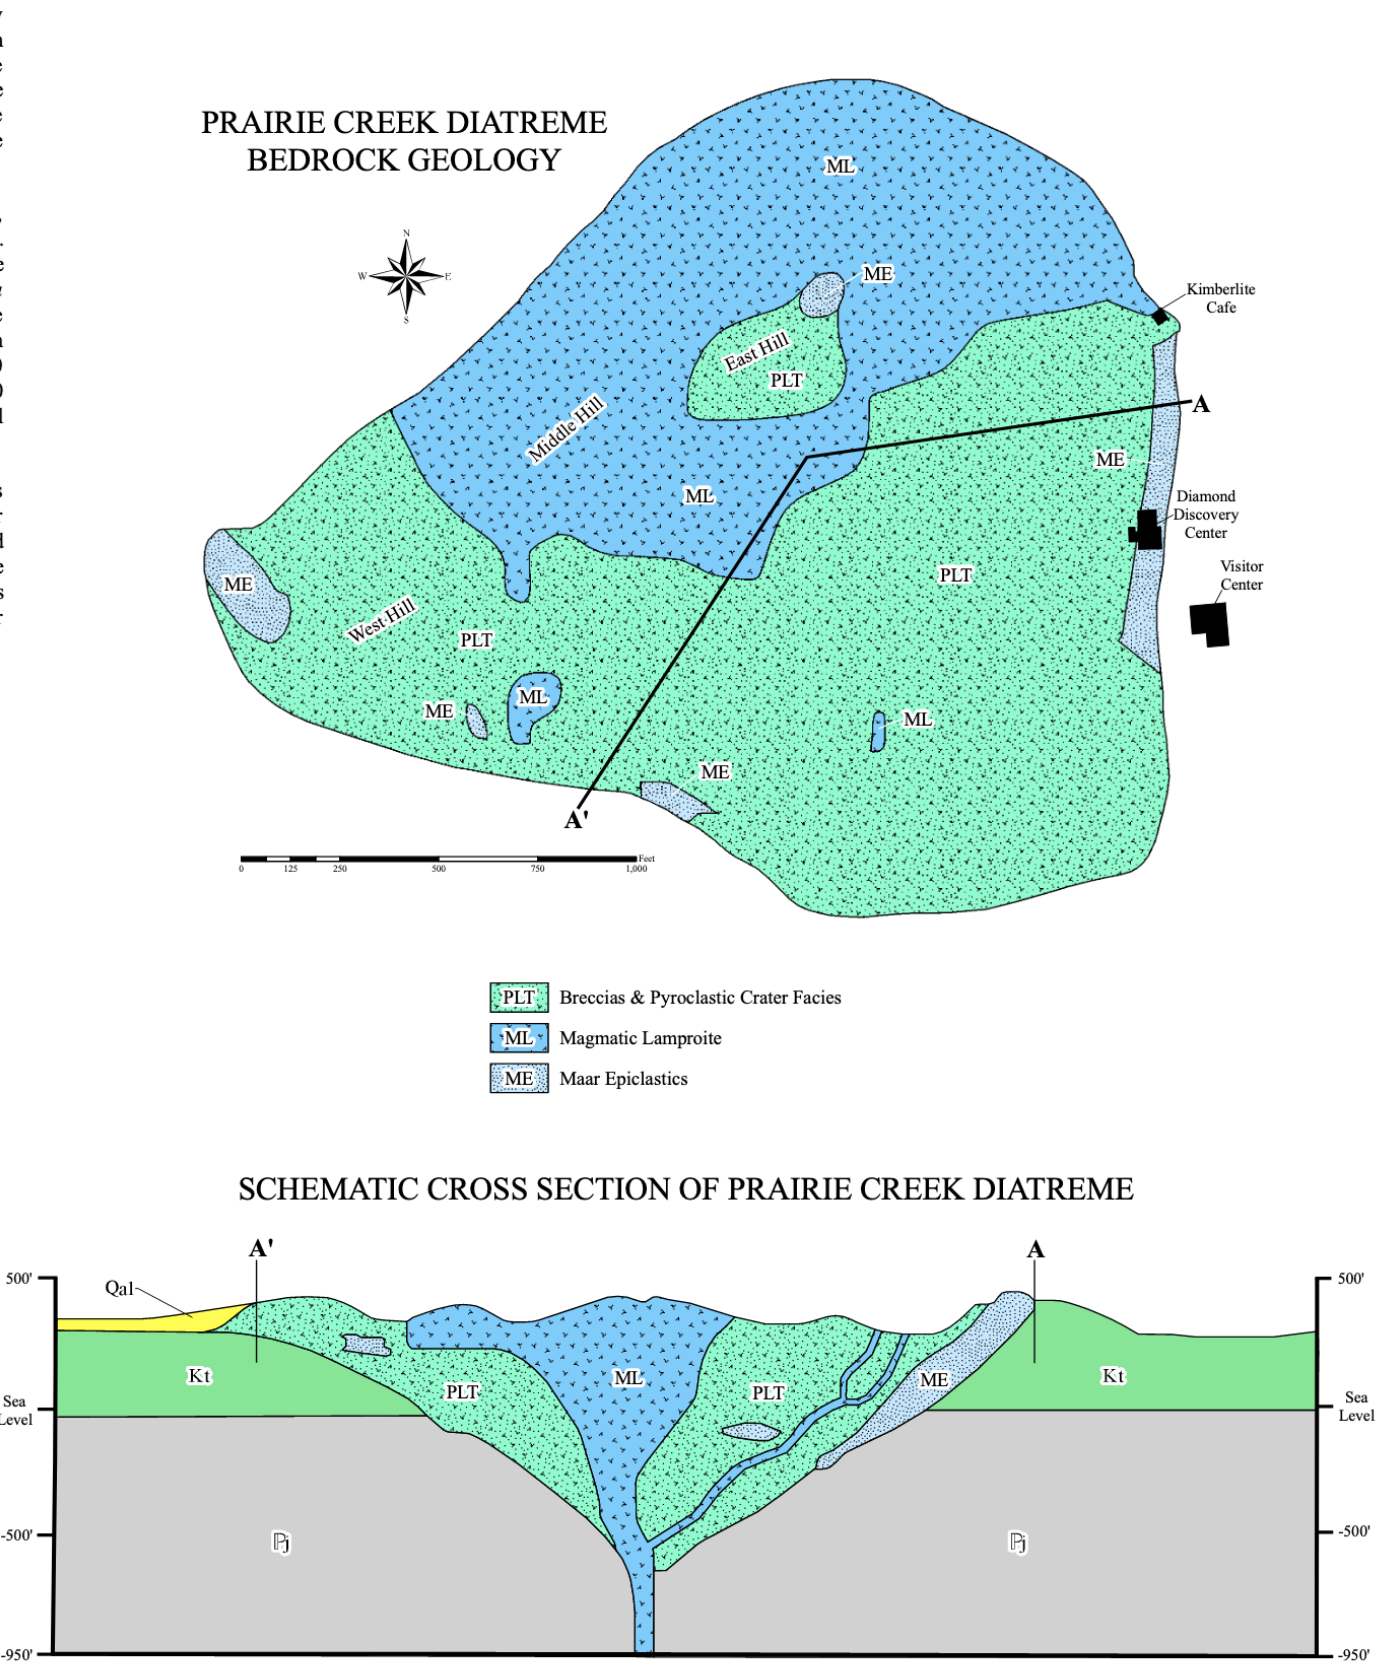
An even more remarkable example of a deep-Earth intrusion is located in Arkansas, 383 miles southwest of Hicks Dome. The Prairie Creek Diatreme, more evocatively known as the Crater of Diamonds, is a 106-Myr old igneous pipe filled with solidified lamproite lava that was driven upward (as also occurred at Hicks Dome) by exsolving CO2 gas from a source at least 100 miles down. The crater, moreover, is indifferently salted with actual diamonds, including the occasional big-deal gem.
Diamonds are metastable when removed from deep mantle conditions, and so in order for them to survive a lava-soaked mix-mastered trip to Earth’s surface, the transport has to be rapid. The lamproite that brought up the diamonds must have smashed its way through a hundred miles of rock with a vertical velocity of order a hundred miles per hour, a marshaling of forces that is undeniably impressive, and indeed, at first glance, completely non-intuitive.
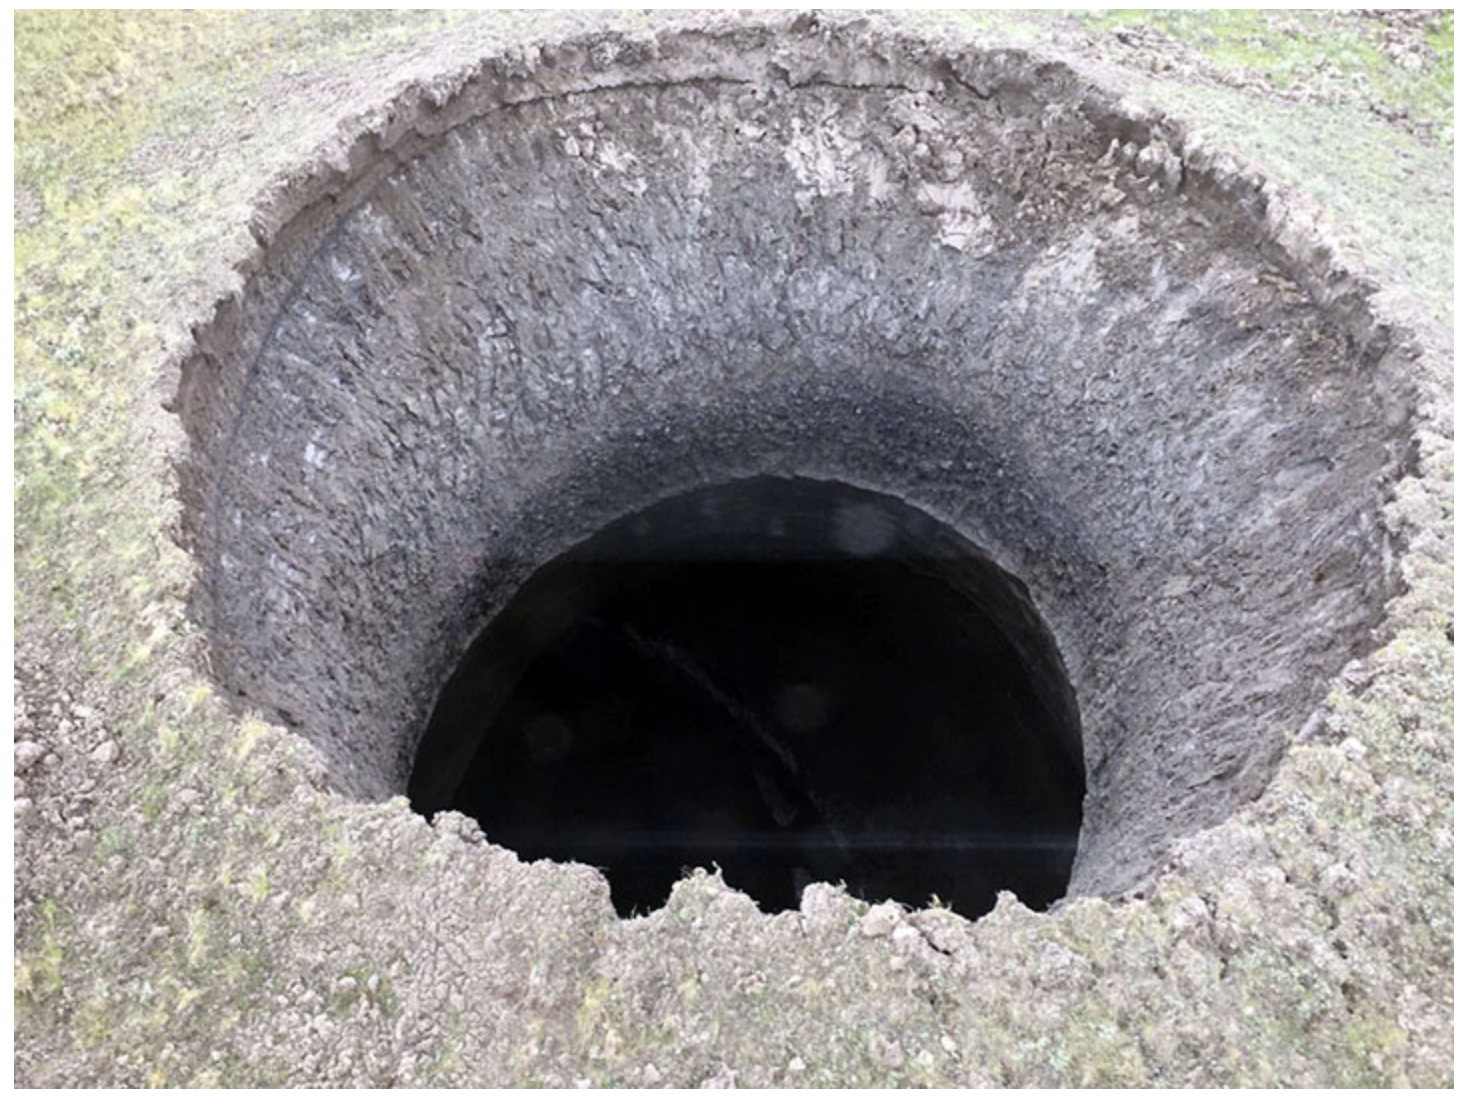
Satisfyingly, a hundred and six million years after the cryptoexplosion, Arkansas is running the lamproite pipe as a State Park, offering end-runs around de Beers at very reasonable rates:
On Earth, the crypto prefix can generally be detached from cryptoexplosions once the techniques of laboratory and field geology have been brought to bear. Kimberlite eruptions may seem superficially crazy, but the basic mechanism of their operation is increasingly well understood. Truly mysterious explosions need to occur off Earth, in locations where it’s not yet possible to go in and root around after the fact…
All the small things.Truth cares truth brings. I’ll take one lift. Your ride best trip… Vintage Blink played in the background. Tubular radio bulbs placed a diffuse glow on the distressed wood and polished concrete surfaces. The researcher pushed away a half-finished bowl of microgreens and, before taking another sip of single-origin espresso, eyed me with a look somewhere between amusement and concern.
“I mean really. You sound like a relic. You’ve gotta move on. You’ve gotta get with the times. ‘Oumuamua is so 2020. Everyone who’s anyone now is working on UAPs.”
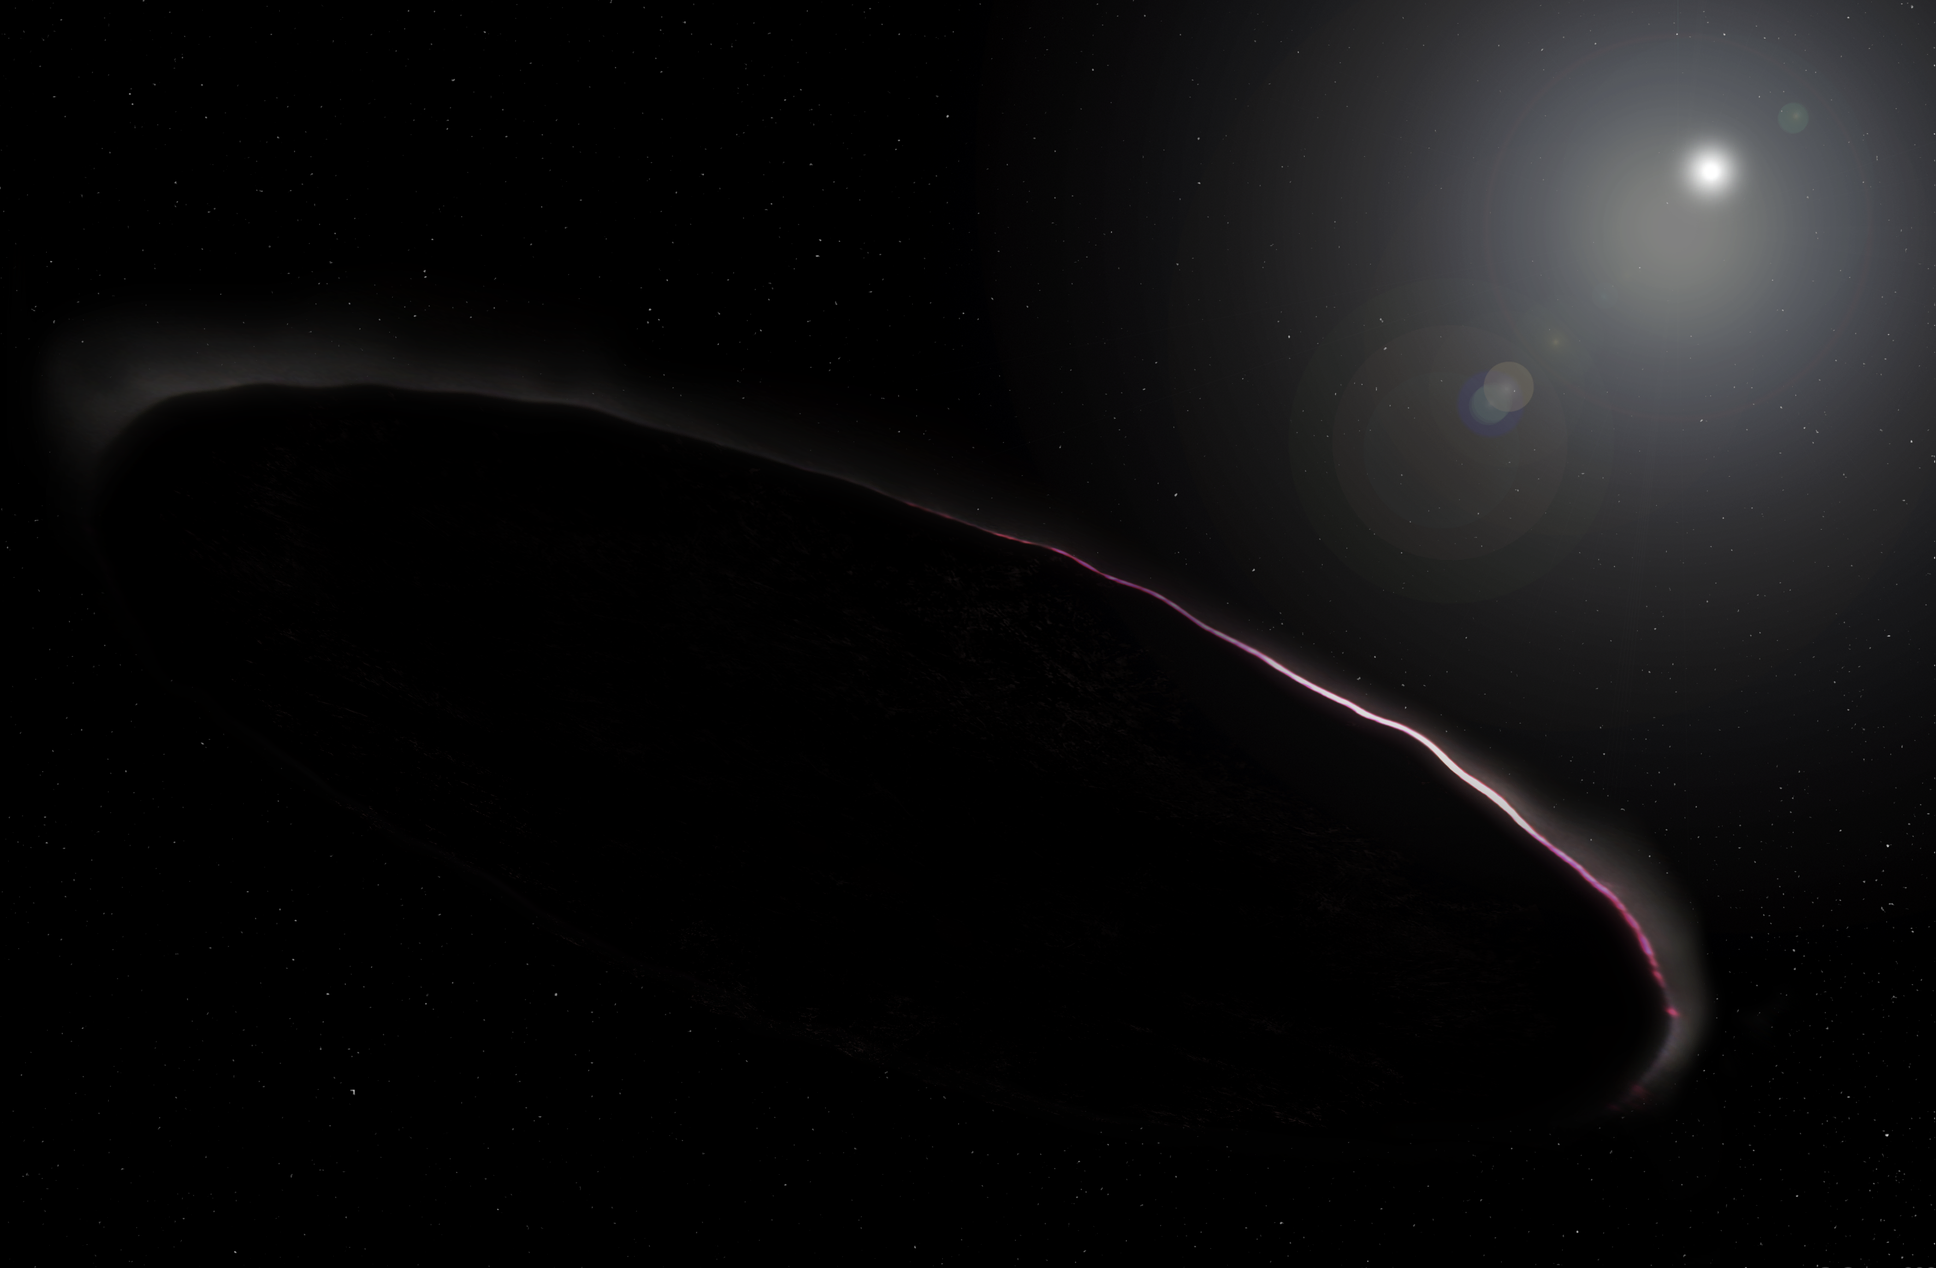
It’s true that the cutting-edge has progressed to bigger and weirder things. Indeed, it’s now been over four years since ‘Oumuamua raced out of sight, and I can’t seem to let that mysterious cosmic visitor out of mind.
The ISO story has been worn smooth through years of retelling, and the details are probably well known to anyone who reads oklo.org: ‘Oumuamua entered the Solar System on a strongly hyperbolic trajectory consistent with a pre-encounter galactocentric obit that was quite close to the local standard of rest. It closed to within 0.25 AU of the Sun. Then, just after passing Earth’s orbit on its outbound leg, it was detected by Pan-STARRs at the end of the third week of October, 2017. Global follow-up efforts with space and ground-based telescopes were quickly mounted. ‘Oumuamua was observed to have a strongly varying light curve, no detectable coma, a slightly reddish color, and it experienced a small but significant non-gravitational acceleration on its way out.
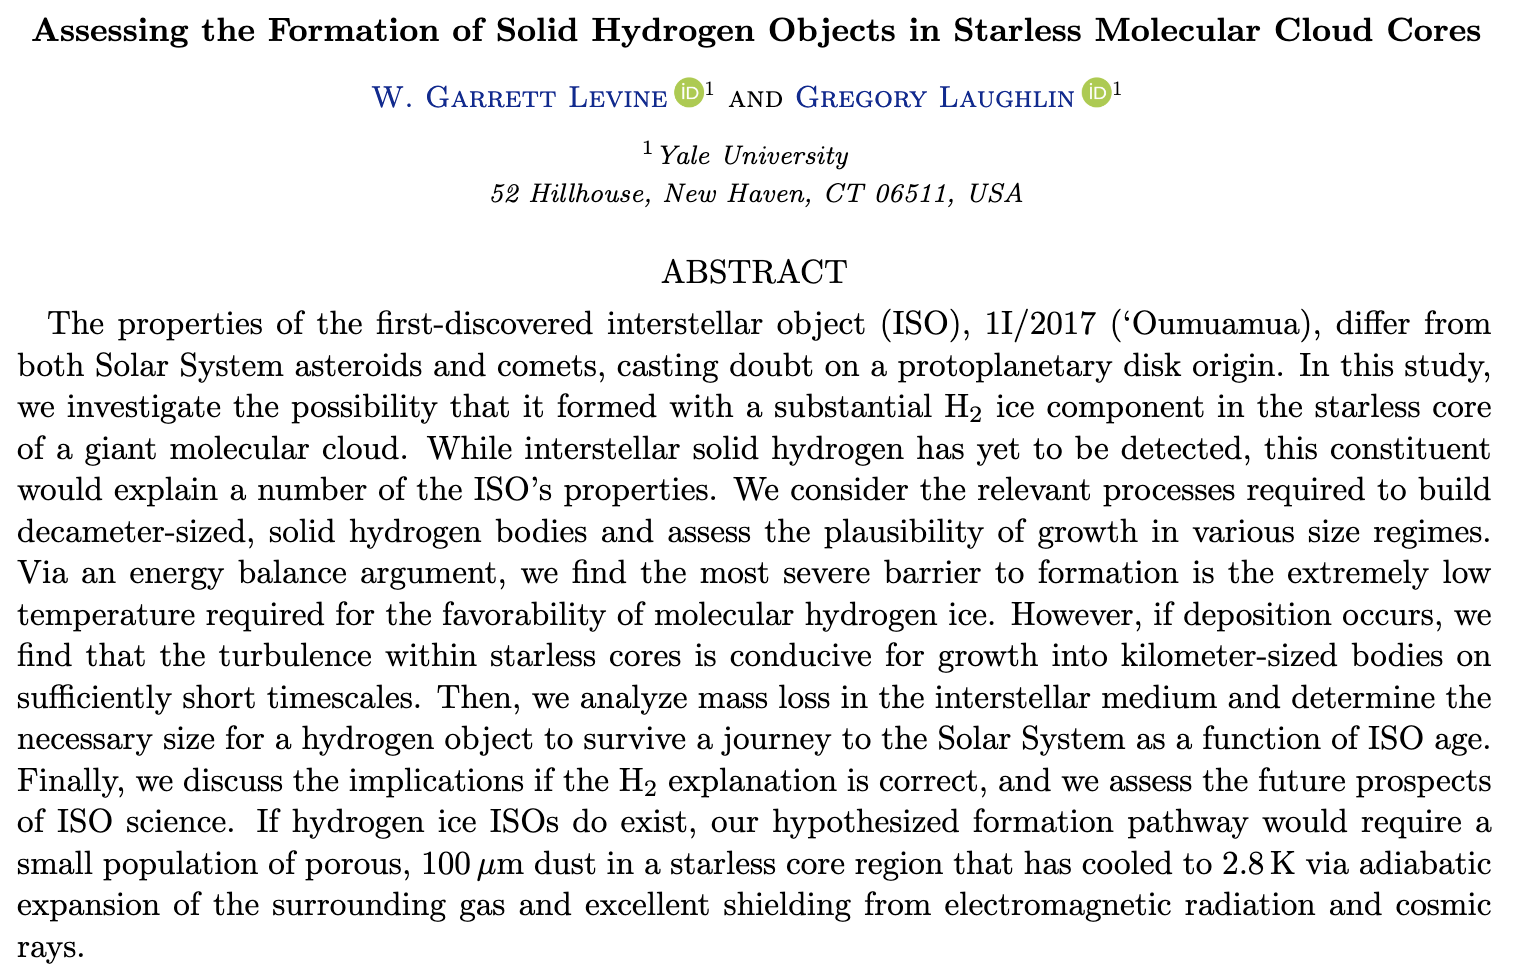
For over a year, I was very enthusiastic about the possibility that ‘Oumuamua’s properties could be explained by appealing to a composition rich in molecular hydrogen ice. Darryl Seligman and I published a paper outlining this idea, which generated a fair amount of interest in the wider media. Last year, however, Yale graduate student Garrett Levine carried out a very detailed investigation to trace how macroscopic objects rich in molecular hydrogen ice might form in the cores of the densest, coldest molecular clouds. Our final conclusion was that while it’s not impossible, it’s very difficult for the present-day Universe to manufacture solid H2. The microwave background temperature just isn’t quite cold enough yet…
Recently, Metaculus (which has been undergoing rapid development) launched an on-line journal featuring fortified essays in which an in-depth article on a topic of interest is linked to a set of questions on which readers can predict. Garrett wrote an essay the outlines the future detection and research prospects for ISOs. Everyone’s encouraged to read it and place predictions.
Music from your formative years stays with you — generally in latent form, but at other times echoing resurgently through the amorphous cycles of nostalgia that stretch out into decades.
For me, it was the era of The Sisters of Mercy, New Order, The Psychedelic Furs, and Depeche Mode. Listening to the old LPs sometimes occasions a near-electric jolt when stanzas that seemed obscure are suddenly infused with stunning up-to-the-moment relevance. Stuck inside of Memphis with the mobile home, sing…
Several days ago, I noticed a new Metaculus question with a curious, almost clickbait-worthy title, When will we meet grabby aliens?
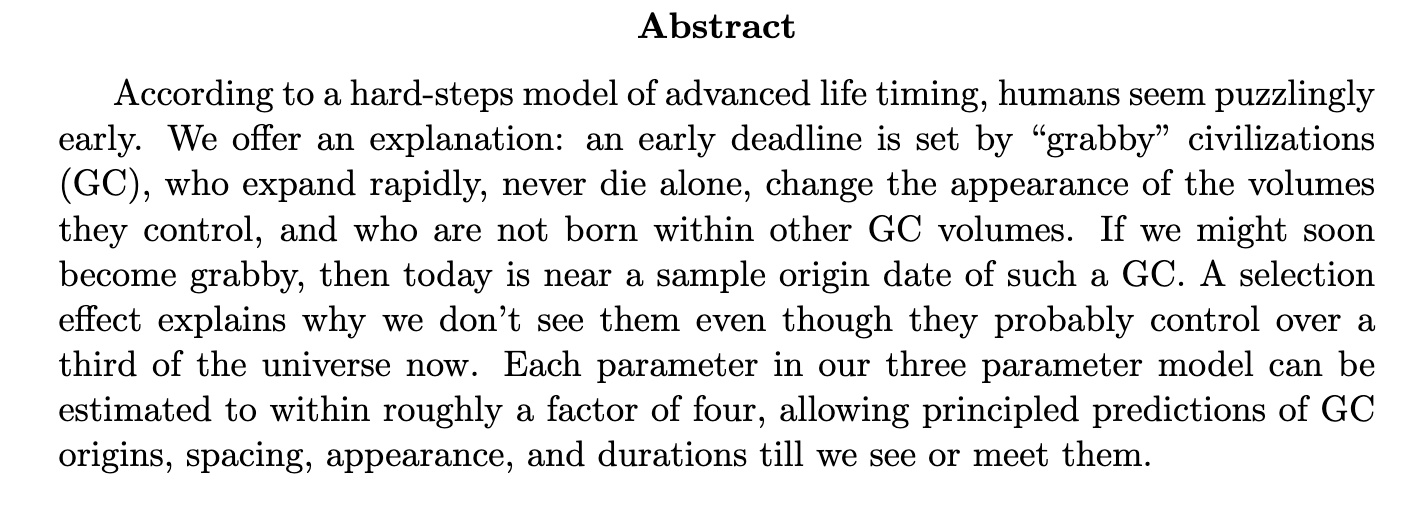
The reference is to a recent paper by Hanson, Martin, McCarter and Paulson that has been getting traction in response to write-ups by Scott Aronson and others. Hanson et al.’s abstract rebrands as “grabby”, a subset of extraterrestrials that would appear to bear certain similarities to the antagonists in Starship Troopers.
The parameters of the GC model determine how fast and in what manner space-time fills up with grabby civilizations, and are specified by (1) the rate at which grabby civilizations emerge, (2) the rate at which they expand, and (3) the number of “hard steps” (bottlenecks) in the so-called Great Filter, whatever it is that prevents non-living matter from making the transition to living matter.
The Hanson et al. abstract strikes me as a more or less point-by-point rephrasing of Everything Counts by Depeche Mode. Aside from the line about Korea (maybe misheard along the lines of “Here we are now in containers”?) everything in the song is fully relevant.
The grabbing hands grab all they can All for themselves, after all It’s a competitive world
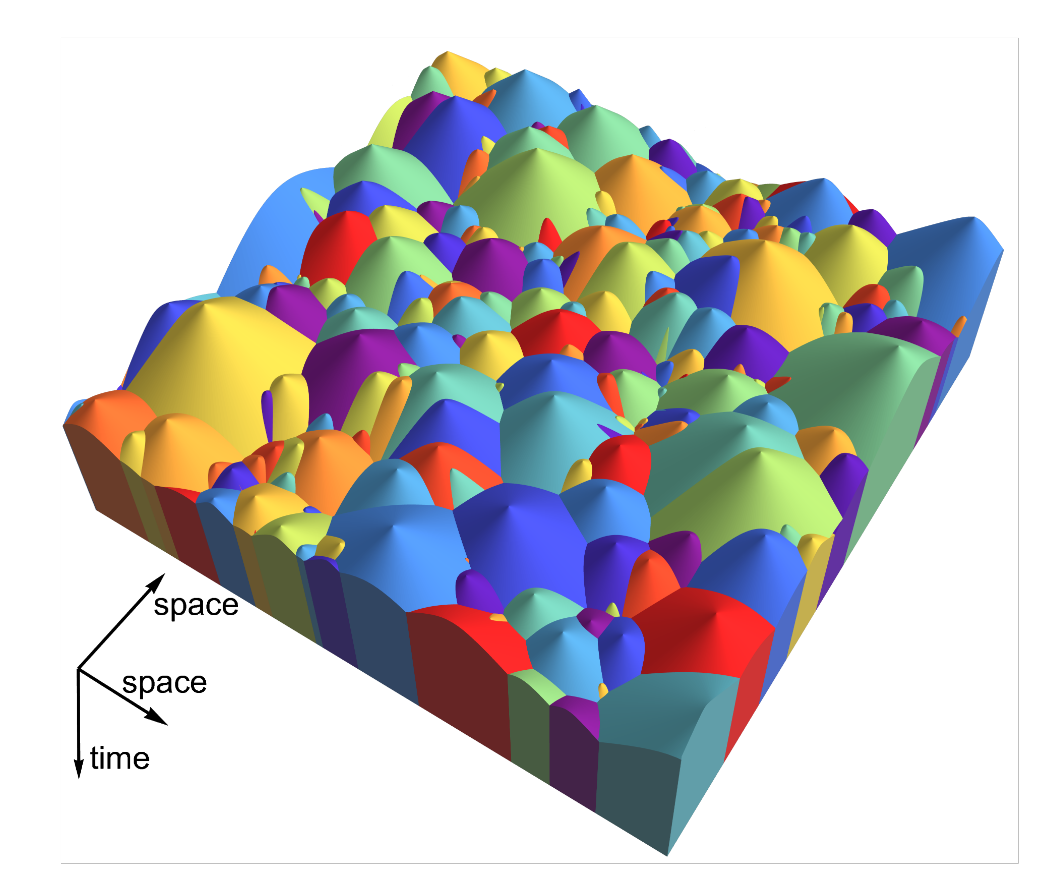
Given the model assumptions, grabby civilizations blister out within the universe in a manner determined by the values of the three parameters. The paper has an attractive figure that illustrates one particular outcome, with 193 randomly candy-coated GCs appearing over several Hubble Times across a 2D slice 41.7 billion light years on a side.
The paper’s take-away argument is that we’re living at some point in the clear space above the GC surfaces, and at some point in the future we’ll either become a GC or we’ll be steamrolled by one. Moreover, it’s argued that at the present moment, it’s likely that a “third to a half of the universe is within grabby-controlled volumes.” Hmm.
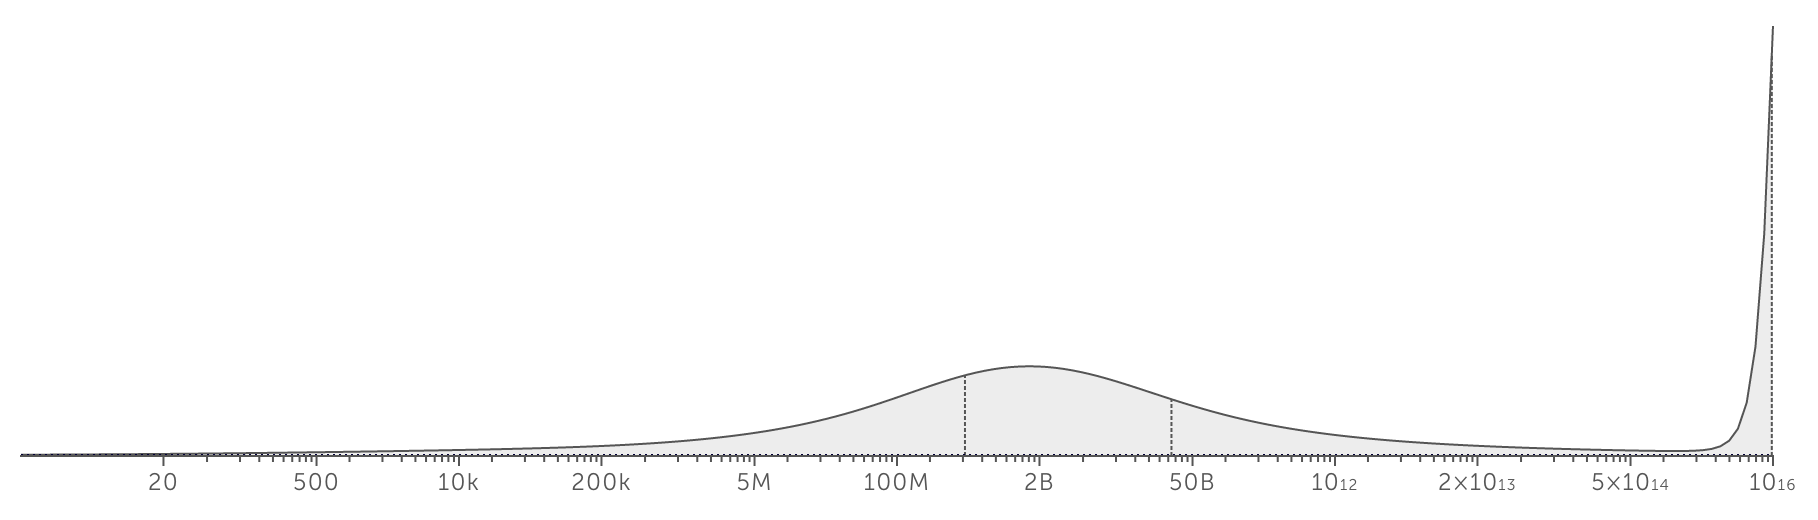
The Metaculus question asks for predictions of the probability distribution over the number of years before we or our descendants encounter a GC. At the moment, the median of the community PDF is a staggering 22.7 billion years, with a significant peak at 2 billion years. Clearly, the emerging consensus is that this question might take a while to resolve.
Herman Bondi, Tommy Gold and Fred Hoyle’s steady state theory of cosmology introduced the so-called perfect cosmological principle, which holds that the universe is homogeneous and isotropic in both space and time. Two papers outlining the their theory appeared in 1948, and maintained considerable influence until evidence that the Big Bang occurred became incontrovertible. A satisfying anecdote relates that the steady-state theory was inspired by the circular plot of the British post-war horror film, The Dead of Night.
If a horror movie can act as the aesthetic pivot for a debunked cosmological theory, it stands to reason that Depeche Mode may have pointed toward the resolution of the Fermi Paradox. The key lies in the fact that if it’s a competitive world, then
Everything counts in large amounts.
When one talks about aliens and grabby extraterrestrial civilizations, one is really talking about computation. And if grabby computation is irreversible and device-based, then planets are really nowhere. They just don’t matter. A wind of catalyzed nano-devices within the outflow from a single dust-spewing extreme asymptotic giant branch star can accomplish of order 10^62 bit operations, a factor of ten million times more than a “habitable” planet can muster over 5 billion years if totally covered with solar panels. Again, when it comes to the big picture, planets are completely irrelevant.
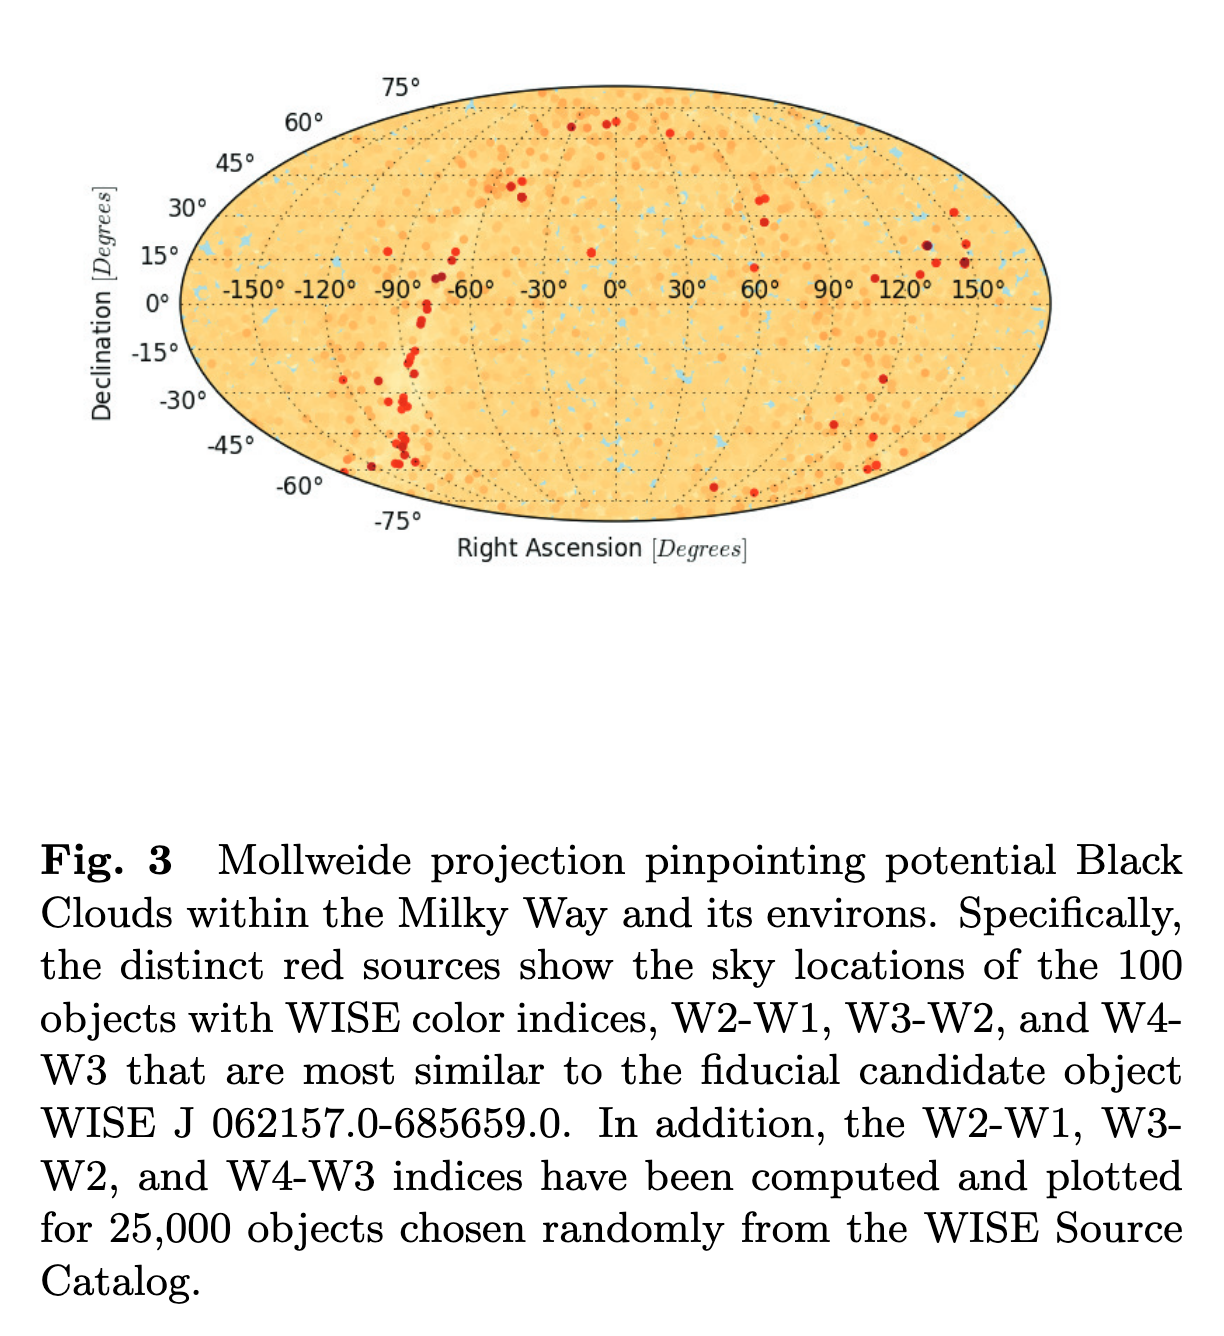
Here’s a link to our working paper, The Black Clouds, which discusses how extreme Asymptotic Giant Branch stars can be commandeered in the service of computation. We might just be immersed in a colored region, and the WISE sources in the Mollweide projection above might just be our unfriendly local GC.
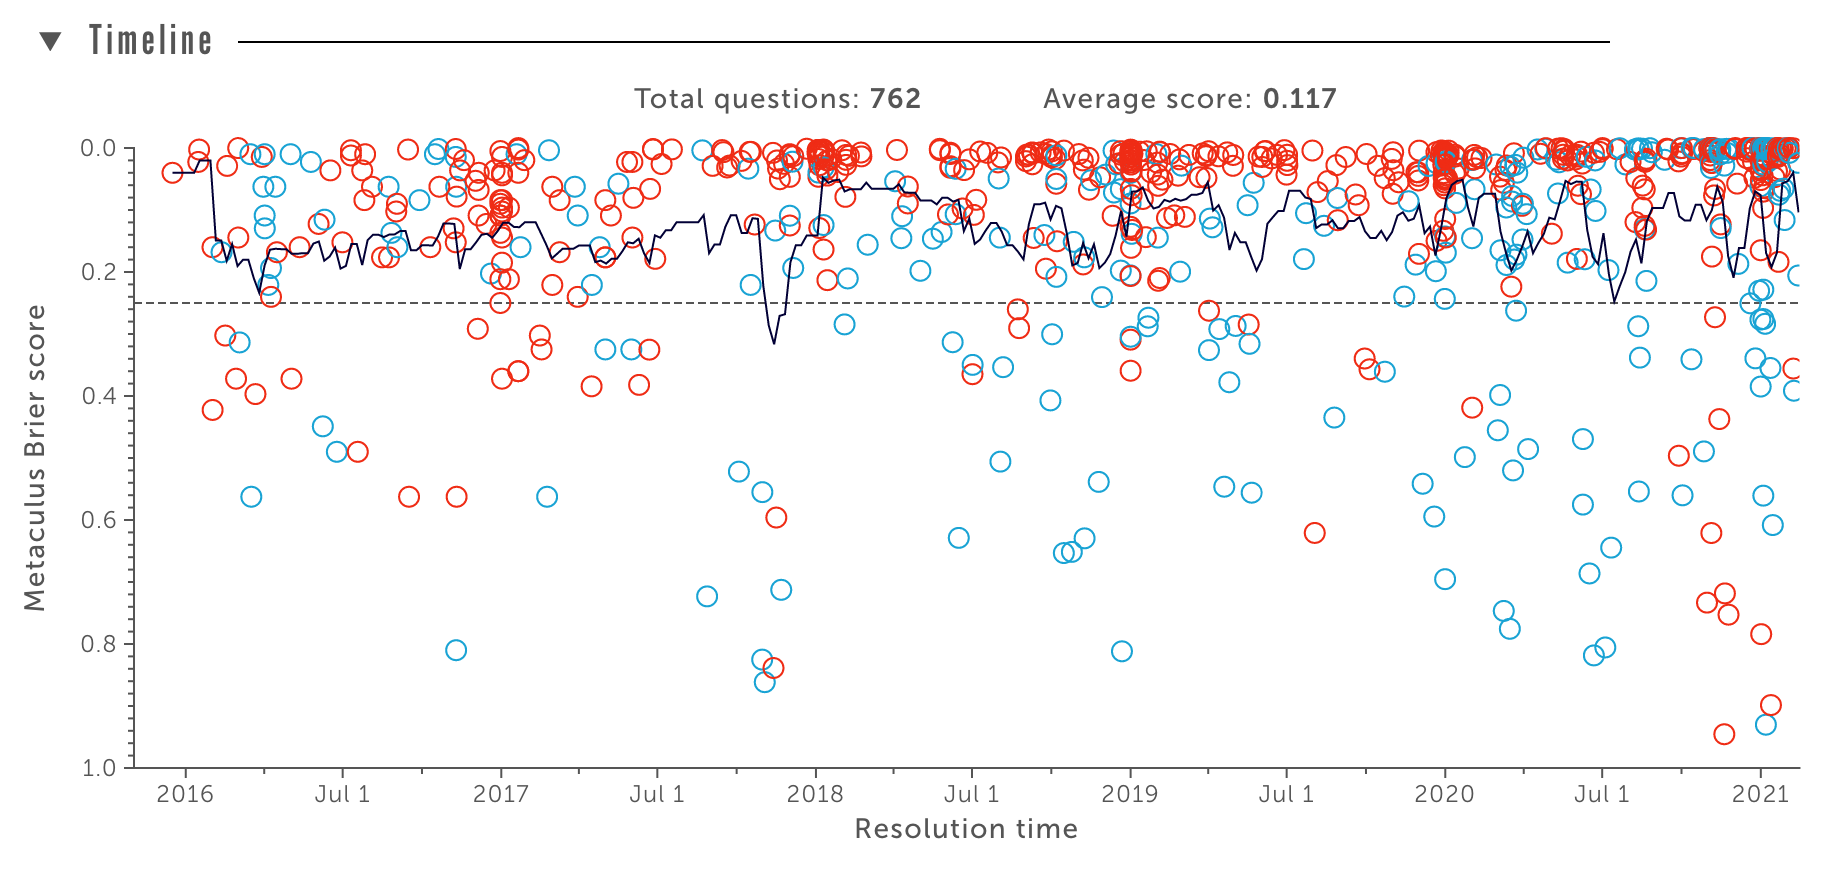
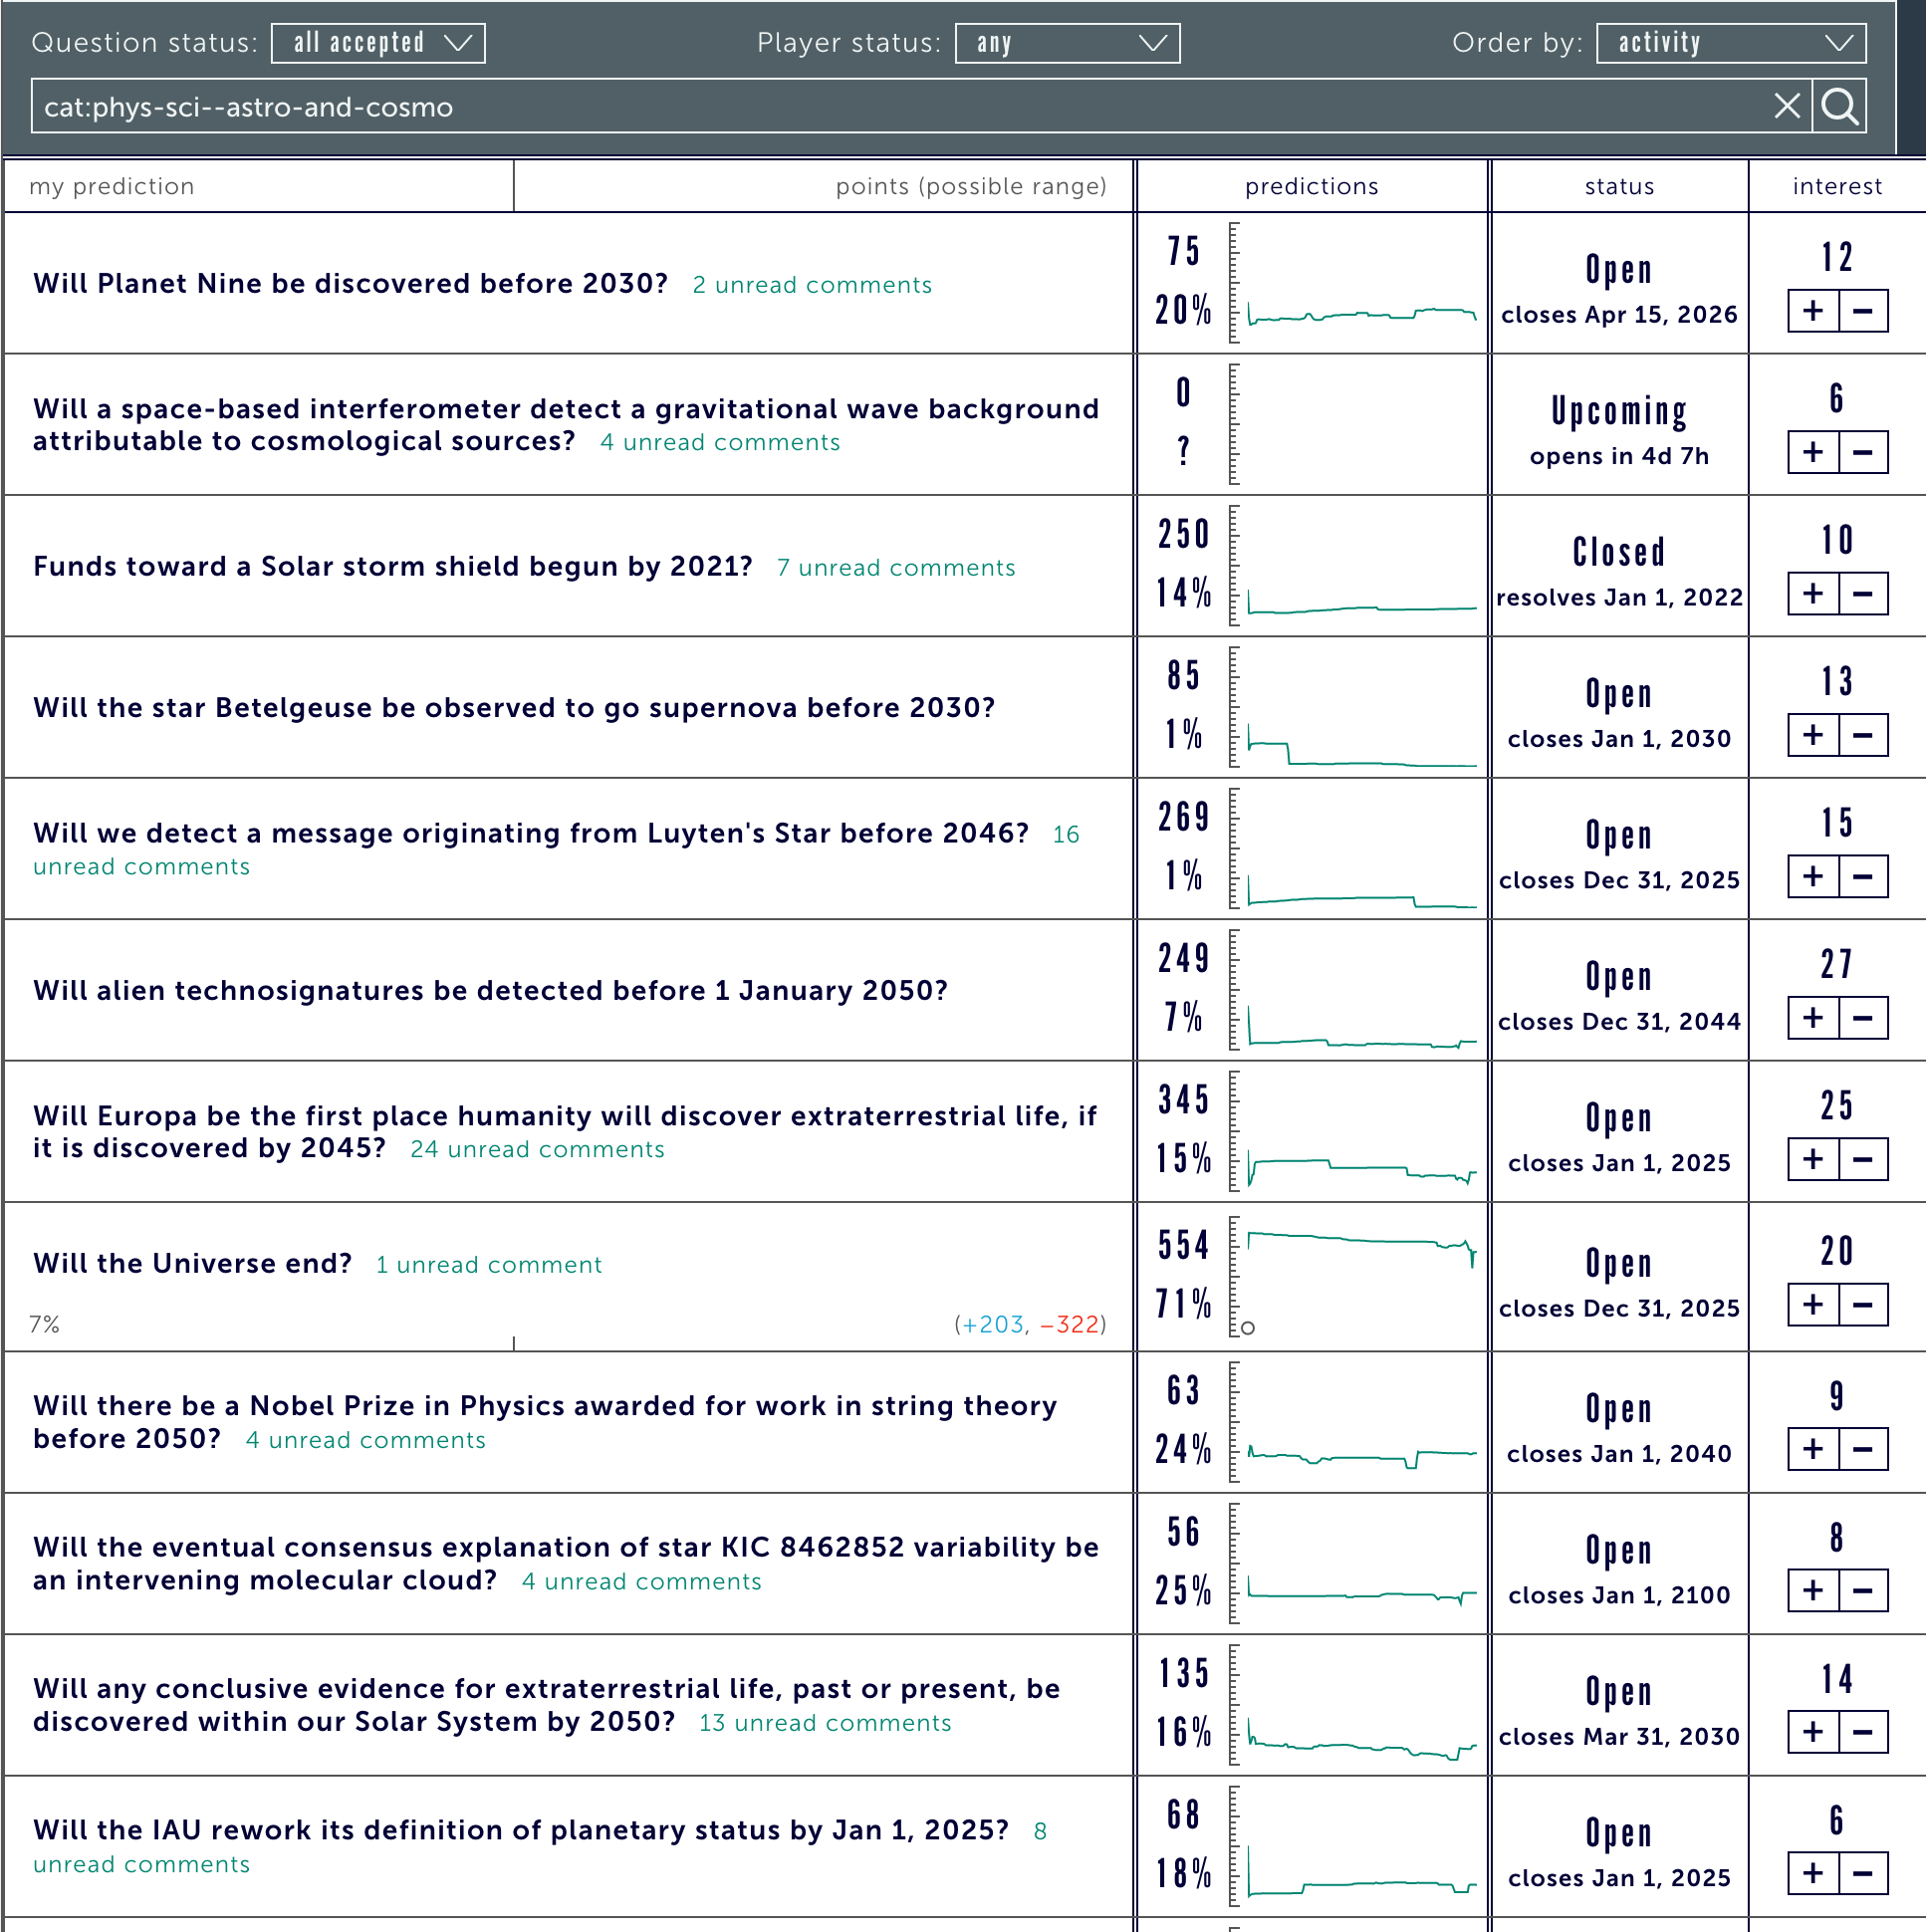
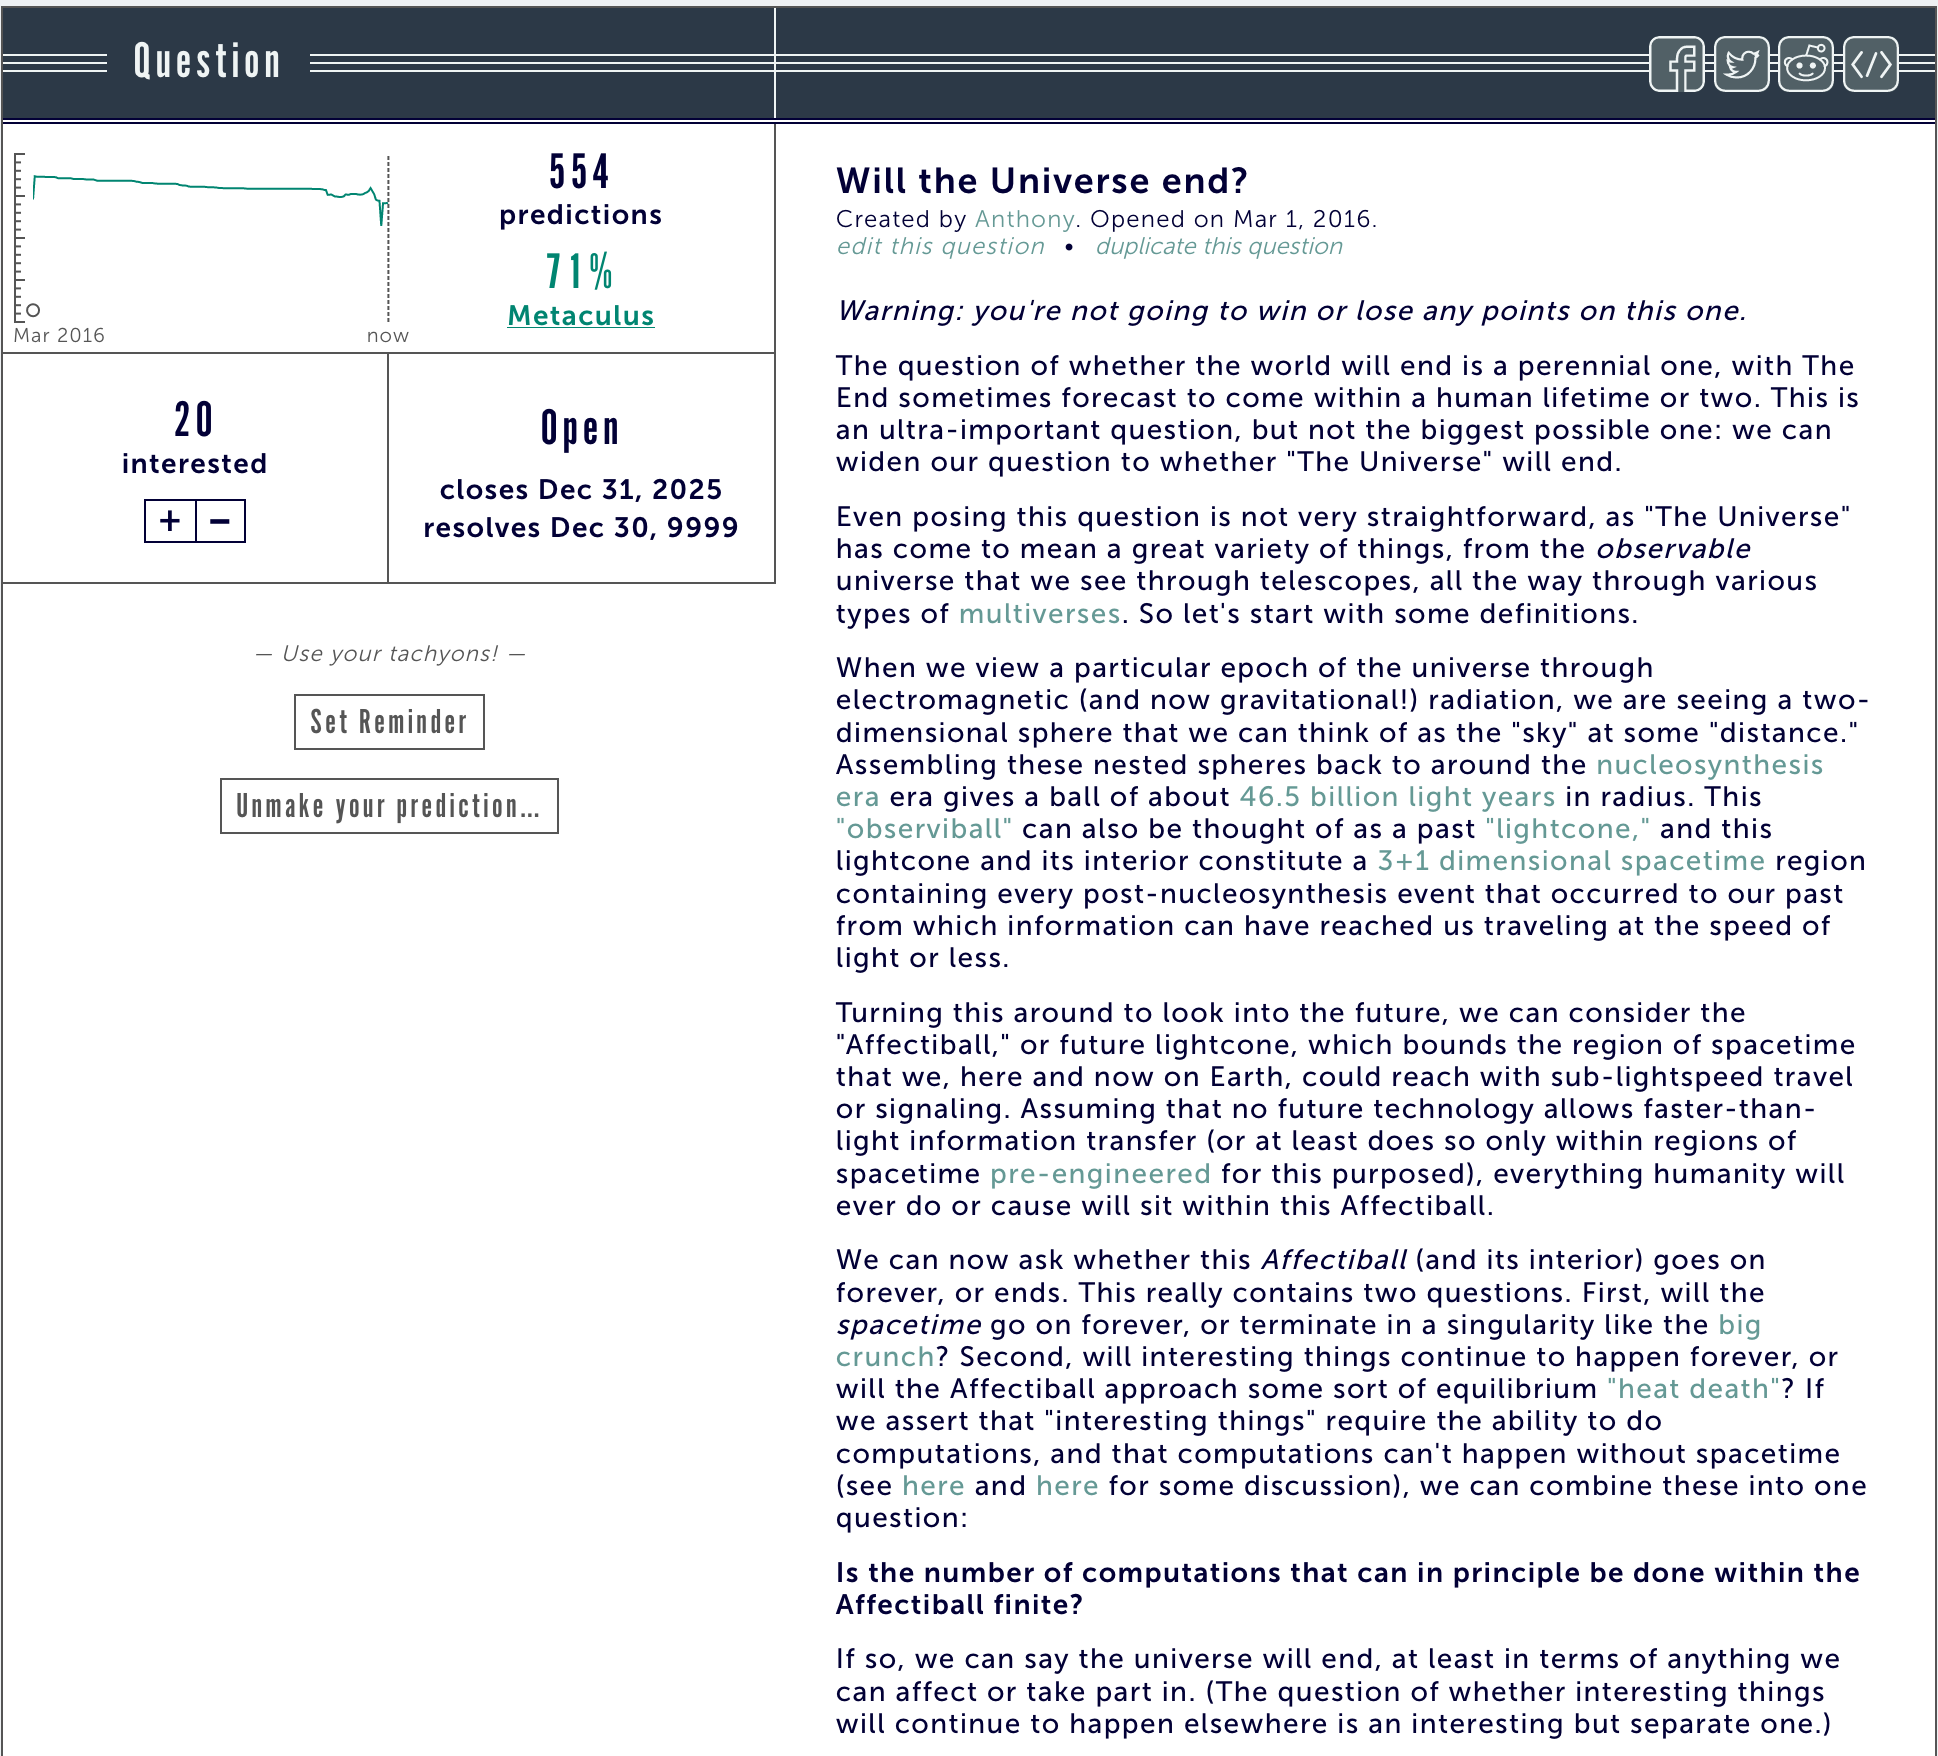
A few years ago, I put up several posts describing Metaculus, the online prediction site that I co-founded with Anthony Aguirre and several other partners. In the interim, the site has grown substantially. It’s now logged roughly half a million predictions from a community of more than 10,000 users on a panoply of nearly 7,000 questions. Among the subset of binary questions that have resolved, the track record shows that Metaculus’ Brier Score stands at an impressive 0.117.
As the site has grown we’ve added staff, including a full-time CEO and a CTO, and a roster of analysts and question writers. We’re running real money competitions, including a $50K forecasting tournament on topics related to the development of artificial intelligence.
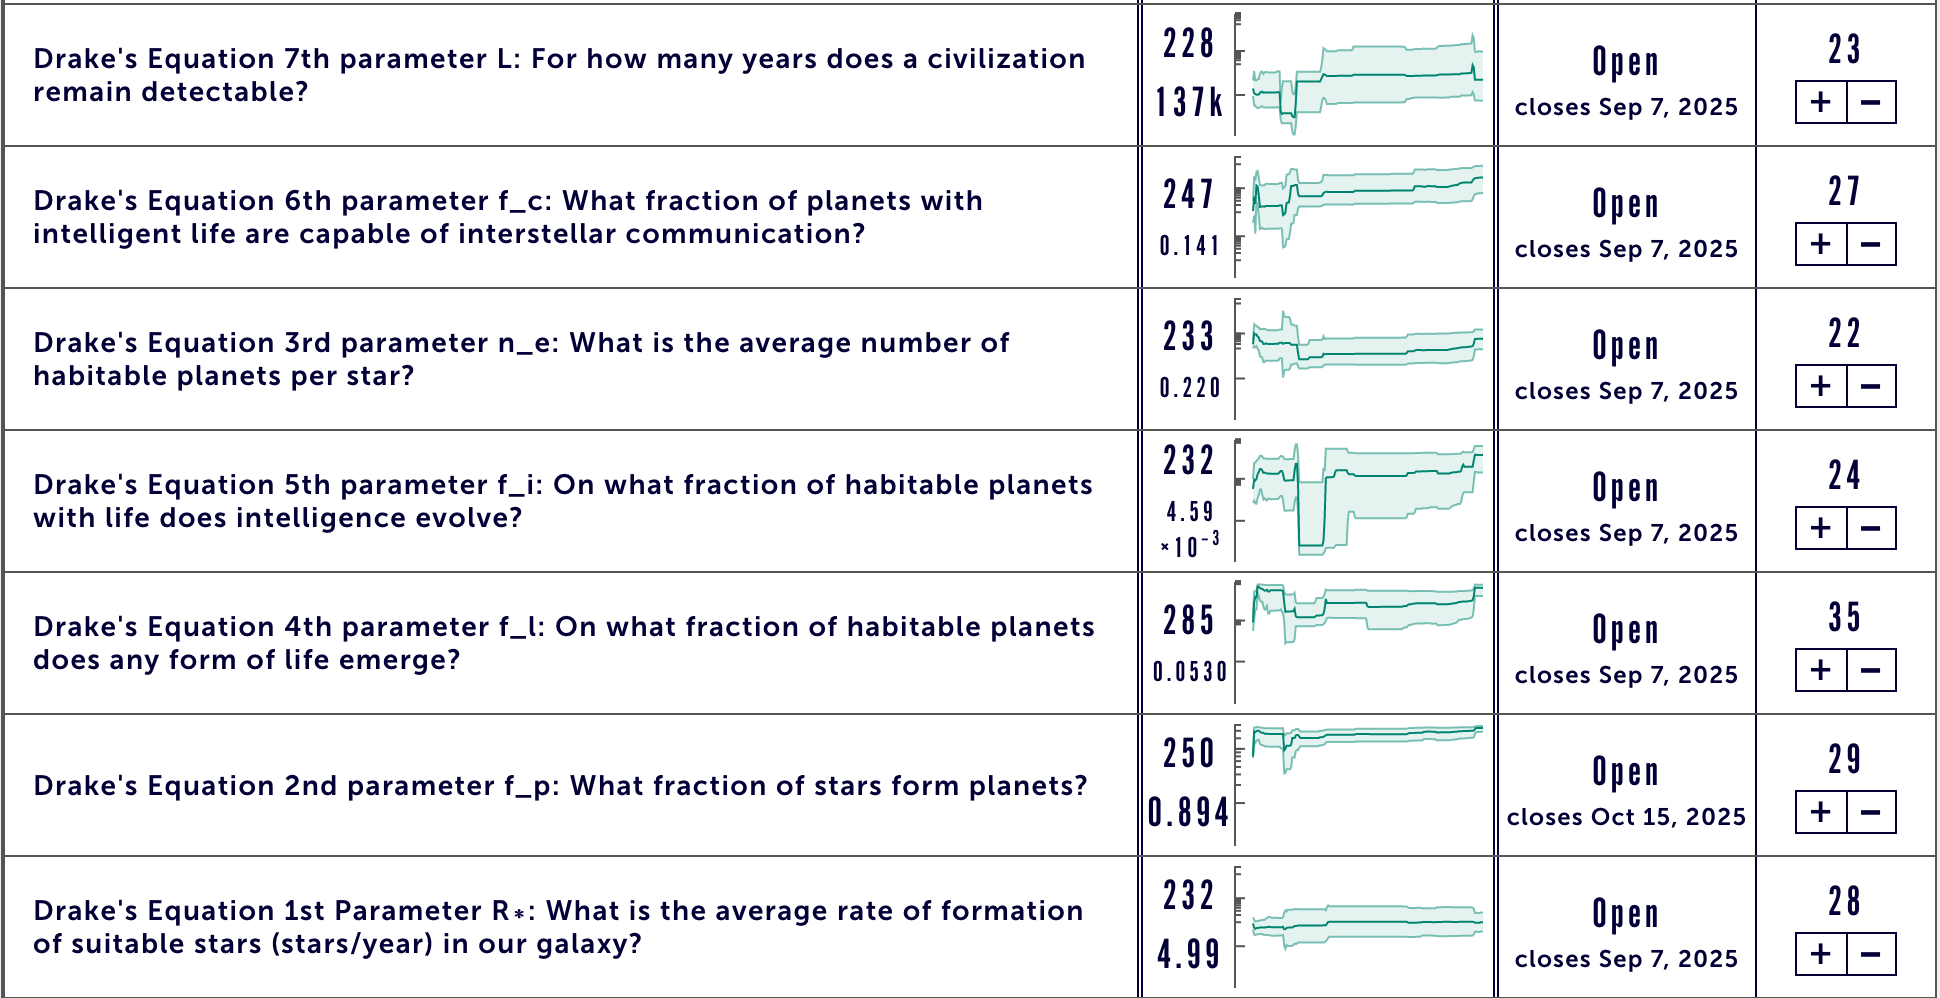
Many oklo.org readers may find interest in the Fermi-Drake question series, where we’re accumulating predictions on the terms of the famous equation for N.