Skyscraper

Screen-Shot-2014-12-18-at-4.29.07-PM

A few weeks ago, I had a flight out of LaGuardia Airport in New York City. On the drive there, I caught a distant glimpse of the Manhattan skyline. I was startled to see that it is newly altered. Rising from midtown was a silhouette that seemed both impossibly narrow, and taller than any other skyscraper in the far-off cut-out.

Photo Credit: 432 Park Avenue -- processed screenshot

Original Photo: 432parkavenue.com — Photoshop processed screenshot

The Internet, of course, has the story. 432 Park Avenue — $1.25B, 426 meters, the highest rooftop in the city. Many of its floors, especially the higher ones, are monolithic residences, in the process of acquisition by opaque, limited liability corporations, “bank safe deposit boxes in the sky that buyers can put their valuables in and rarely visit.”

Often, the aesthetic informing such projects veers toward the rococo, but 432 Park is minimalist to the core. Every window of the tower is an exact 10 foot by 10 foot square. From the elaborate on-line galleries, it wholly ambiguous whether the surreal bone-parchment interiors already exist or whether they are virtual. Somewhere, in micrometric accuracies of the digital architectural model, lies the pattern of the seasons, the moment of the equinox, the precise angle of sunlight shafting into the cavernous, unvisited, perhaps as-yet unconstructed rooms.

Like the pyramids at Giza — after they were sealed and before they were robbed.

Dead voices on air

Screen-Shot-2014-12-17-at-10.04.00-PM

This Fall quarter, I taught a class for undergraduates on order-of-magnitude estimation in physics with a focus on astronomical examples. And on the last day of class, with final exams looming, what could be better that the time-tested stress relievers provided by the Fermi Paradox and the Drake Equation?

In Los Alamos National Laboratory publication LA-103110MS, “Where is Everybody?” An Account of Fermi’s Question, Eric Jones describes how Enrico Fermi, Emil Konopinski, Edward Teller, and Herbert York were diverted into their famous lunch-time conversation in the summer of 1950. While walking to the cafeteria, they were discussing news reports of UFOs, and an associated New Yorker cartoon that explained why the public trash cans in New York City were disappearing.

Screen-Shot-2014-12-18-at-8.01.51-AM

The flying saucers of the early 1950s hold a special fascination. A compound of Cold War anxieties — nuclear weapons, communists, infiltrators — they are silvery and remote, icons of minimalist design from a time when the space age was truly, rather than retro- futuristic.

Indeed, much of my own interest in astronomy can be traced to 50’s-era flying saucers. In the Bicentennial summer of 1976, after finishing third grade, I got a paper route delivering the Champaign-Urbana Courier. One of my customers, Mrs. Barbara Houseworth, had a garage full of cast-off books that she collected for an annual drive. I spent a great deal of time examining them whenever I visited to collect the subscription fee. I was particularly drawn to the pulpy paperback books — especially the ones with clay-coated photographic inserts — that covered the Bermuda Triangle, Bigfoot, the Loch Ness Monster, and Flying Saucers. All matters that seemed to merit the most urgent scientific concern.

Screen-Shot-2014-12-18-at-10.57.41-AM

At the top of my list was Gray Barker’s They Knew Too Much About Flying Saucers, published in 1956. I was so taken with it that Mrs. Houseworth simply gave me the book.

FullSizeRender

Gray Barker was an intriguing character, a closeted gay man in mid-century West Virginia who took a certain delight in channeling the fears and neuroses of the American masses into money-making volumes. Barker’s invention of the three men in dark suits, in particular, achieved a lasting cultural resonance. There is more about him at the UWV Center for Literary Computing, and he is the subject of several recent documentaries.
saucerfilmstills

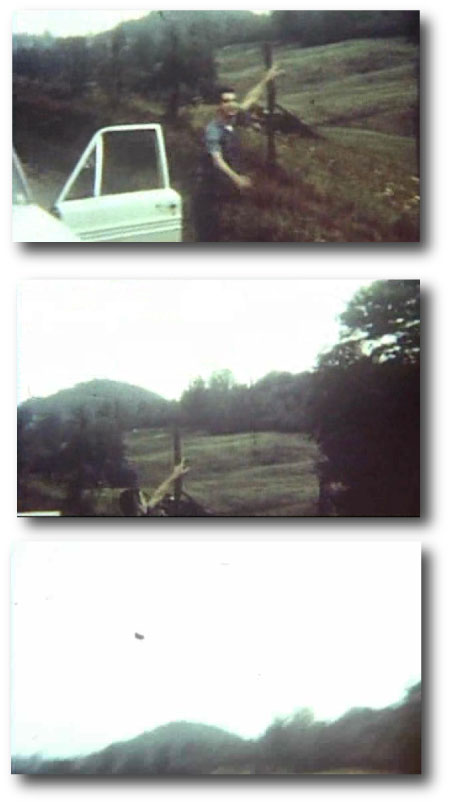
The message in the Cold War flying saucer books was crystal clear. Watch the Skies. And I did — on many clear dark Central Illinois nights with a Sears catalog 50mm refracting telescope…

Back to Friday’s class. We adopted the following form for the Fermi-Drake equation
$${N} = \Lambda ~f_{\star \rm{app}}~f_{\rm pl}~f_{\rm quqHP}~f_{\rm life}~f_{\rm macro}~f_{\rm intel}~f_{\rm tech}~L\,,$$
where \(N\) is the number of broadcasting civilizations in the galaxy, \(\Lambda\) is the number of stars formed per year in the Milky Way, \(f_{\star \rm{app}}\) is the fraction of stars with main sequence lifetimes long enough to support the development of a broadcasting civilization, \(~f_{\rm pl}\) is the fraction of stars with planets, \(~f_{\rm HP}\) is the average number of “habitable” planets per star, \(~f_{\rm life}\) is the fraction of these habitable planets that develop life, \(~f_{\rm macro}\) is the fraction of life-bearing planets that develop macroscopic life, \(~f_{\rm intel}\) is the fraction of macroscopic life-bearing planets that develop an “intelligent” life form (e.g. one that can orient itself abstractly in time), \(~f_{\rm tech}\) is the fraction of intelligent species that develop an understanding of the Maxwell Equations and build radios, and \(L\) is the civilization lifetime in years.

We defined and estimated two versions of \(L\). \(L_{\rm radio}\) is the average length of a time that a civilization leaks modulated electromagnetic signals into space. \(L_{\rm extinct}\) is the lifetime of the civilization, marked from the understanding of Maxwell’s equations to the point where the equations are collectively no longer understood.

The first few terms in the equation have been elevated from the realm of science fiction. I’ve adopted values of \(~\Lambda=10\,{\rm stars~yr^{-1}}\), \(~f_{\star \rm{app}}=0.75\), and \(~f_{\rm pl}=0.75\). Note that \(~\Lambda=10\,{\rm stars~yr^{-1}}\) is admittedly on the high side, even for 4.5 Gyr ago when star formation was somewhat more prevelant in the Galaxy.

Here is the table of values for the unknown terms, as estimated by the class members. I tried not to influence the results by telegraphing currently fashionable guesses. Twenty responses were collected:

\(f_{\rm HP}\) \(f_{\rm Life}\) \(f_{\rm Macro}\) \(f_{\rm Intel}\) \(f_{\rm Tech}\) \(L_{\rm Radio}\) \(L_{\rm Extinct}\)
0.10 0.01 0.3 0.1 0.2 1000 100000
0.10 0.70 0.01 0.6 0.001 500 10000
0.40 0.60 0.01 0.1 0.9 500 3000
0.20 0.90 0.08 0.4 0.002 500 500
0.01 0.90 0.05 0.001 0.2 1000 10000
0.01 0.1 0.1 0.01 0.001 1000 1000
0.10 0.01 0.1 0.1 0.01 100 1000
0.40 0.1 0.05 0.5 0.6 100000000 1000000
0.01 0.4 0.01 0.01 0.9 1000 10000
0.30 0.001 0.032 0.6 0.001 200 200
0.01 0.8 0.1 0.7 0.9 1000 1000
0.10 0.0001 0.01 0.001 0.02 500 150
0.10 0.2 0.1 0.01 0.1 10000 100000
0.10 0.9 0.25 0.01 0.5 10000 500000
0.30 0.001 0.01 0.6 0.9 500 3000
0.30 0.05 0.3 0.01 0.01 1000 1000
0.10 0.01 0.1 0.00001 0.00000001 300 5000
0.30 0.01 0.00001 0.01 0.0001 5000 5000
0.05 0.01 0.03 0.3 0.015 1000 150
0.02 0.01 0.1 0.01 0.001 100 100

With results:

Civilizations Currently Broadcasting in the Milky Way Galaxy
Average # 16,875
Median # 0.0016
Standard deviation 73,500
Max 337,500
Min 2.8125e-13

Civilizations Currently Present in the Milky Way Galaxy
Average # 185
Median # 0.013
Standard deviation 735
Max 3,375
Min 2.8125e-13

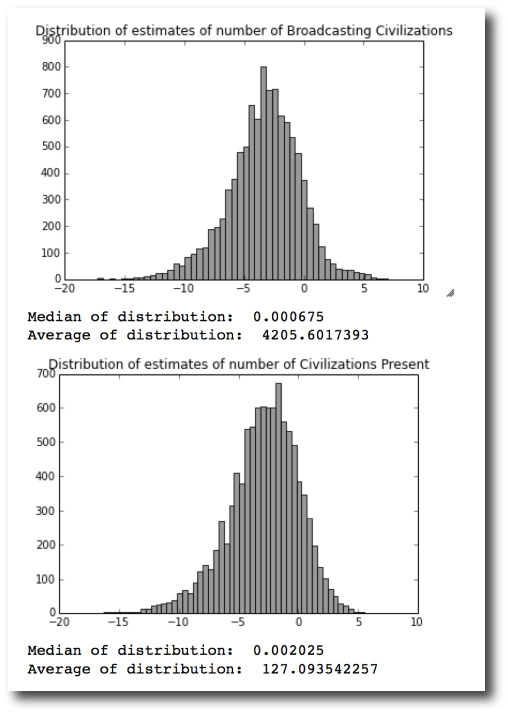
A smooth distribution of estimates for \(~{N}\) can be generated by drawing randomly from the list of estimates for each uncertain term in the equation, and then repeating for many estimates of \(~{N}\). Here are the histograms of estimates for the number of civilizations broadcasting from the galaxy and the number of civilizations present in the galaxy. The \(x\)-axes are \(\log_{10}N\).
Screen-Shot-2014-12-18-at-4.29.07-PM

The estimates point to the possibility that a civilization broadcasts for longer than intelligent members of the species exist. Two people implied this, by submitting values \(L_{\rm radio}>L_{\rm extinct}\). Looking at the table, there is one case where \(L_{\rm radio}\gg L_{\rm extinct} \gg \langle L \rangle\). The large values for \(L\) submitted by this person are causing the Average estimate for \(~{N}\) to substantially exceed the median estimate for \(~{N}\).

Adopting the \({ N=0.002}\) median of this distribution implies we need to look through \(\sim{n=500}\) galaxies to find the nearest broadcasting civilization, and that our nearest neighbors are \(\sim{ 8}\) Megaparsecs away. By the time one receives a message and replies to it, the intended recipient has long since gone extinct.

Rocket Summer

Screen-Shot-2014-12-13-at-12.12.56-PM

In 1997, Ray Bradbury’s The Martian Chronicles was reissued by William Morrow Press. It’s a book that’s on my shelf.

In the original edition, published in 1950, the stories were set in what is now the present day, starting with Rocket Summer, dated to January 1999, and ending with The Million Year Picnic, set in October 2026.

Screen-Shot-2014-12-13-at-12.12.27-PM

For the 1997 edition, the dates for the stories were all pushed back by thirty one years. The rocket summer still lies sixteen years in the future, but the imposed literary device seems hollow, stop-gap, ineffective. Mars of 1950 is a forever different world than Mars of today, which, satisfyingly, is also populated by two waves of explorers from Earth. Meteor-borne archeobacteria, perhaps still clinging to existence in the warmth of the deep subsurface, and a cadre of faintly autonomous, sometimes faintly anthropomorphic robots and satellites that pine eagerly for attention on social media. 2836 tweets. 1.76M followers.

Screen-Shot-2014-12-13-at-12.25.39-PM

50 oklo

Screen-Shot-2014-12-07-at-2.28.58-PM

In writing about the rise of the data centers earlier this year, I suggested the “oklo” as the cgs unit for one artificial bit operation per gram per second. That post caught the eye of the editor at Nautilus Magazine, who commissioned a longer-form article and a series of short interviews, which are on line here.

In writing the Nautilus article, it occurred to me that the qualifier “artificial” is just that: artificial. A bit operation in the service of computation should stand on its own, without precondition, and indeed, the very word oklo serves to reinforce the lack of any need to draw a distinction. The Oklo fossil reactors operated autonomously, without engineering or direction more than two billion years ago. In so doing, they blurred snap-judgment distinctions between the natural and the artificial.

Several years ago, Geoff Manaugh wrote thoughtfully about the Oklo reactors, drawing a startling connection to a passage in the second of William S. Burroughs’s cut-up novels:

I’m reminded again here of William Burroughs’s extraordinary and haunting suggestion, from his novel The Ticket That Exploded, that, beneath the surface of the earth, there is “a vast mineral consciousness near absolute zero thinking in slow formations of crystal.” Here, though, it is a mineral seam, or ribbon of heavy metal—a riff of uranium—that stirs itself awake in a regularized cycle of radiative insomnia that disguises itself as a planet. Brainrock.

Revising the definition,

1 oklo = 1 bit operation per gram of system mass per second,

brings the information processing done by life into consideration. Our planet has been heavily devoted to computation not just for the past few years, but for the past few billion years. Earth’s biosphere, when considered as a whole, constitutes a global, self-contained infrastructure for copying the digital information encoded in strands of DNA. Every time a cell divides, roughly a billion base pairs are copied, with each molecular transcription entailing the equivalent of ~10 bit operations. Using the rule of thumb that the mass of a cell is a nanogram, and an estimate that the Earth’s yearly wet biomass production is 1018 grams, this implies a biological computation of 3×1029 bit operations per second. Earth, then, runs at 50 oklo.

Using the Landauer limit, Emin=kTln2, for the minimum energy required to carry out a bit operation, the smallest amount of power required to produce 50 oklo at T=300K is ~1 GW. From an efficiency standpoint, DNA replication by the whole-Earth computer runs at about a hundred millionth of the theoretical efficiency, given the flux of energy from the Sun. The Earth and its film of cells does lots of stuff in order to support the copying of base pairs, with the net result being ~200,000 bit operations per erg of sunlight globally received.

Viewed in this somewhat autistic light, Earth is about 10x more efficient that the Tianhe-2 supercomputer, which draws 17,808KW to run at 33.8 Petaflops.


Brown Dwarfs

BD

The layout of the solar system is at least moderately atypical. There should be roughly four Earth masses worth of planets inside Mercury’s orbit. And Jupiter, with its large mass, its close-to-circular orbit, and its 10+ year period is an oddball at the 10% (and probably more impressive) level.

At the start of the 1990s, the narrative for how the future, futuristic discovery of extrasolar planets would unfold was informed by the contents of the solar system. I was supposed to be doing my thesis work on modeling the infrared spectra of protostars. But somehow, L1551, and its spartan low-res spectrum, seemed dull and unappealing and far away from any every-day concern. Then, as now, the evolution of protostellar disks sternly needed to be understood. Look at the first page of any review article on protostellar disks from two decades ago. Save the references, it could be employed in almost unaltered form today. I avoided walking past my adviser’s door due to my creeping, near-complete lack of any progress.

At that time, Doppler velocity measurements and astrometry were scheduled to gradually improve to the point where the orbital influences of Jupiter’s extrasolar analogs would eventually become apparent, and that time lay hazily in the future. Brown dwarfs (of which no airtight examples were known) were a way station for the impatient. There seemed something electrifying about the possibility that a dim failed star might be drifting by, just few light years away. I decided to drop the the disk spectra. All at once, I felt energized and engaged. Soon, we had a paper submitted. It was neither a memorable nor an important contribution, but it was the product of a genuine curiosity and focused effort. The upshot of lots of modeling and evolutionary calculations and hand-wringing and earnest e-mails was that “our work affirms the likelihood that the stellar mass function in the solar neighborhood is increasing at masses near the bottom of the main sequence and perhaps at lower masses”. More to the point, the best, wholly uncontroversial guess was that there would end up being about 10 brown dwarfs within 5 parsecs.

In late 1995, 51 Peg b somehow short-circuited the brown dwarfs’ front-row mystique. As the extrasolar planet count mounted, I paid little (or sometimes no) attention to the steady accumulation of discoveries within the Sun’s immediate 5-parsec environs.

Last week, while preparing for my class on order-of-magnitude estimation, I looked at Wikipedia’s list of nearest stars and brown dwarfs. I was surprised to realize that there are now thirteen brown dwarfs and counting within five parsecs, several more than we had guessed back in 1992. I was particularly startled by WISE 0855-0714, which was discovered just this year by Kevin Luhman. It is precisely the object whose prospect seemed so exciting half a lifetime ago. One percent the mass of the Sun. Photosphere plunged into icy deep freeze. Utterly black to the eye, save the occasional faint crackling glow of lightning from deep within.

photographic

Screen-Shot-2014-04-17-at-6.59.14-PM

Kepler 168f has been the subject of substantial media coverage over the past week. This newly confirmed planet orbits a red dwarf with roughly half the mass and radius of the Sun, receives about 27% of the insolation that the Earth receives, and, assuming that it has a terrestrial density, is about 40 to 50% more massive than Earth. On the oklo.org exoplanet valuation scale, designed in 2009 to make objective comparisons between potentially habitable planets, Kepler 186f would buy a round-trip ticket to Newark, clocking in at a respectable $655.

The accompanying image of this planet, however, is absolutely stunning. I stared at it for a long time, tracing the outlines of the oceans and the continents, surface detail vivid in the mind’s eye. Yes, ice sheets hold the northern regions of Kepler 186f in an iron, frigid grip, but in the sunny equatorial archipelago, concerns of global warming are far away. Waves lap halcyon shores drenched in light like liquid gold.

It’s interesting to look at the New York Times articles on habitable planets that have been published over the past century.

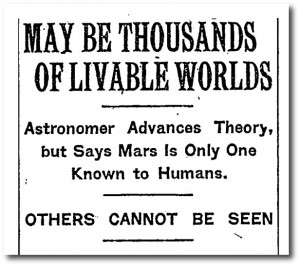
The first mentions are generally associated with reports of stern public talks given by prominent astronomers. For example, this news item, from 1931, is full of shaky typography and unfounded speculations, but it has no illustrations, and is clear up front, furthermore, that pictures are not available.

russellLectureNYT

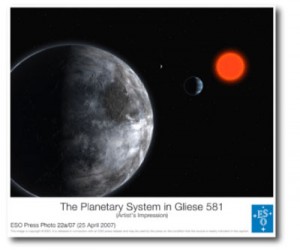
The first actual habitable exoplanet discovery reported by the New York Times was Gliese 581c back in ’07. The press release image for this one looks downright amateurish in comparison to Kepler-168. The lighting, the perspective, and the geometry are all woefully off. The star looks like a traffic stoplight, “red to be exact”.

Screen-Shot-2014-04-19-at-3.59.27-PM

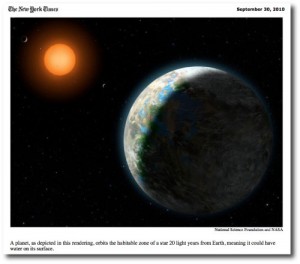
By 2010, front-page-news-making habitable planets still tended to be hand-drawn, but they were beginning to show a few signs of life:
Screen-Shot-2014-04-17-at-9.23.10-PM

A big step forward came in 2011, with this lil’ “Goldilocks” (feat. HD 85512b):

Screen-Shot-2014-04-17-at-9.22.00-PM

I think this was the first NYT-published image of a newly discovered habitable planet that could be misconstrued as a photograph by a reasonable person who did not read the fine print, or who perhaps did not even notice the fine print on the tiny screen of a mobile device on the bus to work.

Super Planet Crush Crash

Screen-Shot-2014-04-08-at-10.31.16-AM

The Crash at Crush is a perennial go-to narrative in the long-running effort to goad disinterested students into obtaining a much-needed grasp of the the principles of classical mechanics.

From the Wikipedia:

Crush, Texas, was a temporary “city” established as a one-day publicity stunt in 1896. William George Crush, general passenger agent of the Missouri-Kansas-Texas Railroad (popularly known as the Katy), conceived the idea to demonstrate a train wreck as a spectacle. No admission was charged, and train fares to the crash site were at the reduced rate of US$2 from any location in Texas. As a result about 40,000 people showed up on September 15, 1896, making the new town of Crush, Texas, temporarily the second-largest city in the state.

It seems that William George Crush either failed (or more likely never enrolled) in Physics 101. The energy released from the impact of the trains and the explosion of their boilers led to several deaths and many injuries among the 40,000 spectators.

Fast-forwarding 118 years, we find that Stefano “Doc” Meschiari, another Texas entrepreneur, has once again harnessed physics in the name of spectacle with his browser-based video game Super Planet Crash. (Name changed at the last moment from Super Planet Crush in order to duck potential legal challenges from the recently IPO’d purveyors of Candy Crush).

In the time-honored tradition of stoking publicity, a press release was just issued:

April 7, 2014
Contact: Tim Stephens (831) 459-2495; stephens@ucsc.edu

Orbital physics is child’s play with Super Planet Crash

A new game and online educational resources are offshoots of the open-source software package astronomers use to find planets beyond our solar system

For Immediate Release

SANTA CRUZ, CA–Super Planet Crash is a pretty simple game: players build their own planetary system, putting planets into orbit around a star and racking up points until they add a planet that destabilizes the whole system. Beneath the surface, however, this addictive little game is driven by highly sophisticated software code that astronomers use to find planets beyond our solar system (called exoplanets).

The release of Super Planet Crash (available online at www.stefanom.org/spc) follows the release of the latest version of Systemic Console, a scientific software package used to pull planet discoveries out of the reams of data acquired by telescopes such as the Automated Planet Finder (APF) at the University of California’s Lick Observatory. Developed at UC Santa Cruz, the Systemic Console is integrated into the workflow of the APF, and is also widely used by astronomers to analyze data from other telescopes.

Greg Laughlin, professor and chair of astronomy and astrophysics at UC Santa Cruz, developed Systemic Console with his students, primarily Stefano Meschiari (now a postdoctoral fellow at the University of Texas, Austin). Meschiari did the bulk of the work on the new version, Systemic 2, as a graduate student at UC Santa Cruz. He also used the Systemic code as a foundation to create not only Super Planet Crash but also an online web application (Systemic Live) for educational use.

“Systemic Console is open-source software that we’ve made available for other scientists to use. But we also wanted to create a portal for students and teachers so that anyone can use it,” Laughlin said. “For the online version, Stefano tuned the software to make it more accessible, and then he went even further with Super Planet Crash, which makes the ideas behind planetary systems accessible at the most visceral level.”

Meschiari said he’s seen people quickly get hooked on playing the game. “It doesn’t take long for them to understand what’s going on with the orbital dynamics,” he said.

The educational program, Systemic Live, provides simplified tools that students can use to analyze real data. “Students get a taste of what the real process of exoplanet discovery is like, using the same tools scientists use,” Meschiari said.

The previous version of Systemic was already being used in physics and astronomy classes at UCSC, Columbia University, the Massachusetts Institute of Technology (MIT), and elsewhere, and it was the basis for an MIT Educational Studies program for high school teachers. The new online version has earned raves from professors who are using it.

“The online Systemic Console is a real gift to the community,” said Debra Fischer, professor of astronomy at Yale University. “I use this site to train both undergraduate and graduate students–they love the power of this program.”

Planet hunters use several kinds of data to find planets around other stars. Very few exoplanets have been detected by direct imaging because planets don’t produce their own light and are usually hidden in the glare of a bright star. A widely used method for exoplanet discovery, known as the radial velocity method, measures the tiny wobble induced in a star by the gravitational tug of an orbiting planet. Motion of the star is detected as shifts in the stellar spectrum–the different wavelengths of starlight measured by a sensitive spectrometer, such as the APF’s Levy Spectrometer. Scientists can derive a planet’s mass and orbit from radial velocity data.

Another method detects planets that pass in front of their parent star, causing a slight dip in the brightness of the star. Known as the transit method, this approach can determine the size and orbit of the planet.

Both of these methods rely on repeated observations of periodic variations in starlight. When multiple planets orbit the same star, the variations in brightness or radial velocity are very complex. Systemic Console is designed to help scientists explore and analyze this type of data. It can combine data from different telescopes, and even different types of data if both radial velocity and transit data are available for the same star. Systemic includes a large array of tools for deriving the orbital properties of planetary systems, evaluating the stability of planetary orbits, generating animations of planetary systems, and performing a variety of technical analyses.

“Systemic Console aggregates data from the full range of resources being brought to bear on extrasolar planets and provides an interface between these subtle measurements and the planetary systems we’re trying to find and describe,” Meschiari said.

Laughlin said he was struck by the fact that, while the techniques used to find exoplanets are extremely subtle and difficult, the planet discoveries that emerge from these obscure techniques have generated enormous public interest. “These planet discoveries have done a lot to create public awareness of what’s out there in our galaxy, and that’s one reason why we wanted to make this work more accessible,” he said.

Support for the development of the core scientific routines underlying the Systemic Console was provided by an NSF CAREER Award to Laughlin.

A Supernova in M82

lamp2014

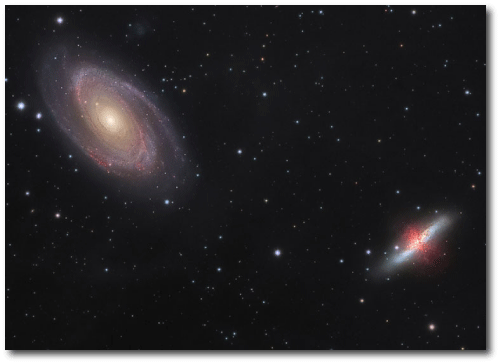
I was startled today to learn that a Type Ia supernova has been spotted in M82 — a very nearby, very bright galaxy that even I can find with a backyard telescope. In the image just below, M82 is the galaxy at the lower right.

And here’s a picture of M82 taken yesterday:

m82sn

Image Source.

The M82 supernova is destined to provide major-league scientific interest. Type Ia supernovae serve as cosmic distance indicators, and yet there are still a number of fundamental unanswered questions about them, including the nature of the precursor white dwarf binary.

Amazingly, it appears that the supernova went unremarked for nearly a week as it increased in brightness by more than a factor of a hundred. Reports indicate that the first team to notice the supernova consisted of Steve Fossey and a group of undergraduate students who were doing a class-related exercise at the University of London Observatory (in the city of London). From the UCL press release (which makes great reading):

Students and staff at UCL’s teaching observatory, the University of London Observatory, have spotted one of the closest supernova to Earth in recent decades. At 19:20 GMT on 21 January, a team of students – Ben Cooke, Tony Brown, Matthew Wilde and Guy Pollack – assisted by Dr Steve Fossey, spotted the exploding star in nearby galaxy Messier 82 (the Cigar Galaxy).

The discovery was a fluke – a 10 minute telescope workshop for undergraduate students that led to a global scramble to acquire confirming images and spectra of a supernova in one of the most unusual and interesting of our near–neighbour galaxies.

Oklo readers will remember that Steve Fossey (along with Ingo Waldmann and David Kipping ) was a co-discoverer of the transits of HD 80606b, work which was also carried out with small telescopes within the London City limits. In February 2009, Steve and I had many e-mails back and forth as he agonized over whether the HD 80606b transit detection had been made with enough confidence to warrant sticking one’s neck out. I always felt a little bad that I advised, what is in retrospect inordinate, caution, having personally experienced several previous bouts of transit fever. As it happened, Fossey, Waldmann and Kipping were barely edged out of making the first announcement by Garcia-Melendo and McCullough and by the French-Swiss team led by Claire Moutou.

So I was thrilled to see that Steve and his students have pulled this one off. I wrote him a quick note of congratulations, to which he replied:

The frantic days of homing in on dear old ‘606 feels like an easy ride, compared to the last 24 hours!

All over the map

IMG_1815

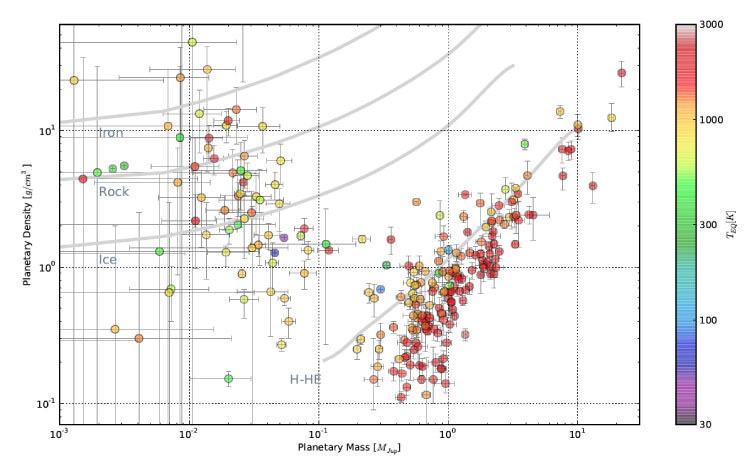
The photometry from the Kepler Mission stopped flowing a while back, but results from the Mission will likely be arriving for decades to come. It’s interesting to look at how the mass-density diagram for planets is filling in. The plot below contains a mixture of published planets scraped from the database at exoplanets.org, as well as a fairly substantial number that haven’t hit the presses yet, but which have been featured in various talks. The temperature scale corresponds to the equilibrium planetary temperature, which is a simple function of the parent star’s radius and temperature, and of the planetary semi-major axis and eccentricity. The solar system planets can be picked out of the diagram by looking for low equilibrium temperatures and non-existent error bars.

Screen-Shot-2013-11-16-at-3.10.31-PM

It’s especially interesting to see the region between Earth and Uranus getting filled in. Prior to 2009, there were no density measurements for planets in this region, and prior to 2005, there were no known planets in this region. Now there are a couple dozen measurements, and they show a rather alarming range of sizes. A lot of those “terrestrial” planets out there might not be particularly terrestrial.

3:45

Screen-Shot-2013-09-28-at-5.51.51-PM

I’ve written several times, most recently last year, about the Pythagorean Three-Body Problem, which has just marked its first century in the literature (See Burrau, 1913).

Assume that Newtonian Gravity is correct. Place three point bodies of masses 3, 4, and 5 at the vertices of a 3-4-5 right triangle, with each body at rest opposite the side of its respective length. What happens?

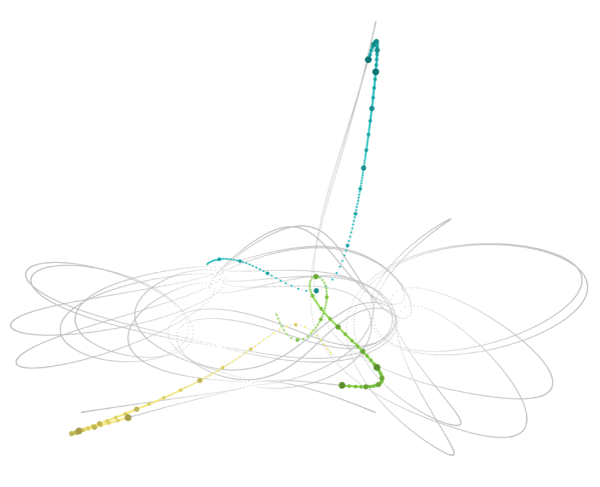
The solution trajectory is extraordinary in its intricate nonlinearity, and lends itself to an anthropomorphic narrative of attraction, entanglement and rejection, with bodies four and five exiting to an existential eternity of No Exit, and body three consigned to an endless asymptotic slide toward constant velocity.

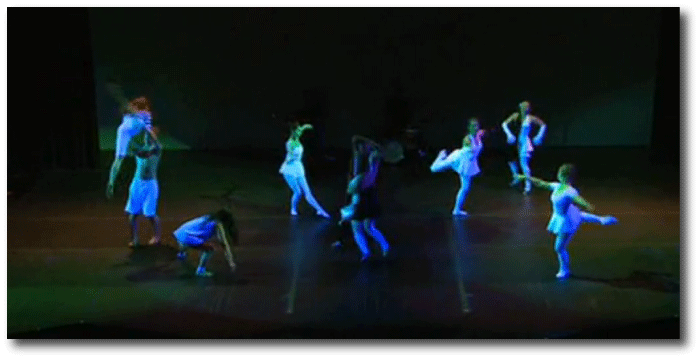
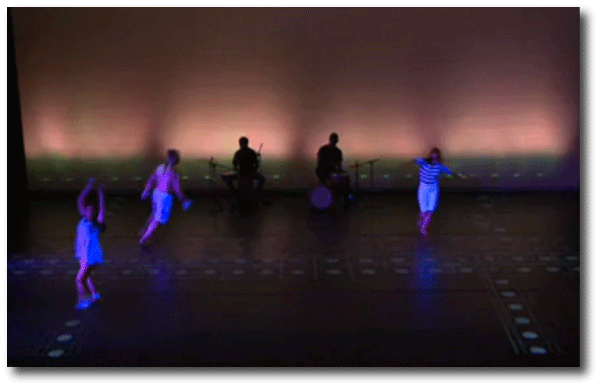
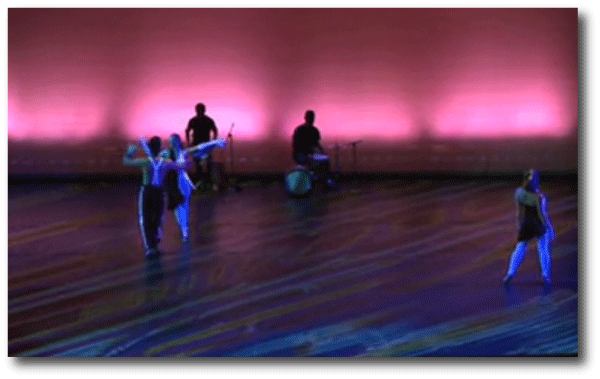
This past academic year, I worked with Ted Warburton, Karlton Hester, and Drew Detweiler to stage an interpretive performance of the problem, along with several of its variations. The piece was performed by UCSC undergraduates and was part of the larger Blueprints year-end festival. Here is a video of the entire 17 minute program.

The first of the four segments is an enactment of the standard version of the problem (As set above), and was done with a ballet interpretation to underscore that this is the “classical” solution. Prior to joining the faculty at UCSC, Ted was a principal dancer at the American Ballet Theater, and so the cohoreography was in an idiom where he has a great deal of experience.

The score for the performance was performed live, and is based wholly on percussion parts for each of the three bodies. The interesting portion of the dynamics is mapped to 137.5 measures, which satisfyingly, last for three minutes and forty five seconds.

Screen-Shot-2013-09-28-at-4.57.36-PM

The nonlinearity of the Pythagorean Problem gives it a sensitive dependence to initial conditions. It is subject to Lorenz’s Butterfly Effect. For the second segment of the performance, we chose a version of the problem in which body three is given a tiny change in its initial position. Over time, the motion of the bodies departs radically from the classical solution, and the resolution has body three leaving with body five, while body four is ejected. A more free-flowing choreography was drawn on to trace this alternate version.

Screen-Shot-2013-09-28-at-5.03.20-PM

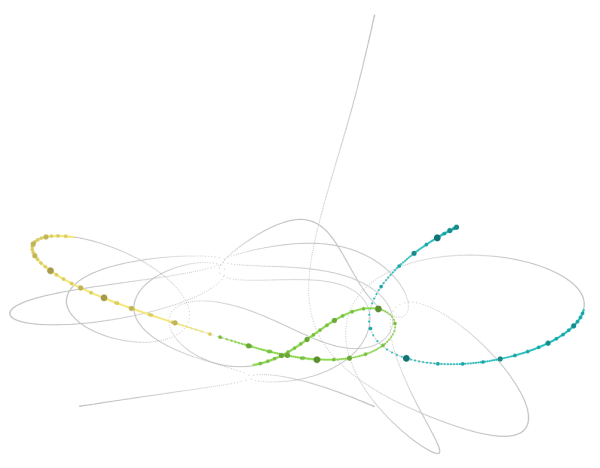
A fascinating aspect of the problem is that while the solution as posed is “elliptic-hyperbolic”, there exist nearby sets of initial conditions in which the motion is perfectly periodic, in the sense that the bodies return precisely to their initial positions, and the sequence repeats forever. In the now-familiar solution to the classical version of the problem, the bodies manage to almost accomplish this return to the 3-4-5 configuration at a moment about half-way through the piece. This can be seen just after measure 65, at which time body 4 (yellow), body 5 (green), and body 3 (blue) are nearly, but are not exactly, at their starting positions, and are all three moving quite slowly:
Screen-Shot-2013-09-28-at-5.09.40-PM

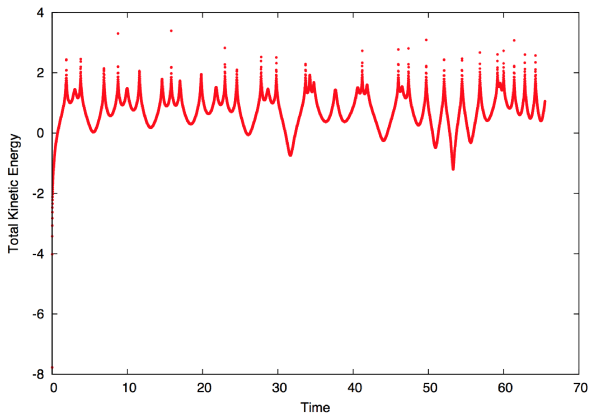
If the bodies all manage to come to rest, then the motion must reverse and retrace the trajectories like a film run backward. With this realization, one can plot the summed kinetic energy of the bodies, which is a running measure of the amount of total motion. Note the logarithmic y-axis:
Screen-Shot-2013-09-28-at-5.15.49-PM

The bodies return close to their initial positions at Time = 31, at which time there is a local minimum in the total kinetic energy.

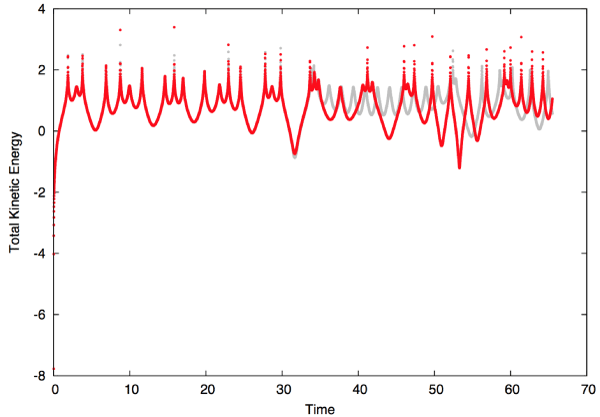
Next, look at the effect of making a small change in the initial position of one of the bodies. To do this, I arbitrarily perturbed the initial x position of body 3 by a distance 0.01 (a less than one percent change), and re-computed the trajectories. The kinetic energy measurements of this modified calculation are plotted as gray. During the first half of interactions the motion is extremely similar, but that the second half is very different. Interestingly, the gray curve reaches a slightly deeper trough at Time = 31. The small change has thus created a solution that is slightly closer to the pure periodic ideal.
Screen-Shot-2013-09-28-at-5.27.43-PM

I next used a variational approach to adjust the initial positions in order to obtain solutions that have progressively smaller Kinetic energy at time 31. In this way, it’s easy to get arbitrarily close to periodicity. The motion in a case that is quite close to (but not quite exactly at) the periodic solution is shown just below. After measure 65, the bodies arrive very nearly exactly at their initial positions, and, for the measures shown in the plot below, they have started a second, almost identical run through the trajectories.

Screen-Shot-2013-09-28-at-5.35.39-PM

The perfectly periodic solution occurs when bodies 4 and 5 experience a perfect head-on collision at time ~15 (around measure 33). If this happens, bodies 4 and 5 effectively rebound back along their trajectory of approach, and the motion retraces, therefore repeating endlessly. Here’s the action which shows the collision:
Screen-Shot-2013-09-28-at-5.42.46-PM

Ted suggested that Tango and Rhumba could be the inspiration for the choreography of the perfectly periodic solution. I was skeptical at first, but it was immediately evident that this was a brilliant idea. The precision of the dancing is exceptional, and the emotion, while exhibiting passion, is somehow also controlled and slightly aloof. No jealousy is telegraphed by motion, allowing the sequence to repeat endlessly in some abstract plane of the minds eye.

Screen-Shot-2013-09-28-at-5.49.27-PM