worn down

A hypothesis which posits a linear sequence of events rarely works in the real world. Nonetheless, we took a crack at just such a simplistic shopping-list sequence:

  1. Venus had water oceans, an atmospheric pressure of order a bar, and plate tectonics.
  2. Steadily increasing solar luminosity drove a runaway moist greenhouse.
  3. Rapid erosion occurred as the oceans were being lost.
  4. Erosion ceased and plate tectonics shifted to stagnant lid volcanism.

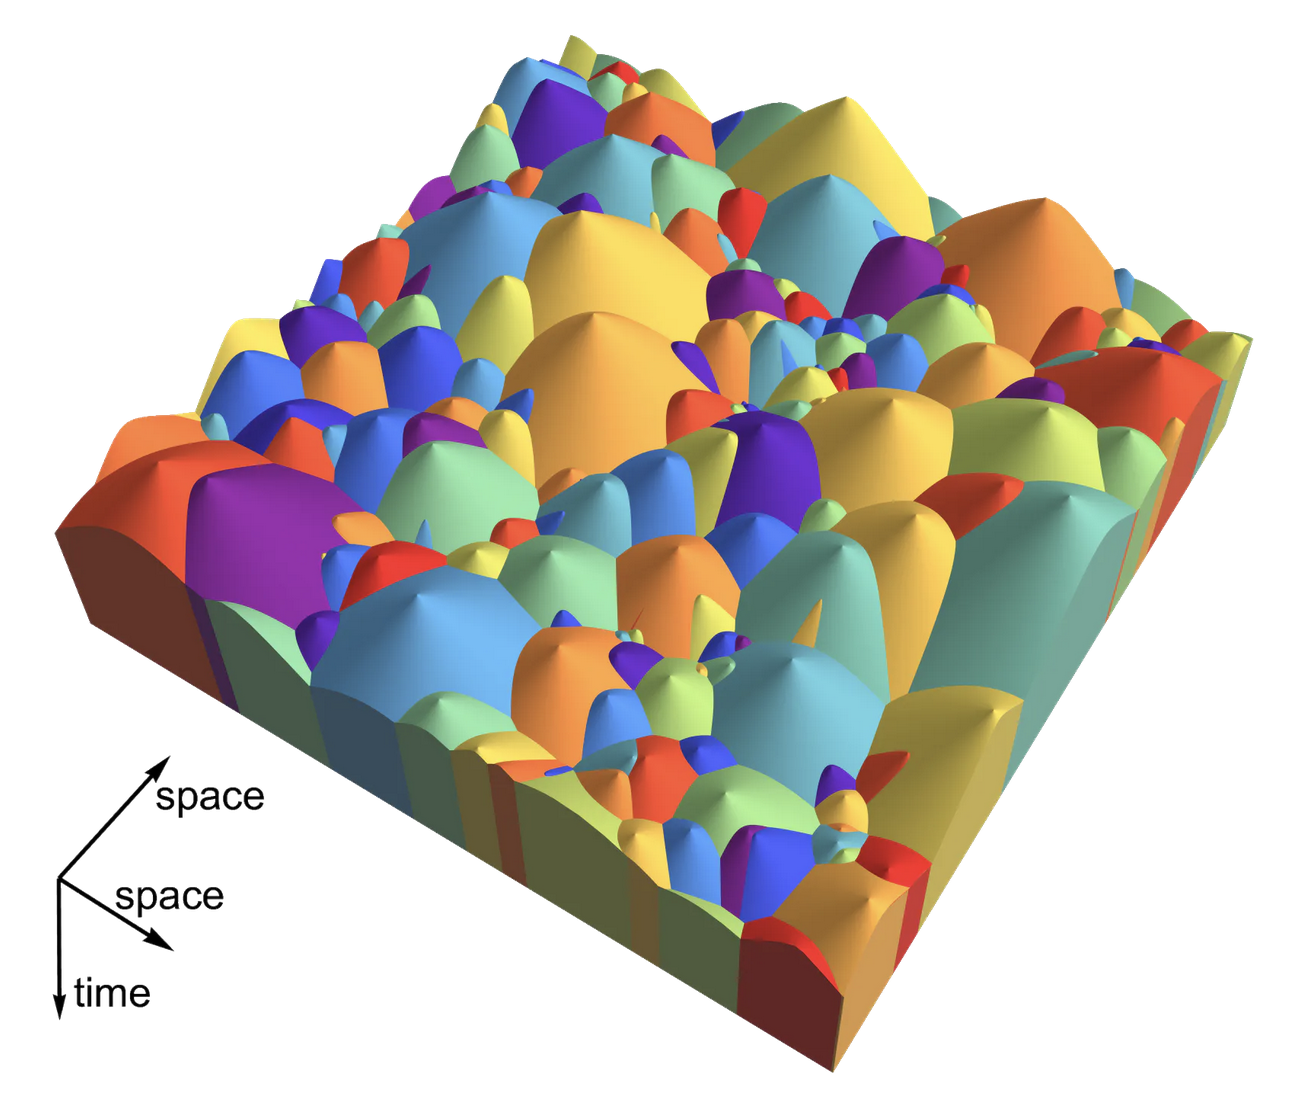
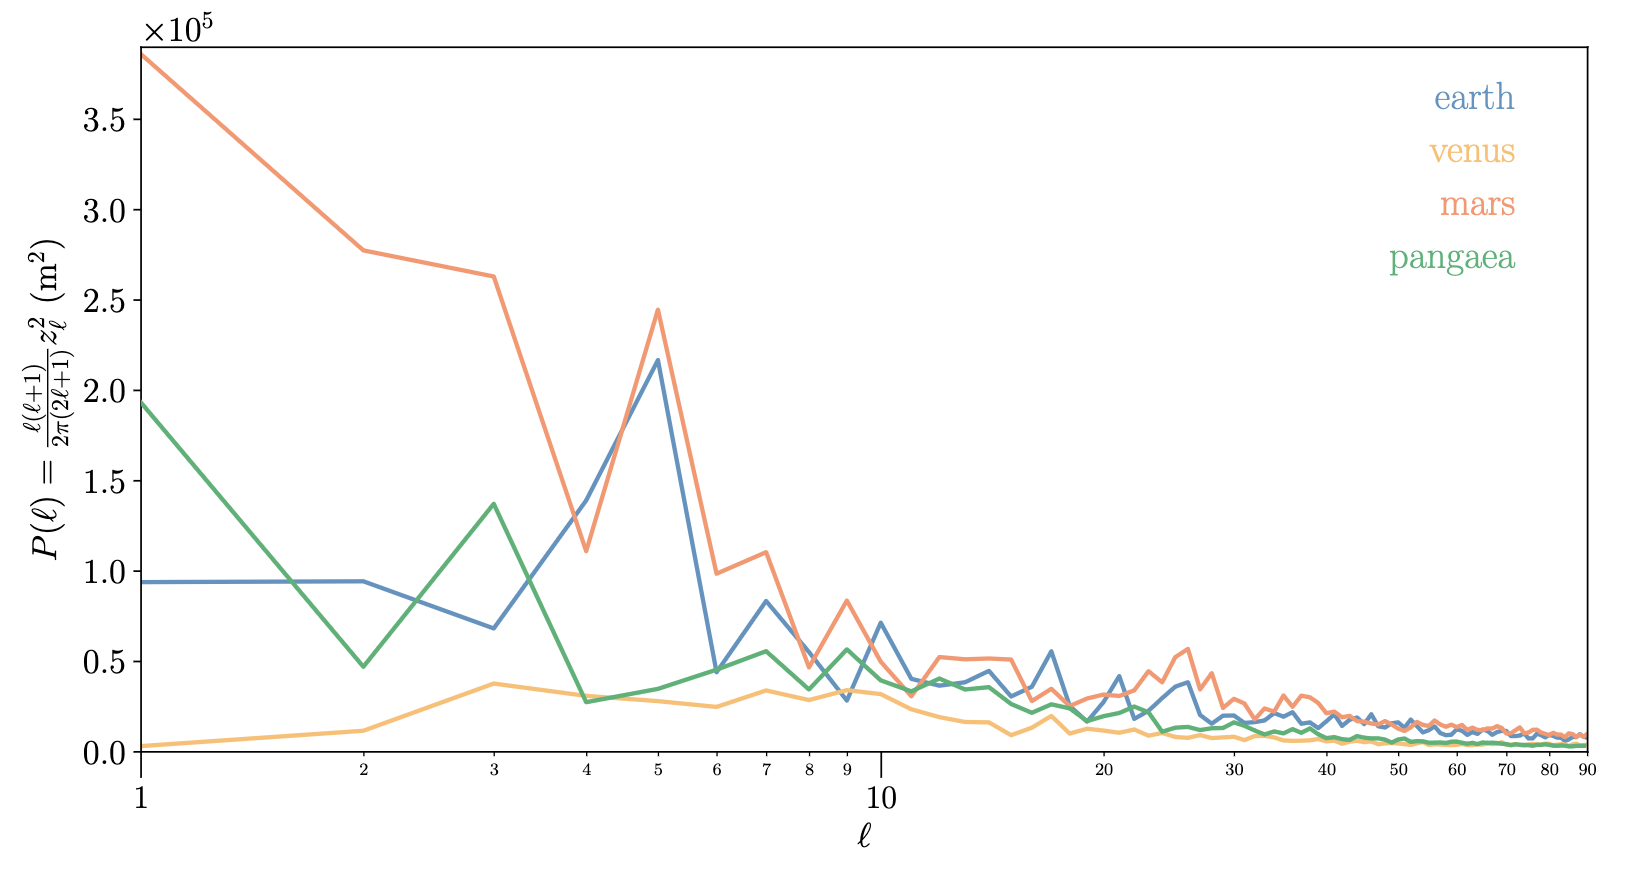
It’s straightforward to irresponsibly tweak a model that draws on those four events to turn the Earth’s topographical power spectrum into one that channels modern-day Venus. Rapid erosion pretty much flattens the planet out entirely in the absence of tectonic uplift. Then static-lid emplacement of igneous provinces at a pace of order a cubic kilometer per year builds the spectrum back up to what we see today. And a cherry on top: assume that the lava production rate for Venus is the same as for Earth. This means that Venus was habitable up to about 500 Myr ago, that is, up to around around the same time as the Cambrian Explosion. Intoxicating stuff.

Understandably, this modeling approach got a lot of static from the referee. There are potential problems with all of points one through four above, and more generally, we attacked the problem from the standpoint of shocking naivete. It’s a shoot first, ask questions later mentality applied to the scientific enterprise. Submit first, read the literature later.

I do think there’s something to be said for the quick-draw approach, though. Mötley Crüe recorded Too Fast For Love in a couple of days on a budget where packs of Marlboros were material. Then, less than a decade on, it took them something like year to finish Dr. Feelgood at enormous expense. The point is, there’s a risk of getting bogged down if one strives for dissertation defense level completism.

Also, did I mention that I’m a fan of the GPT architecture?

At any rate, on point three of our four-point plan, we got the following criticism from the referee: The authors seem unaware that erosion of broad continents is slow. We still have 55 million year old Laramide topography in Colorado. See old paper by Clem Chase.

I was indeed unaware of that. The sediment load of the Mississippi River is 500 million metric tons per year. That corresponds to a removal of 0.25 cubic kilometers of rock per year. The Mississippi’s watershed is 3.2 million square kilometers (and includes Colorado). In the absence of uplift, North America’s topography is sanding down at a rate of a kilometer (3280 feet) per 12.8 million years. That makes the presence of the Flatirons outside of Boulder indeed something of a puzzle…

According to the Wikipedia, “Whataboutism or whataboutery (as in “what about…?”) is a pejorative for the strategy of responding to an accusation with a counter-accusation instead of a defense against the original accusation.”

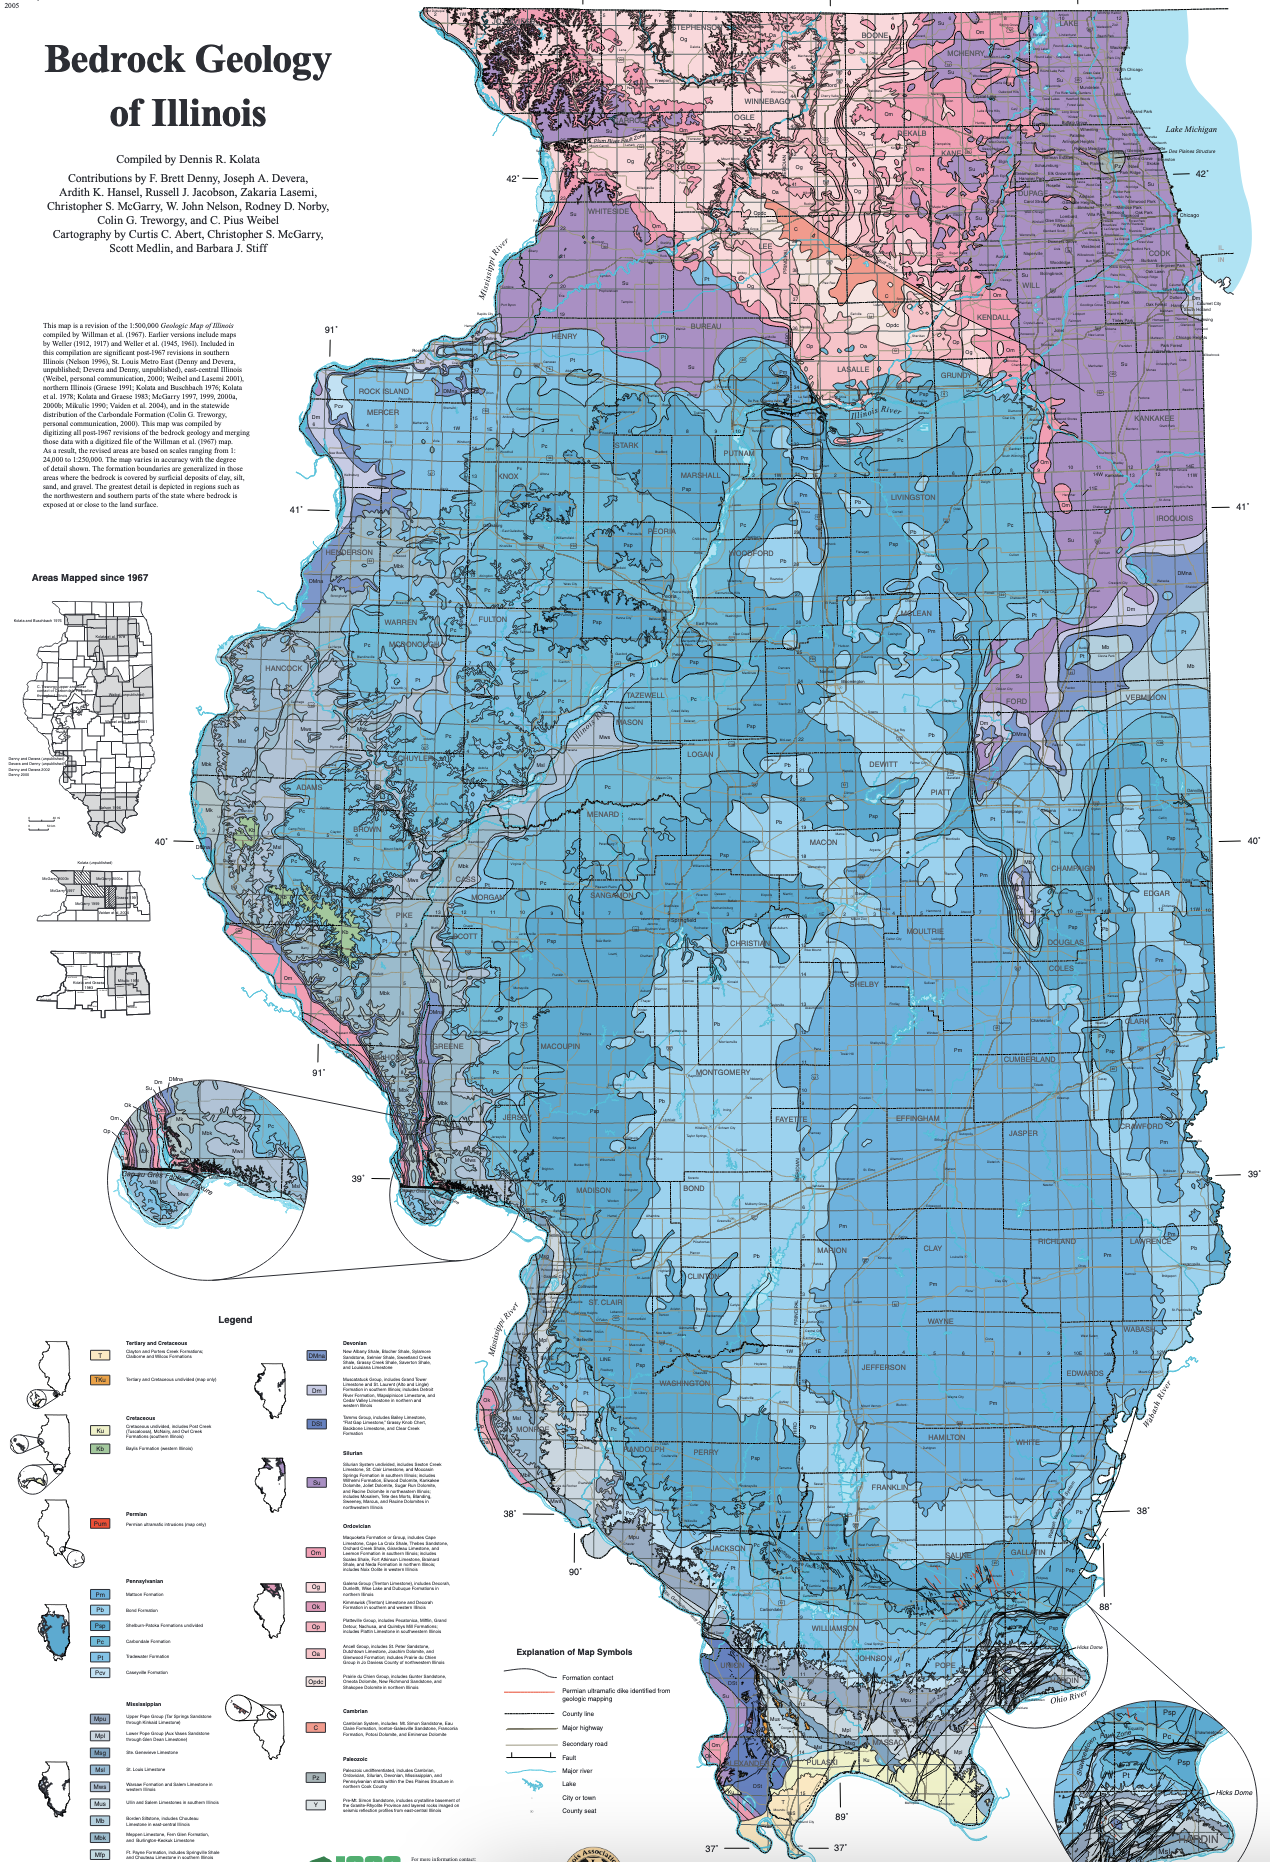
So what about that strange geological feature on the border of Champaign and Douglas counties in East-Central Illinois?

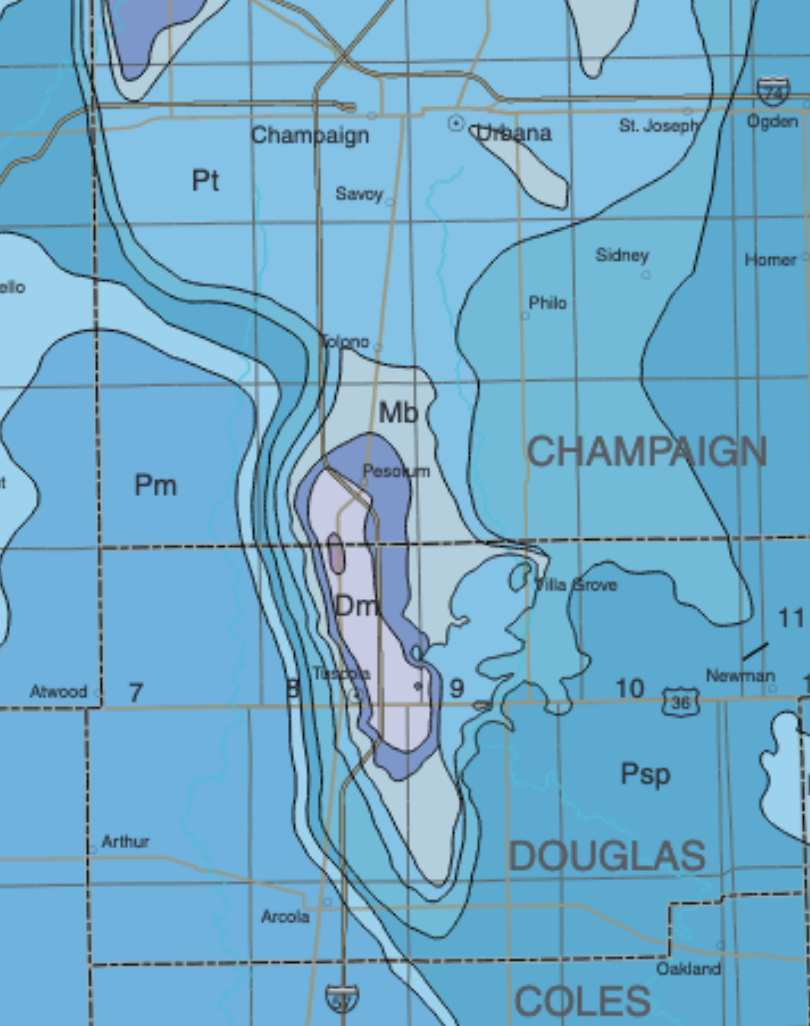
The tiny cornfield-sized purple ellipse in the center of the bedrock map corresponds to the Silurian Moccasin Springs formation which consists of 420-million year old reefs. Moving out from the bulls-eye core, are bedrock rims of middle Devonian rocks, the New Albany Shale, the Borden Siltstone, the Tradewater Formation, the Carbondale Formation, the Shelburn Patoka Formation, the Bond Formation, and finally several miles to the east, the 296-million year old rocks of the Mattoon Formation. At some point in the past 296 million years, something pushed the Silurian rocks upward by roughly 2000 feet. From a bedrock perspective, the severity of the uplift is similar to what one finds on Baseline Road in Boulder Colorado, which provides a good view of that Laramide topography mentioned by our referee:

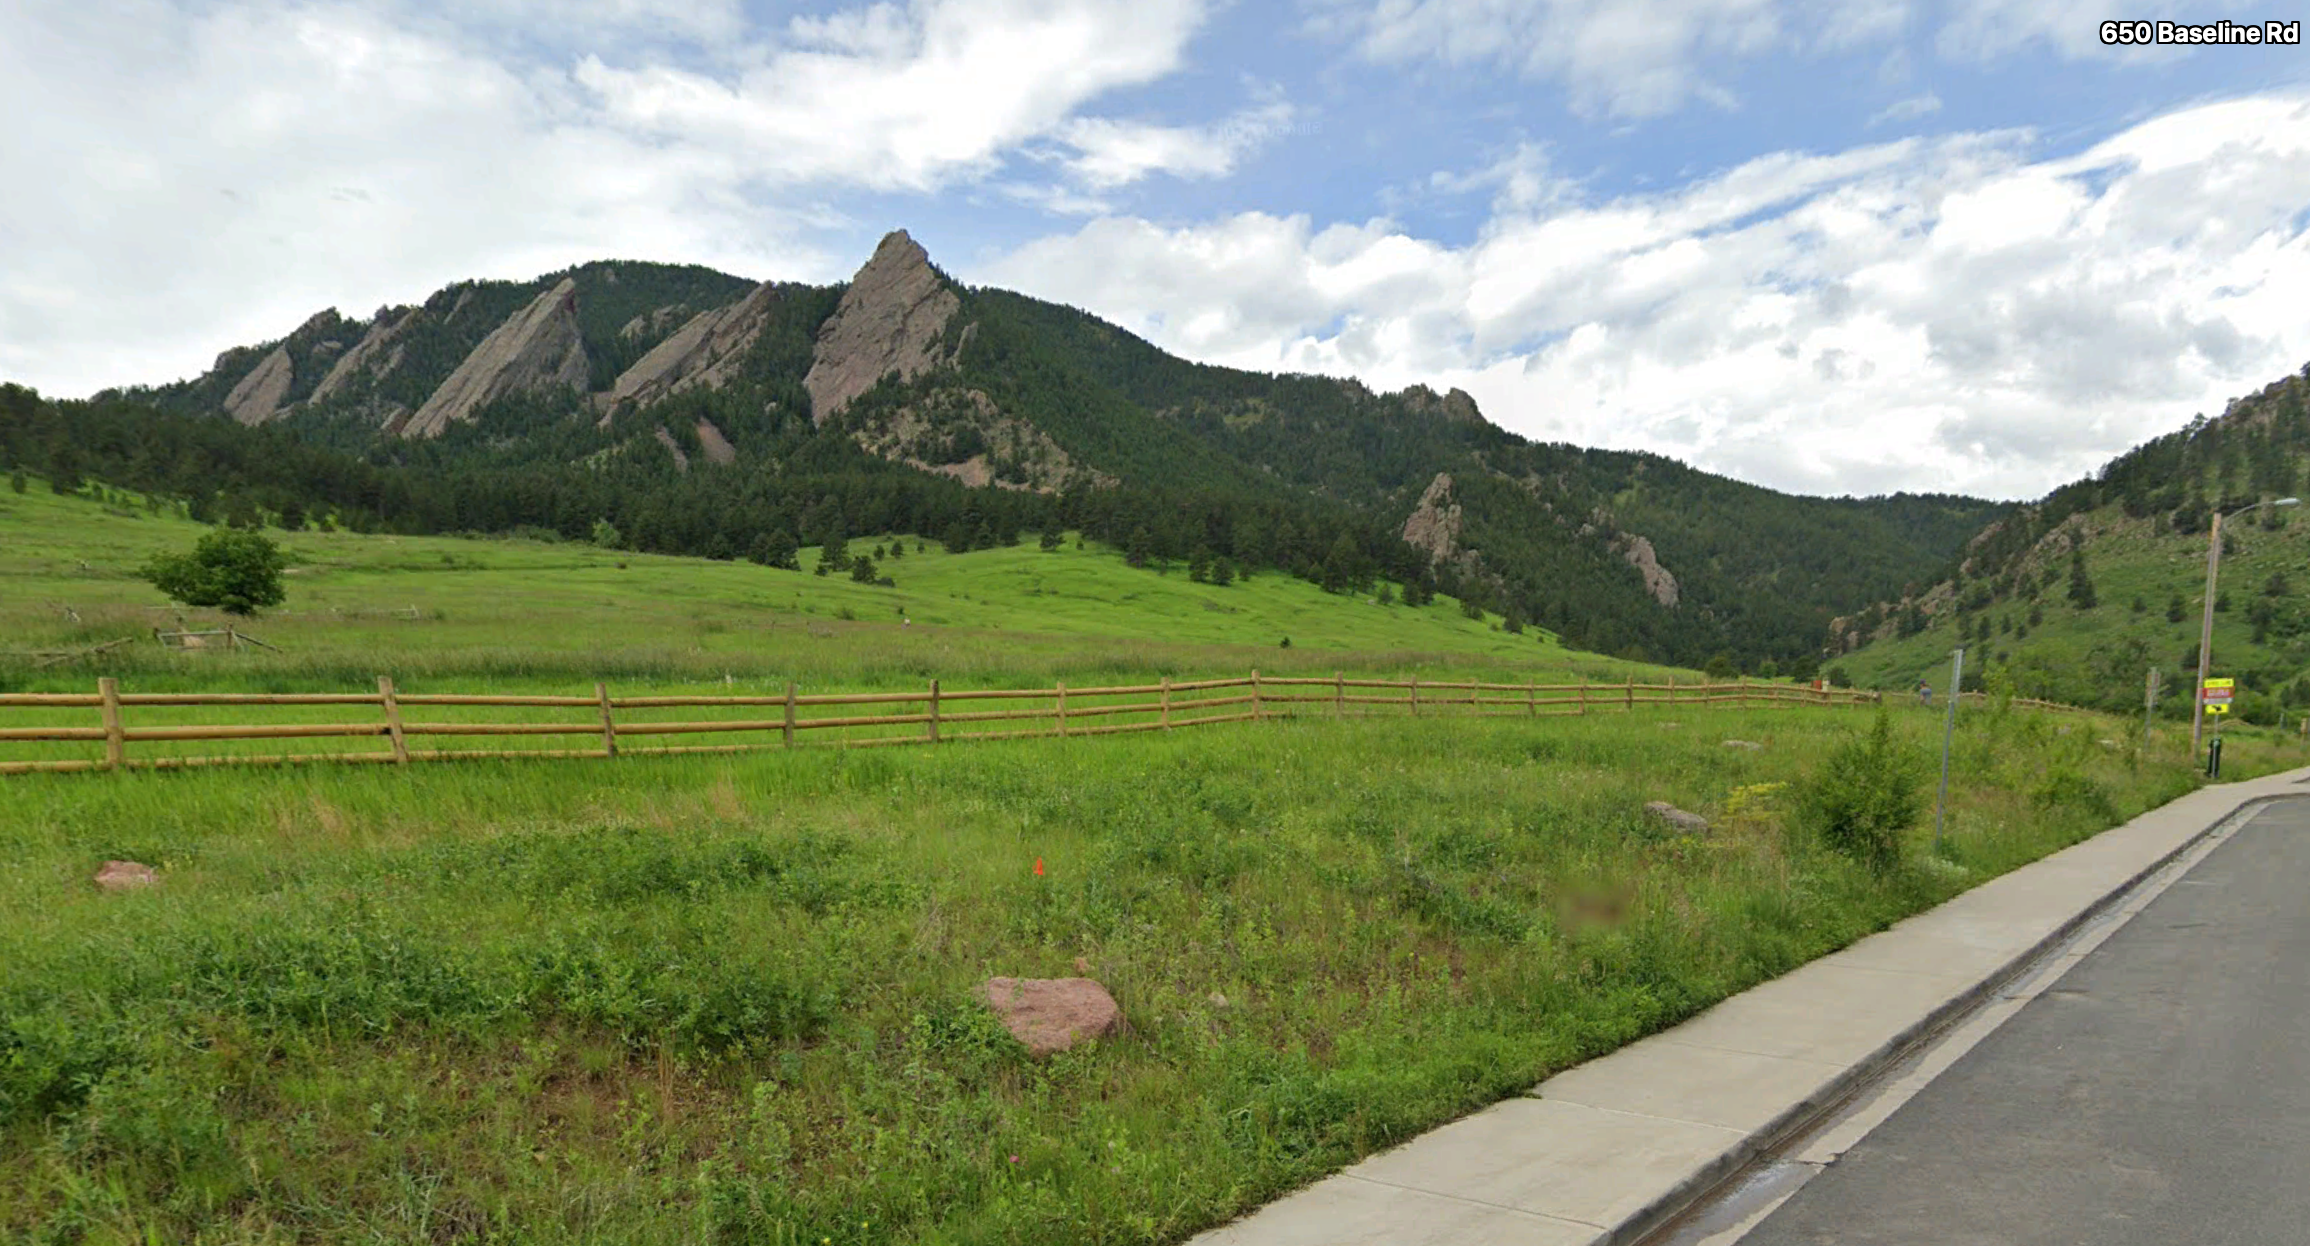
The sandstone rocks of the Fountain Formation that make up the Flatirons are, coincidentally, also 296 million years old. They were deposited in alluvial fans at the same time as shallow water sediments were piling up to create the Mattoon formation.

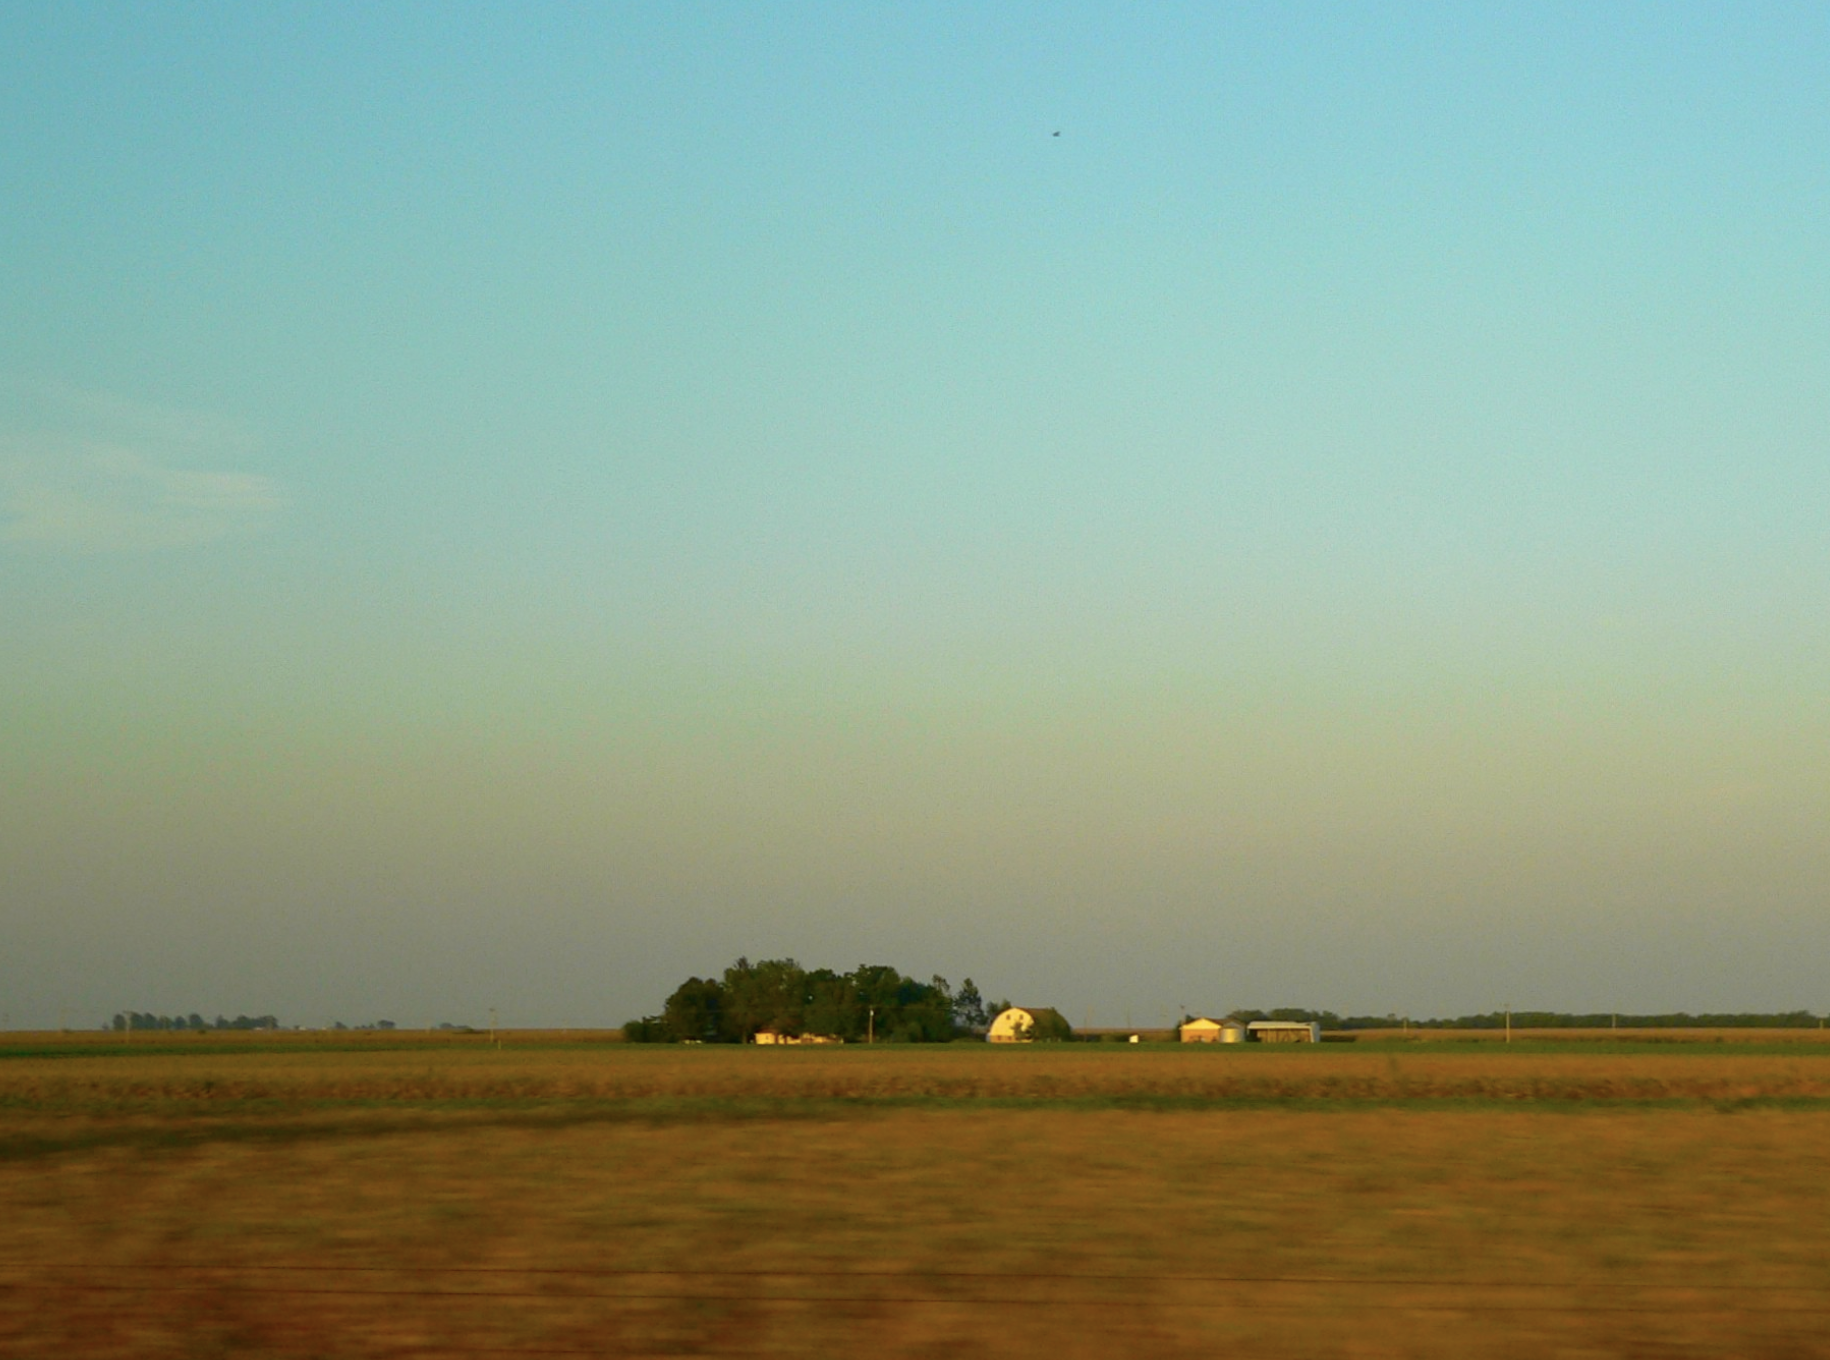
Dropping into Champaign County Road 100 North, at the point where the age gradient of the bedrock reaches its maximum, reveals an absolutely flat landscape. Zero hint of the weird stratigraphy that lurks just beneath the 12,000-year-old veneer of Wisconsin glacial till.

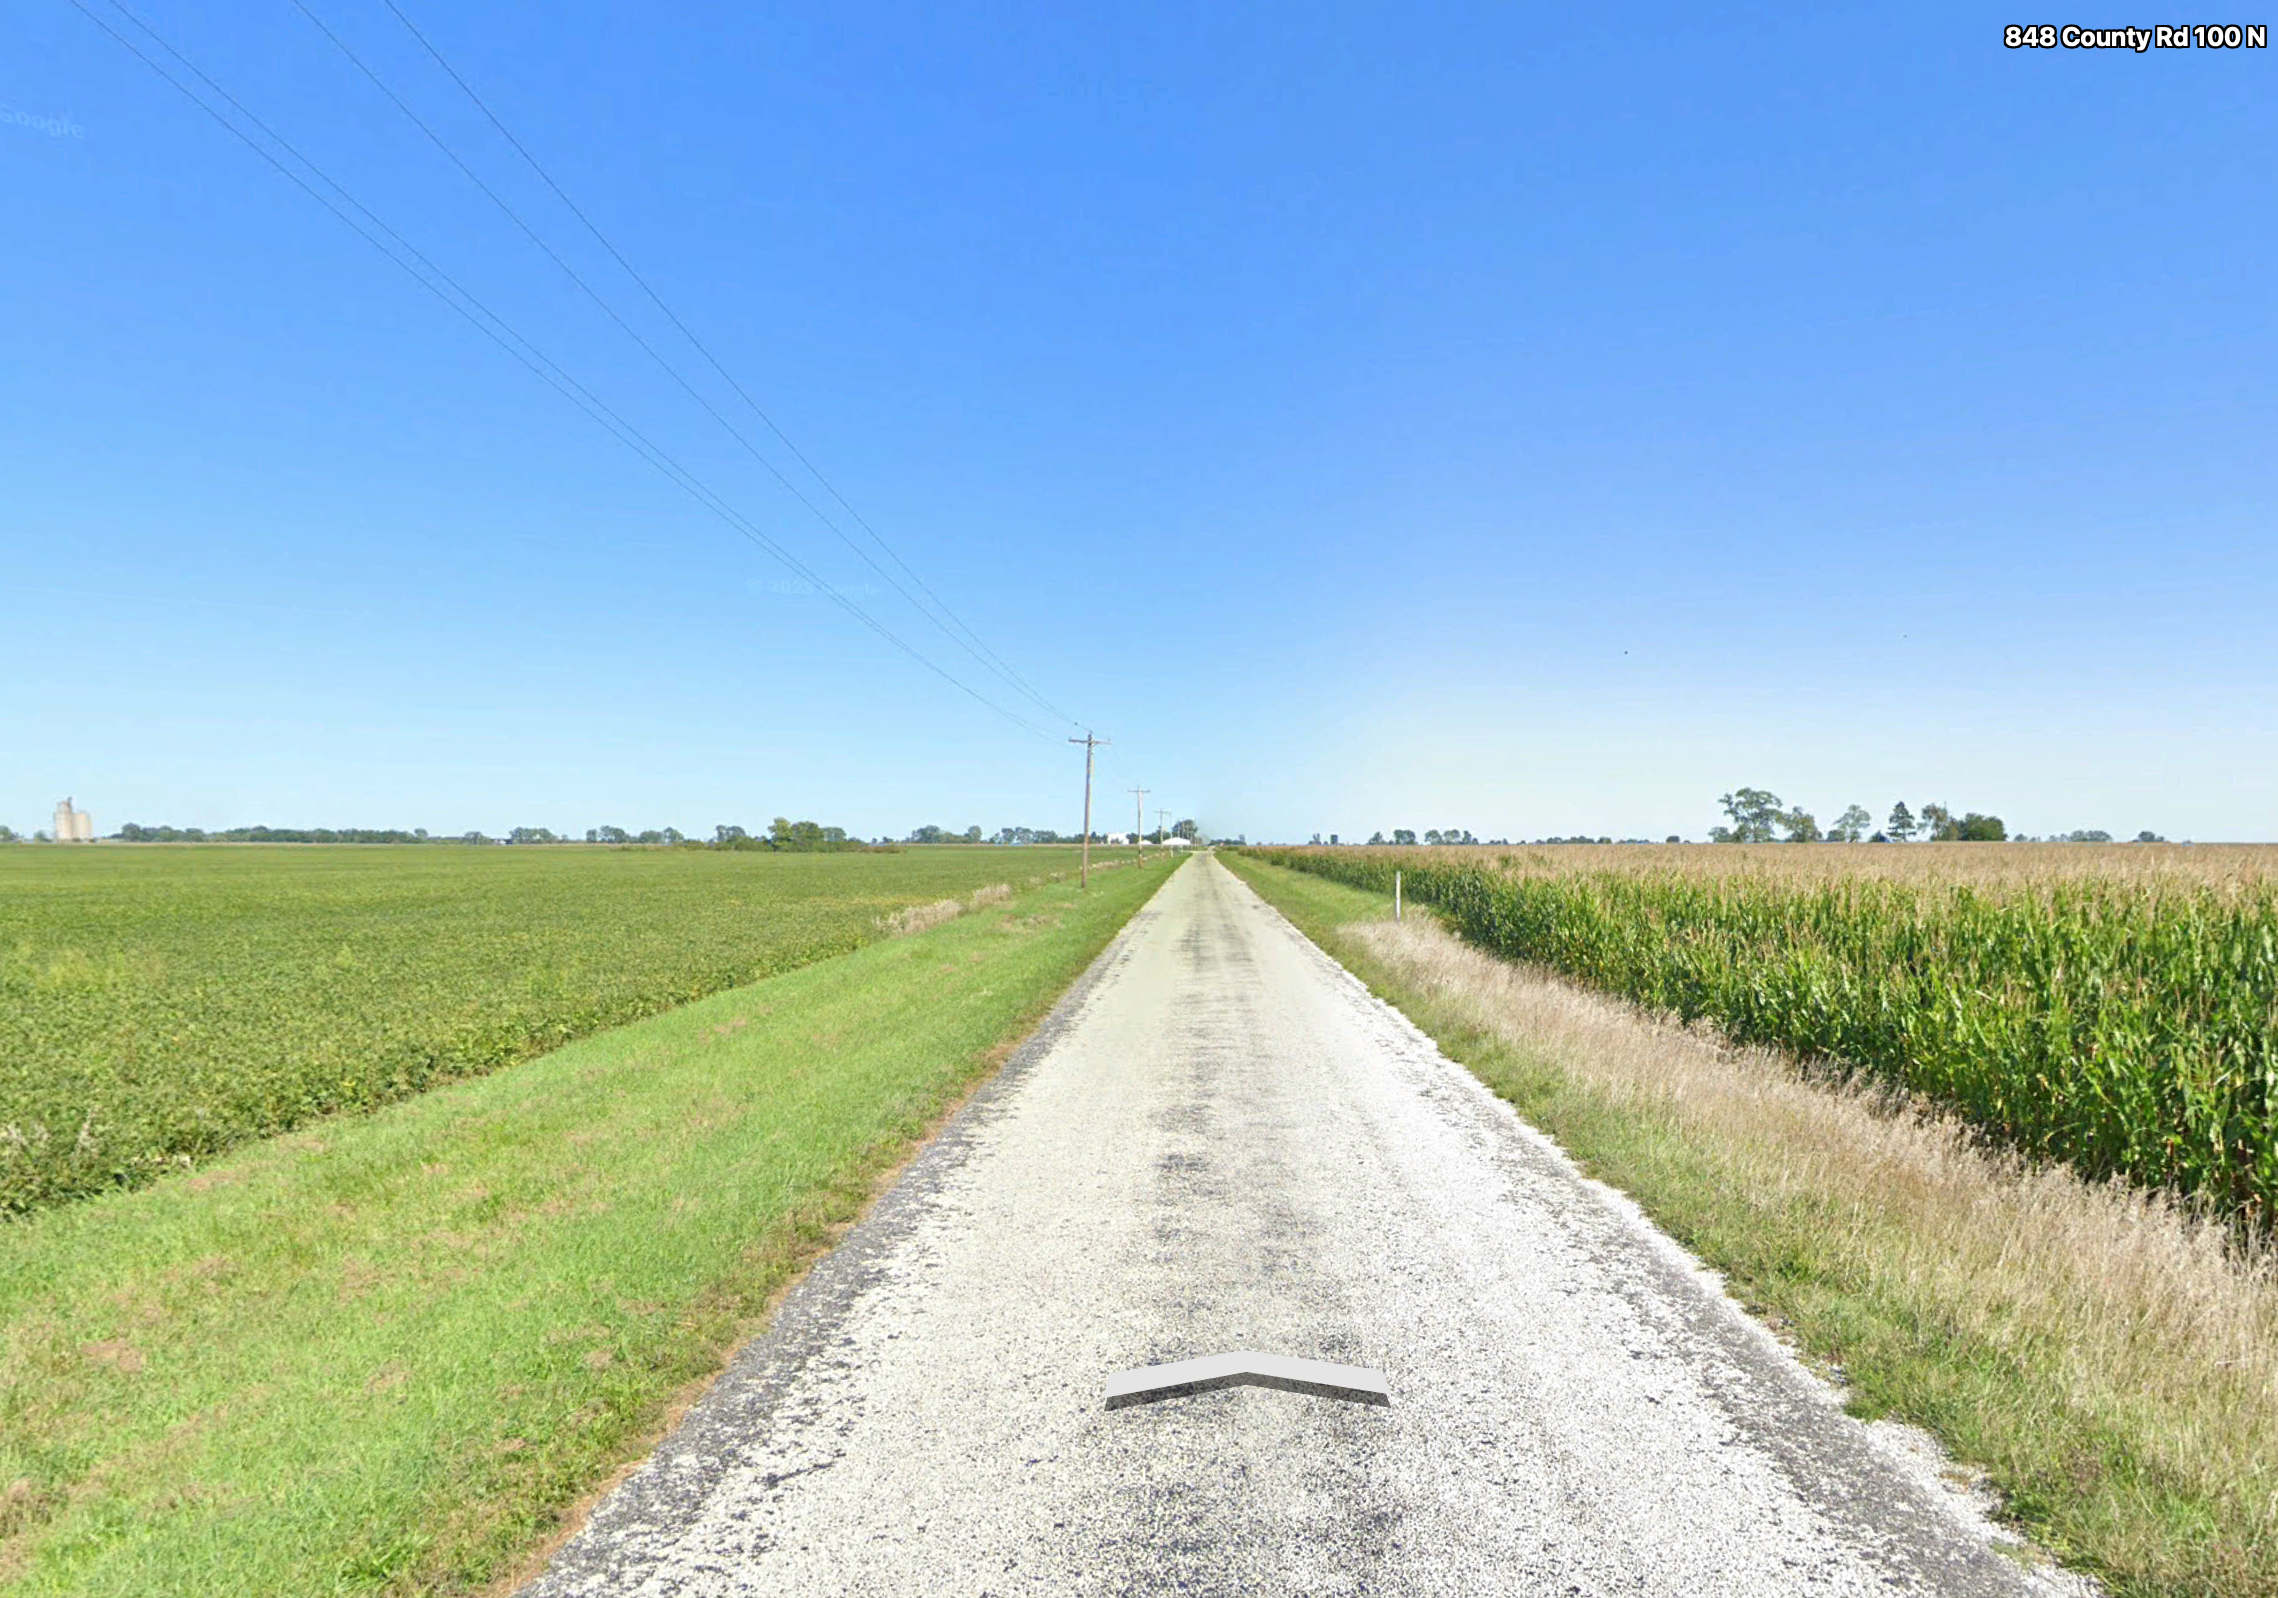
So what’s going on? Why does Boulder CO sport rugged peaks whereas Champaign IL is completely flat? Is the Fountain Formation more resistant to weathering? Is the older tectonic age of the “Champaign Uplift” responsible for its complete surface obliteration? Or something else?

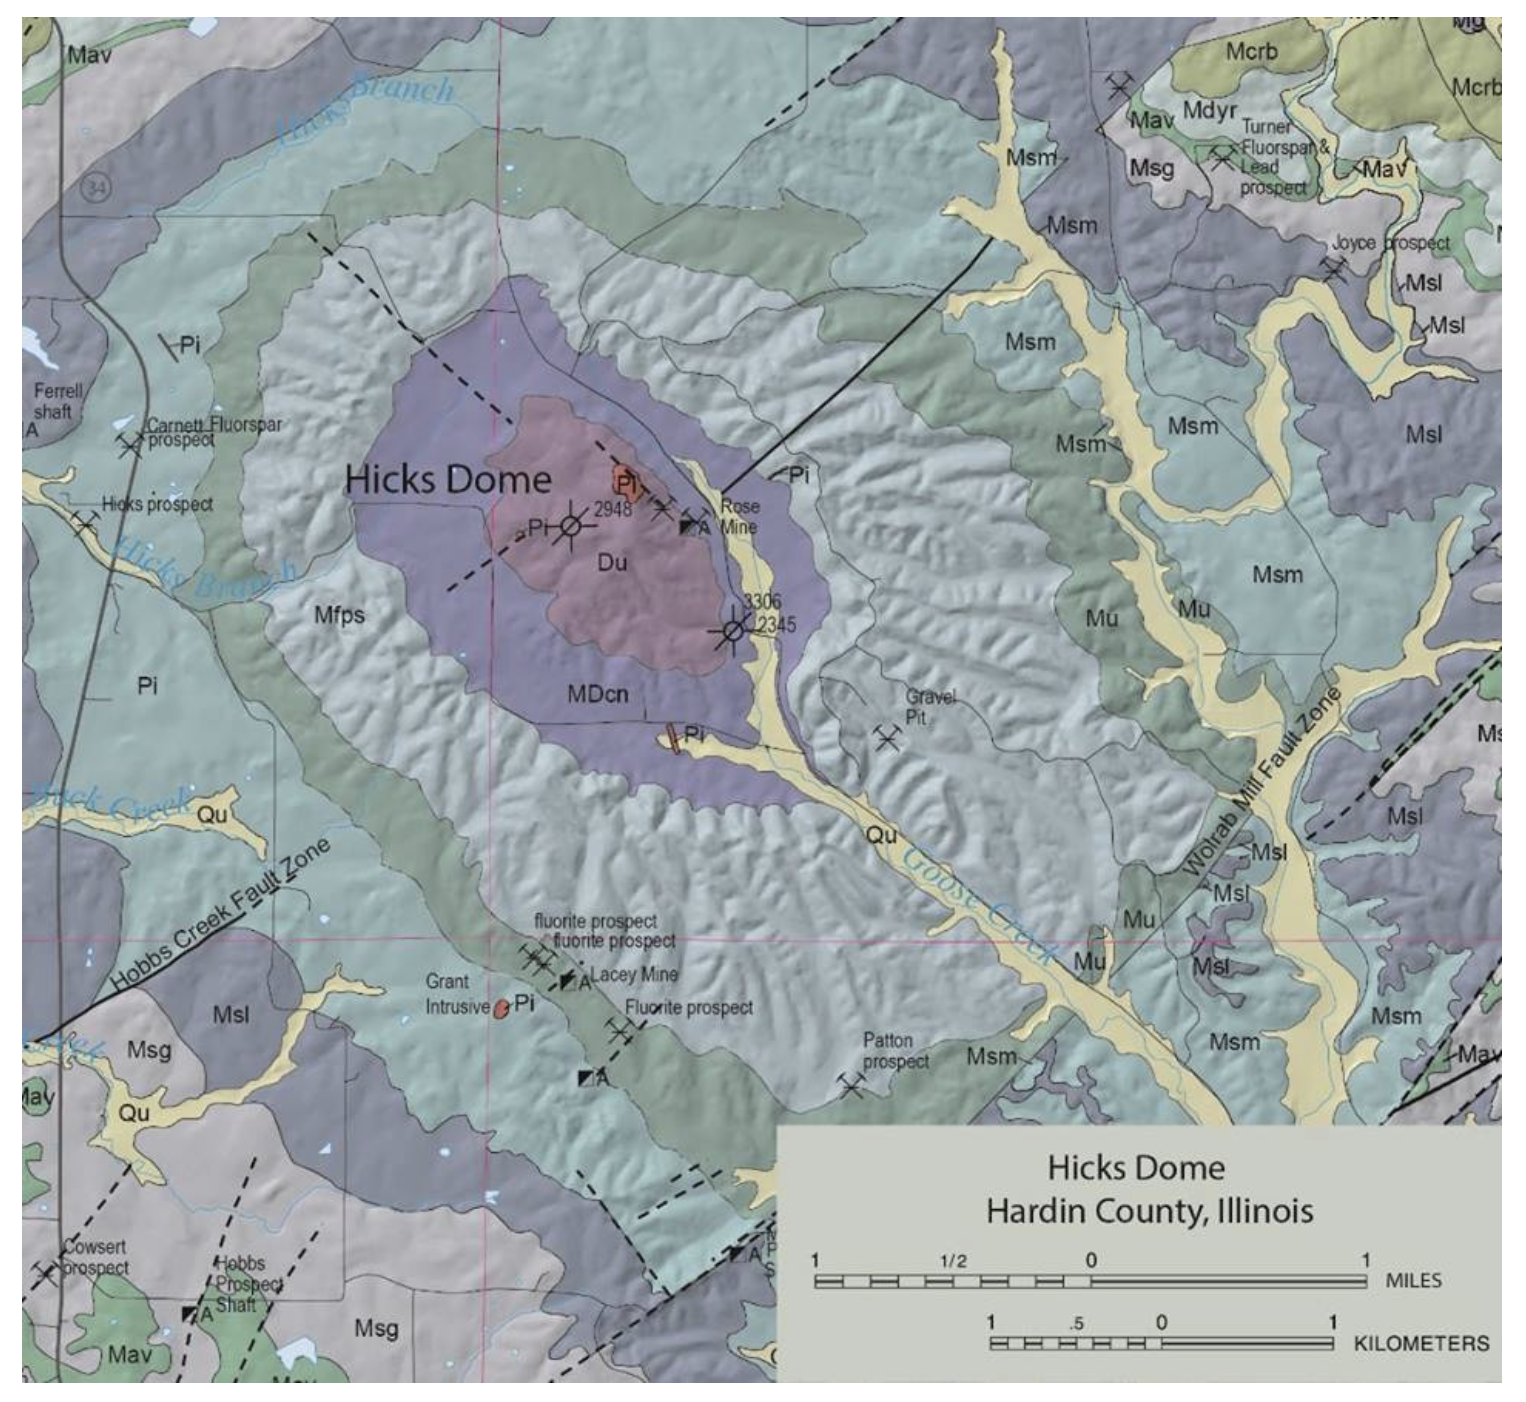
Granted, I don’t yet know enough about geology to be certain, but as far as I can tell, there’s no literature out there that specifically investigates the Champaign Uplift. I’m going to turn on comments for this post in the hope that someone might know something. Clearly, the uplift, or more properly, the anticline, is associated with the La Salle Anticlinorum, and is a small localized region where the local folding was very pronounced. Could it be of similar province to the mysterious Hicks Dome further south in Illinois?


A description of Hicks Dome reads very much like a description of the Champaign Uplift:

“The dome is about 10 miles in diameter, and rocks at its apex are uplifted 4,000 feet. Middle Devonian rocks at the center are surrounded concentrically by younger rocks out to Pennsylvanian on the rim.”

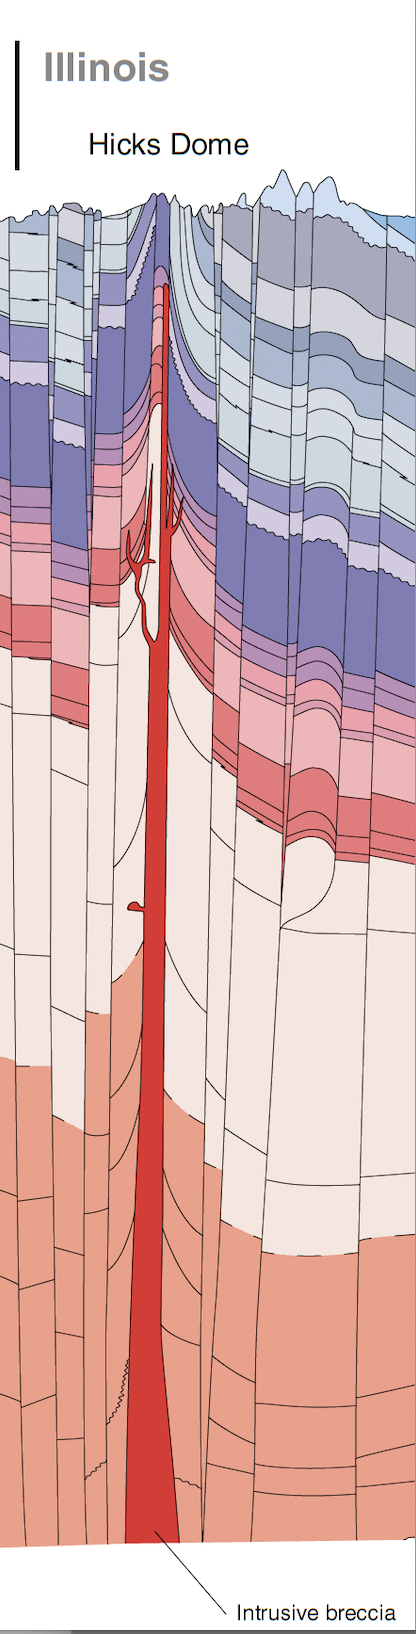
At Hicks Dome, the source of the uplift was an igneous intrusion that pushed its way up 260 million years ago:

“In 1952, St. Joseph Lead Company drilled a well on the apex of Hicks Dome in Hardin County, Illinois, primarily to explore for oil or gas, and with the objective of testing the St. Peter sand horizon, which had not been reached in a previous well on the flank of the dome. A normal sequence of formations was encountered down to 1,600 feet, but at about that depth the drill entered a confused brecciated zone, which persisted to the bottom of the hole at 2,944 feet. This is interpreted as one of the explosion type breccias, or diatremes, common in this Illinois-Kentucky area, as well as in nearby Missouri. A correlation of formations between this and the earlier Fricker well is presented. It is suggested that Hicks Dome is an incipient or uncompleted cryptovolcanic structure.”

The situation is illustrated nicely by the stratigraphic column:

To test this hypothesis we’d need to similarly drill into the Champaign Uplift. Clearly, some drilling already must have been done. Otherwise, there would seemingly be little reason to suspect that the Champaign Uplift is present beneath the till. Moreover, there would presumably need to be a fairly large number of wells in order to resolve the feature to the extent that it’s shown on the bedrock map. (Ed. — Perhaps seismic data can reveal such detail in the absence of drilling. You should really look into that.)

Anticlines are good at trapping oil. If one of the upper layers of the stratigraphic column is impermeable, then oil and gas will tend to migrate along the uplift gradient. A little bit of googling strikes an informational gusher in the form of the Illinois Oil and Gas Resources mapping application.

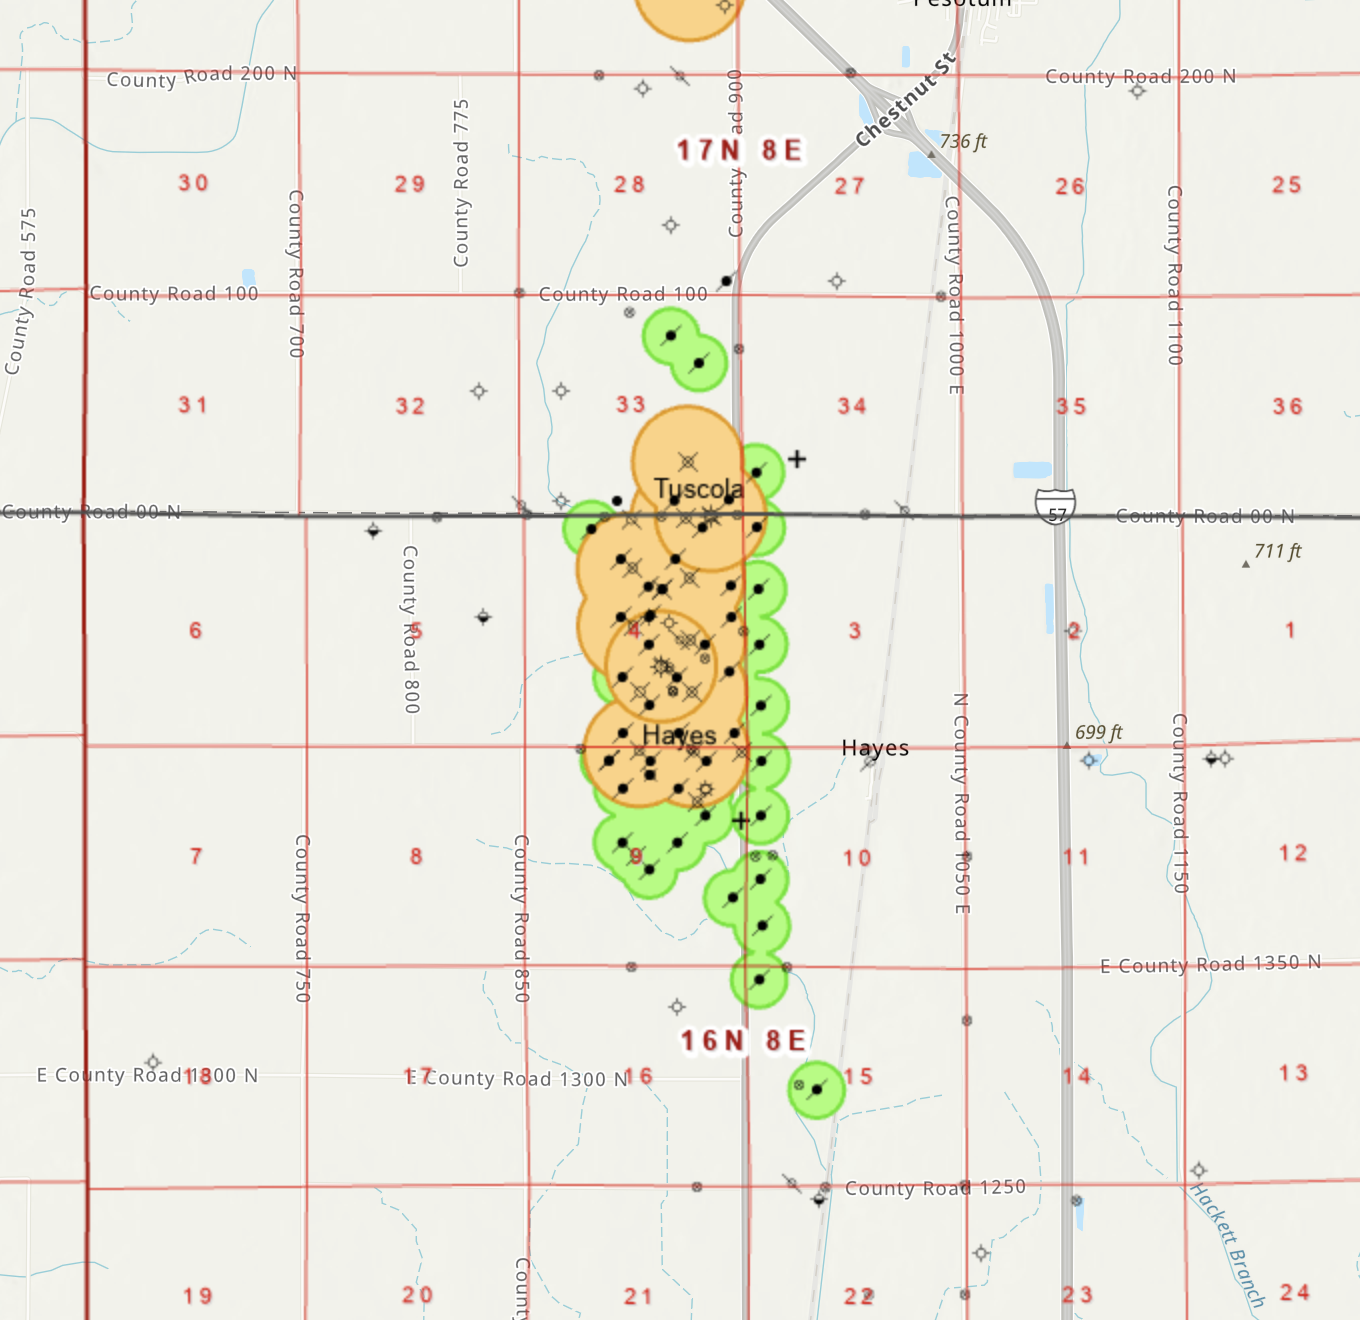
Look at that! The Champaign Uplift is shot through with oil wells. Each well location is clickable, and brings up a record at the Illinois Geological Survey. Clicking on a site close to County Road 100 yields:

Further clicking reveals the scanned well logs:

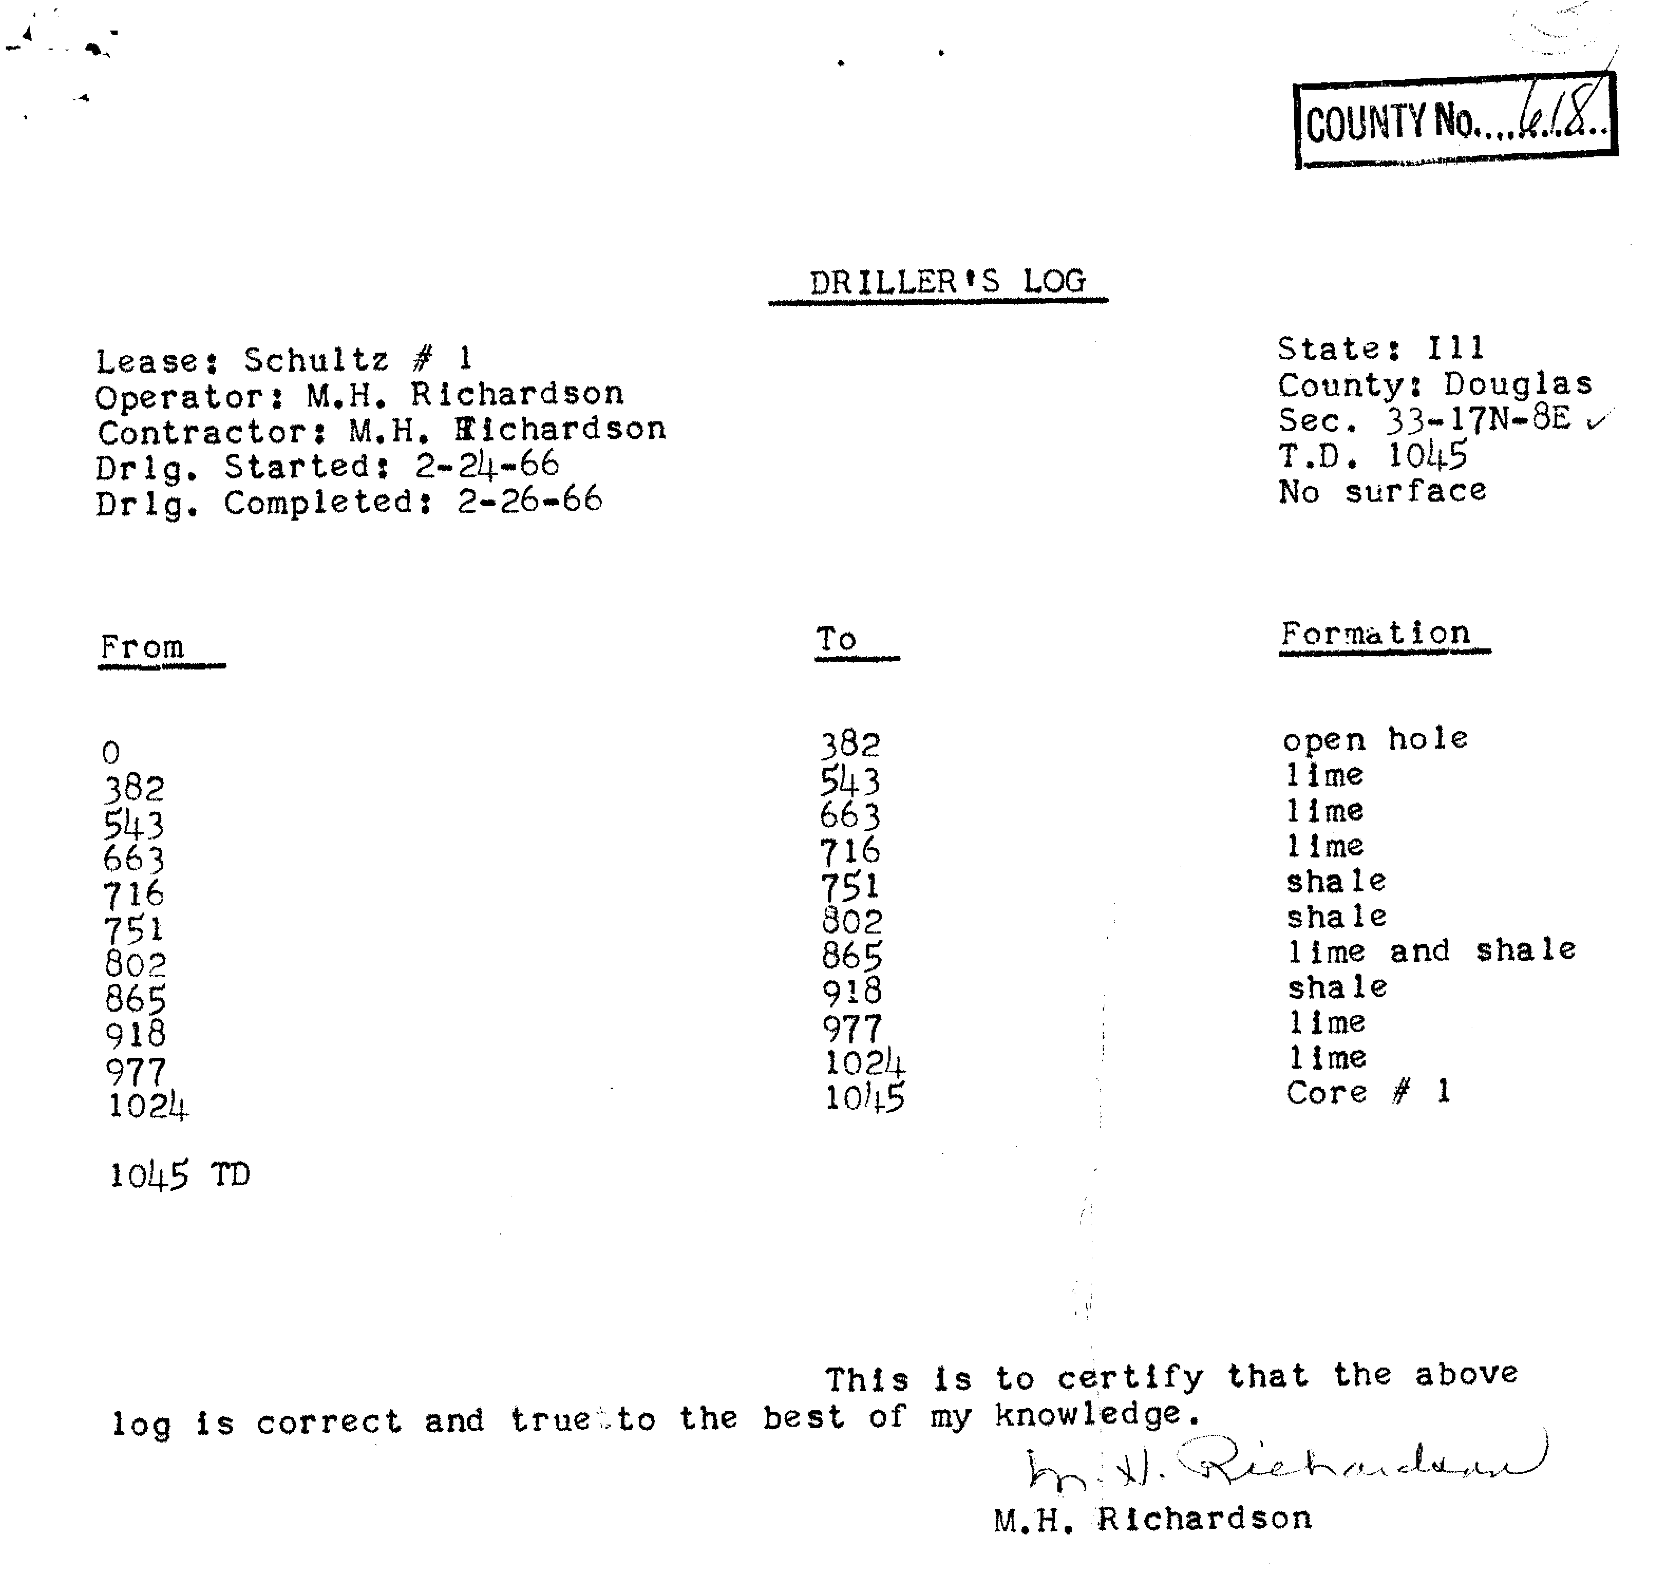
The wells were all drilled in the mid 1960s and they all go down about 1000 feet, at which point they tended to strike oil, typically generating about 50 barrels per day per well. There are about 50 such wells tapping the uplift, and assuming that they produced for a year, they generated about a million barrels of oil. USD 80M at current prices. Sweet.

Having hit the pay zone, however, it appears that there was no interest in drilling further. Had they gone down another few thousand feet might they have found an intrusion, an incipient Devil’s Tower? The flat landscape stretching away to the horizon gives no hint.

working for the clampdown

I was talking to a friend yesterday and the topic of grabby aliens came up. This, in turn, preempted the post I was working on. Grabby aliens render the question of when Venus lost its oceans (in the event that it had them in the first place) into the realm of the provincial and the mundane. I wrote an oklo.org post about grabby aliens a few years ago, and one can, of course, study the Astrophysical Journal paper in detail.

There’s something about the candy-crush colors of the flagship grabby aliens diagram that is appealing, but it is also remarkably effective in the way that the figure telegraphs the vast and epic sweep of the Cosmic Struggle for control:

Time proceeds downward. Grabby aliens stochastically emerge at various spots in the visible Universe, and as soon as they emerge they spread out in all directions, steamrolling everybody that they encounter; it’s the opposite of the and the meek shall inherit the Earth.

The diagram indicates that when one set of grabby aliens encounters another set of grabby aliens, they permanently maintain a tense standoff in the co-moving frame. The universe undergoes a phase transition from free-to-be-you-and-me to a cosmic web of Panmunjoms and 38th Parallels. I would have naively thought that the lines of demarcation would have more of a fractal structure as competing grabbers interpenetrate and contest ever smaller parcels of the interstellar gulfs.

Another remarkable conclusion that appears to flow from the diagram is that the Universe is bequeathed with some sort maximum aggressive potential. This quantity — perhaps a Carnot-like thermodynamic optimum of information processing and PdV work — must thus ultimately proceed from fundamental physics. The figure suggests that every space-like separated grabby set-up that emerges is immediately endowed with this perfectly efficient maximum contesting power. This brings to mind a thermodynamic system that is quenched from a homogeneous state into a broken symmetry phase, which, in turn, suggests the relevance of phase ordering kinetics in systems undergoing a phase transition. (For some light reading on the topic, see here).

Consulting Google this morning, I see that we’re currently scheduled for The Singularity in twenty-one years.

From what I can tell, the singularity would provide all of the necessary and sufficient conditions for a giant cluster of H100s running a souped-up pre-trained model to graduate into the Grabby Aliens club, especially if it’s of the “Vinge’s rapidly self-improving superhuman intelligence” variety. That motivated me to predict a super-short outlier time frame on the Metaculus Grabby Aliens question.

Looks like I have some significant deviation from the consensus (I predicted 19.4 yr in 2021). The Metaculus crowd tends to adhere to the Toby Ord philosophy, and that school of smart money is predicting that we’ve got a comfortable 171.5 billion years before we need to start vesting up.

erosion

If you are a senior scientist, and especially if you are an astrophysicist, it’s hard not to hold forth on topics that you know very little about. I’ve been chalking up (at best) only modest performance on this particular metric.

The traces of such investigations often focus on big-picture questions. Percival Lowell sought the signatures of Martian Civilization. Nathan Myhrvold gets all worked up about asteroid diameters. My own foray into the unknown (or rather, the unknown to-me) is currently centered feverishly on a topic that at first glance seems somewhat more pedestrian: erosion.

Here’s the motivation: the topographical angular power spectrum of Venus is very different from that of the Earth.

Recall that the angular power spectrum provides clues to the formation and origin of a particular structure. Take the Universe. The temperature variation of the microwave background shows undulations that peak at an angular scale of order a degree, which is visible both in the anisotropy map as well as in the power spectrum:

The clearly defined peaks in the spectrum of CMB temperature anisotropies stem from acoustic oscillations and diffusion damping in the early universe, and they encode all sorts of information about the fundamental cosmological parameters. The success of that analysis is so amazing that it spurs the possessor of inexpertise to seek possible replications in other areas.

While the topographical power spectrum for Venus is very muted in comparison to Earth, it does peak at the low-order l=3 and l=7 odd-l modes, and therefore exhibits a mild form of the antipodal anticorrelation that has characterized the plate tectonic motions on Earth over the past half billion years, and possibly for much longer.

This prompts the big-picture speculation that places me way outside my zone of expertise and into the Lowell zone. What if Venus once had continents and oceans. Then, what if, Venus underwent a runaway greenhouse, lost all its water and its plate tectonics shut down. Then, what if, the current topography is the result of gradual emplacement of lava from stagnant lid volcanism over the past N-hundred millions of years. How naive is this speculation? Is it possible to investigate it responsibly, or at least semi-responsibly?

Arthur Adams and I took a crack at this. It’s normally not the best idea to post one’s papers to arXiv in advance of peer-review, but I have enough arrogant confidence in the lost-oceans hypothesis that I pushed to take the indulgent plunge. We submitted our paper to the PSJ and posted it to the pre-print server.

Not surprisingly, we were summarily rejected from the PSJ, albeit with a review that, while negative didn’t quite close the door on the idea. Down, yes, way down, but not yet out!

In order to turn Earth into Venus, one needs to shut down tectonic uplift and then erode the topography almost completely. The idea is that if one loses one’s oceans to a runaway water-vapor greenhouse, that process — which ends when the last drop falls or the last puddle evaporates — is highly erosive. The weather is — by definition — terrible while you’re losing your oceans. How fast does erosion work on the largest scales under such conditions?

—-

I grew up in Urbana, Illinois, and I realized yesterday that a clue might be lying literally (and figuratively) in my backyard.

On the surface, Central Illinois is incredibly flat. From the highway overpass, the corn and bean fields stretch away for miles in all directions. This billiard ball quality is the result of recent glacial retreat, which left the landscape with a veneer of till that smothered the old ravines and hollows. If one scrapes this frosting off the cake, one gets the bedrock map of the state:

The picture at the top of this post was coincidentally taken from the back seat of a car when I was headed south of town on Interstate 57. Beneath the flat surface, at the southern border of Champaign county is a remarkable variation of bedrock that expresses itself over just a handful of miles:

What is going on there?

To hew to my self-imposed goal of posting once per week, I’ll stop there, and pick up next week. To my dozens of readers, stay tuned!

The cap table

Over a span of months, my late-model Honda Civic accumulated a strata of dust and grime. The situation reached the point where some wag had literally finger-traced “wash me” on the rear window.

I deposited numerous quarters into a machine and eased the manual-drive car into the maw of the automatic wash that is attached to the Chevron on the corner of Los Gatos Boulevard and Blossom Hill Road. Muffled conks and heaves outside the rolled-up windows indicated that the machine’s cycle was about to start. Inside the aging car, it was stuffy, dim, and claustrophobic. Reminiscent, perhaps, of the atmosphere within a sketchily-qualified deep-water submersible while one is still sitting on the deck.

My cell phone rang. A graduate student was on the line. His voice was shaky and panicky, “The server with the Keck vels is exposed to the open Internet!”

“Oh f*ck!” Dread. Horror. This was nightmare made tangible. “What?! How?”

“I don’t know… I, I just found it. One of the post-docs seems to have screwed up and changed the file permissions. Looks like it happened at 2:07 AM last night.”

My mind raced. “Did you lock them down?” That would be the first thing.

“Yes, yes,” he was saying, “I already did that.” I could hear the clatter of rapid typing. “Right now I’m going through the logs to see if they were accessed…”

A hiss of vapor accompanied the hard rat-tat-tat of a water jet against the side of the car. A shaggy red forest of rubbery suds-soaked strips began to lumber over the hood. Time seemed to stretch out like an elastic band.


By late 2007, internal tensions had led to the schism of the successful California-Carnegie Planet Hunting Team. Following the split, I was recruited to join the UCSC-Carnegie branch, and I was responsible for helping to coordinate the analysis of the Doppler velocity measurements.

Those Doppler points represented more than a decade of nights on telescopes. A large tranche of the early data was from Lick Observatory. I had even obtained a scattering of that data — the result of some runs I’d proudly soloed in the summer and autumn of 2001 on the antiquated Coudé Auxiliary of the Hamilton Spectrograph.

The real trove, however, consisted of velocities derived from the tens of thousands of spectra obtained with the HIRES instrument on the Keck I at the summit of Mauna Kea. The long-term several m/s stability and cadenced quality of those measurements had sparked a solid decade of successes. Gliese 876, Upsilon Andromedae, 55 Cancri. Nobel Prize talk was coming down the grapevine. NASA was valuing Keck nights at $100K a pop. Those were the glory days.

When the California-Carnegie team fractured, there was an urgent question of who was going to get to publish which planets from which stars. Fraught back-and-forth negotiations led to a tense stellar draft, in which the two newly-competing teams successively divvied up the juiciest prospects. We lost the initial toss. The Berkeley Team grabbed HD 7924. It was also the first star on our list. I crossed it off with dejected sigh.

The preparation for the stellar draft had got me thinking about the monetary value of planets, and how to properly apportion that value among the stars. At the going NASA Keck rate, the radial velocity data had a street value of approximately $35M. And now, sitting terrified, trapped in the car wash, I had a vision of a Brinks truck left unlocked and unguarded at 2:07 in the morning, crisp stacks of c-notes piled inside for the taking.


Quote-unquote habitable planets can also be assigned value. Rather than using the cost of Keck nights as the metric, one can use the goal yield of Earth-like worlds and the total cost of the Kepler Mission to establish what society is (or rather was) willing to pay for them. Prior to Kepler’s launch, I proposed the formula:

Where the log is understood to be base-10, now == then == 2009, and V is the parent star’s Johnson V-band magnitude. The expectation was that the Kepler mission would return a cool 700M or so worth of habitable planets.

Fifteen years on, it’s interesting to look at how things turned out. Literally thousands of planets have been brought to market. The radical statements from the Geneva Team regarding the absolute profusion of uninhabitable super-Earths with orbital periods ranging from days to weeks have been amply confirmed by the satellite-based photometry.

Yet, despite the impressions one might garner from the various habitable zone galleries, the crop of actual truly-Earth-like prospects, as defined by the valuation formula, is remarkably slim. The discovery efforts vastly under-exceeded expectations in this particular regard. Adopting the fiducial values from the NASA Exoplanet Archive, there are zero million-dollar worlds or even any exoplanets that would require a jumbo mortgage to service. The table just below uses 2010 as the fiducial year.

As expected, Proxima b tops the list by a wide margin. It is interesting, however to see Ross 128b at number 2. This red dwarf host is only 11 light years from Earth, and the relatively subdued fanfare it received is ex-post justification for the stringent time-decay term in the valuation formula. I’ll point out, however, that the artist-impression of Ross 128b is perhaps the best I’ve seen, especially when compared to the janky blue marble efforts that tended to accompany the we-found-a-habitable-planet press releases.

The 2017 ESO press image for the Ross 128b story. Kudos to M. Kornmesser (who was also responsible for the jagged starship rendition of `Oumuamua) for putting that one together.

After what seemed like an eternity, the forest of rubber washers trailed off the back of the car. A fine spray heralded the start of the rinse cycle.

“Ahh, OK, OK,” the graduate student said at last, relief permeating his voice, “I’ve gone through the logs. No activity during the span. Nothing. Zero.The vels didn’t leak.”

“You’re sure?”

“Yeah, totally.”

Wash completed, the blue-sky Californial light sparkled off the beads of water still clinging to the car.