Image Credit: ESO.
I had the good fortune of being asked to sit in as an external commentator for the ESO’s media briefing on the Geneva Team’s discovery of Alpha Centauri B b. It was startling to see the amount of interest on the line. All of the familiar names from the science journalism community were logged in, and there was a very substantial representation from the mainstream media. The ESO officials remarked that it was the largest audience that they’d ever seen for a press briefing. It was very clear that Alpha Centauri and Earth-mass planet combine for a headline draw. The story was supposed to be held until 17 Oct. 19:00 CET, but the embargo was broken in rather disorderly fashion, and, according to ESO, b, by the end of the afternoon was officially out of the bag.
Paul Gilster, who leads the Centauri Dreams site asked me for a brief perspective for a piece that he’ll be writing tomorrow (Lee Billings has a very nice article on Centauri Dreams today). I was eager to oblige — Paul has played a clear, consistent role in getting the community’s attention focused squarely on or charismatic next-door neighbor. I wrote back:
I really like the particular way that the narrative is unfolding. The presence of the 3.2-day planet, taken in conjunction with the myriad Kepler candidates and the other results from the HARPS survey, quite clearly points to the possibility, and I would even say the likelihood, of finding additional planets at substantially more clement distances from the star. Alpha Cen A and B, however, are drawing closer together over the next several years, severely metering the rate at which high-precision measurements can be obtained. This builds suspense! It reminds me a bit of a mission like New Horizons, where the long coast to the destination serves to build a groundswell of excitement and momentum for the dramatic close encounter. I think that this is important for a society that is increasingly expectant of immediate interactivity and instant gratification… I hope that this detection of Alpha Cen Bb provides an impetus for the funding of additional radial velocity infrastructure, and also for space-based missions such as TESS, which can find and study the very best planets orbiting the very nearest stars.
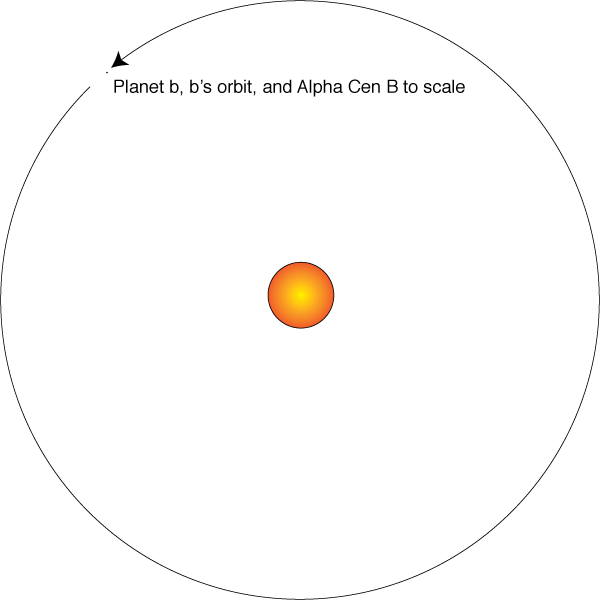
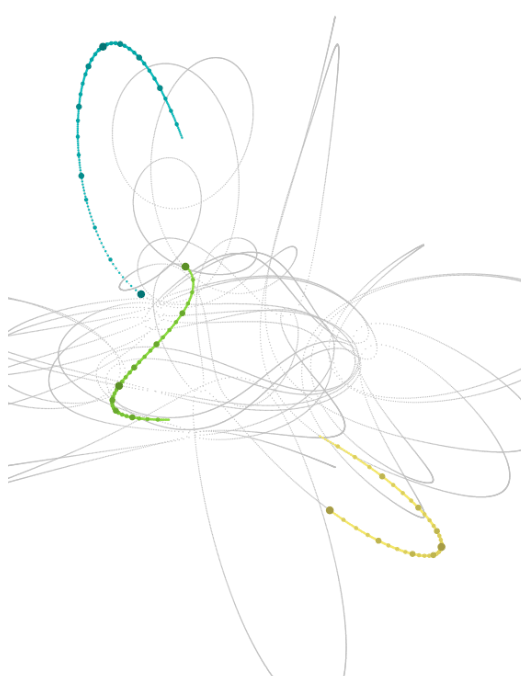
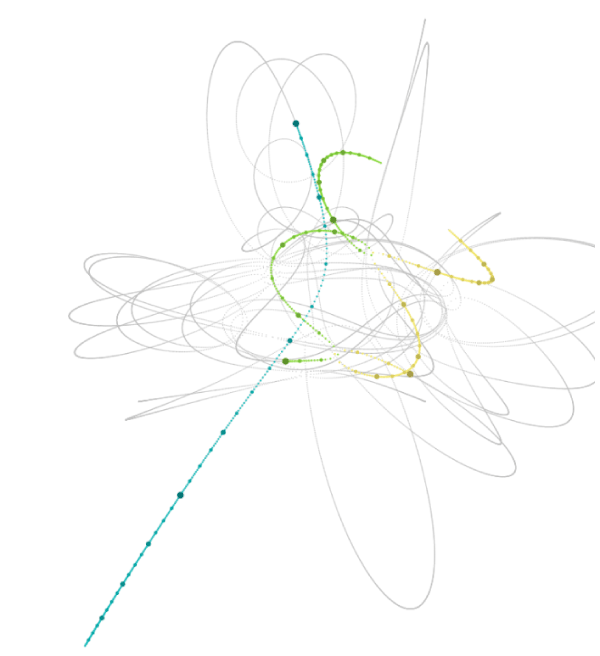
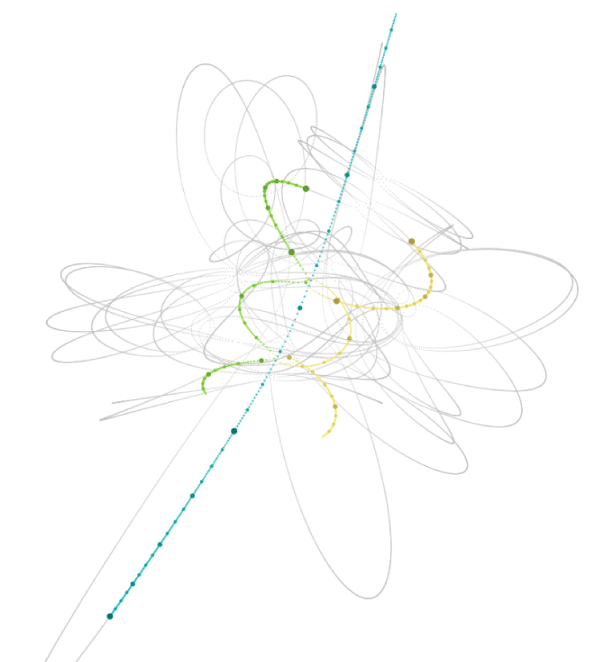
With K=0.51 m/s, Alpha Cen B b has a RV half-amplitude that is over a third lower than the previous record-holder, HD10180b. The relative insignificance of an Earth-mass world in comparison to the great bulk of Alpha Cen B is immediately evident with a scale diagram of the star, the orbit and the planet. The planet resolves to ~6/10th of a pixel in this figure, barely visible as a faint gray speck.
As far as the faint gray speck itself goes, the ESO-produced artist’s impression (shown as the splash image for this post, and over the past few hours, splashed all over the Internet) is quite good for this genre. Granted, the apparent surface brightness of the Milky Way in the background is about 1,000,000,000 times too high, but the planetary crescent and the lighting geometry make the grade. And thankfully: No lava.
Alpha Cen B has a radius about 90% as large as the Sun. This means that transits, if they occur, would have a maximum photometric depth of ~0.01%, and would last up to three hours. These numbers make for a challenging, but by no means impossible, detection. HST (perhaps using the FGS instrument) should be able to reach a transit of this depth, and given that the phase, the depth, and the period are known in advance, I think that a purpose-engineered ground-based solution can be made to work as well. For example, see this post on orthogonal transfer arrays — Alpha Cen B delivers almost 5 megawatts to the Earth, and Alpha Cen A is a nice comparison star right next door.
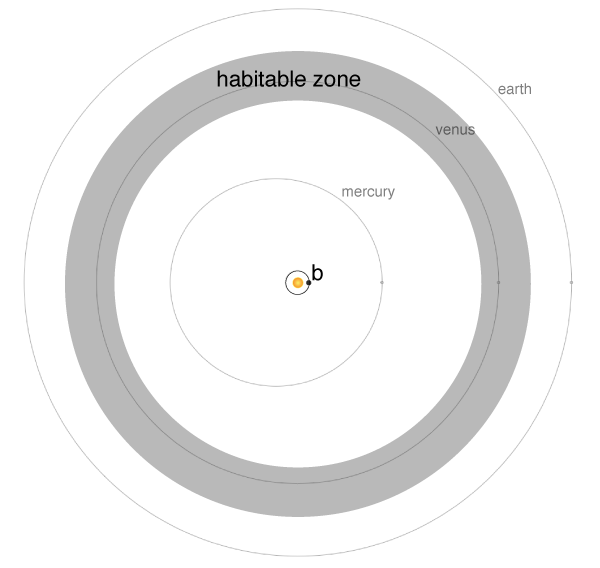
During the press briefing, the “habitable zone” came up repeatedly. Put succinctly, Venus at B would be on the A-list.
The Nature News and Views commentary by Artie Hatzes draws on the extraordinary claims argument to imbue the detection with a question mark. “The researchers used 23 parameters related to the star’s rotation period to model the variation in stellar activity, and then filtered it out from the data, unveiling the planet’s signal.” Given the skepticism, it’s interesting to look in more detail at how the signal was dug out.
In the past, I’ve used this blog as a platform for urging that Alpha Cen receive the maximum possible allotment of Doppler-based attention. From August 2009:
Now nobody likes backseat drivers. As the saying goes, “theorists know the way, but they can’t drive”, and theorists have had a particularly dismal record in predicting nearly everything exoplanetary.
But nevertheless, I’m urging a factor-of-four increase to that data rate on Alpha Cen B. I would advocate two fully p-mode averaged velocities per night, 50 nights per year. I know that because Alpha Cen B is so bright, the duty cycle isn’t great. I know that there are a whole panoply of other interesting systems calling for time. It is indeed a gamble, but from the big-picture point of view, there’s a hugely nonlinear payoff in finding a potentially habitable planet around Alpha Centauri in comparison to any other star.
The current HARPS data set has an impressive 459 individual p-mode averaged velocities, with uncertainties in the range of 1 m/s. In a naive universe governed by featurelessly luminous stars and normal distributions, such a data set would allow planetary orbits with K<0.1 m/s to be probed. It was just such a universe that informed some of my earlier simulated data sets that modeled what one might expect from Alpha Centauri. For instance, here’s a plot from June 2009 that shows what I thought the HARPS data set of that time might have looked like.
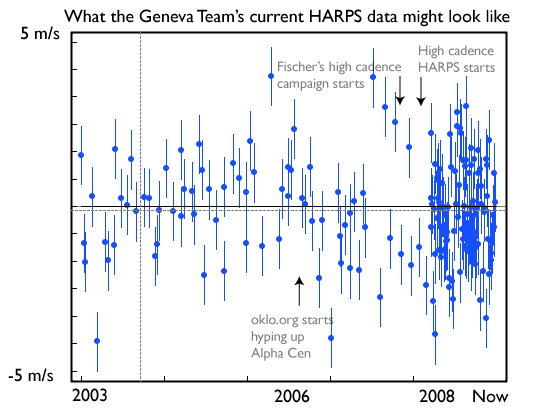
With 459 points along such lines, Alpha Cen’s whole retinue of terrestrial planets would now be visible. Indeed, with just the synthetic data in the above figure, a simulated super-Earth in the habitable zone sticks out like a sore thumb.
With hindsight, it’s not surprising that the real data set is more complicated. Although Alpha Cen B is a very quiet star, it does have a magnetic cycle, and it does have starspots, which rotate at the ~37-day spin period of the star, and which come and go on a timescale of months.
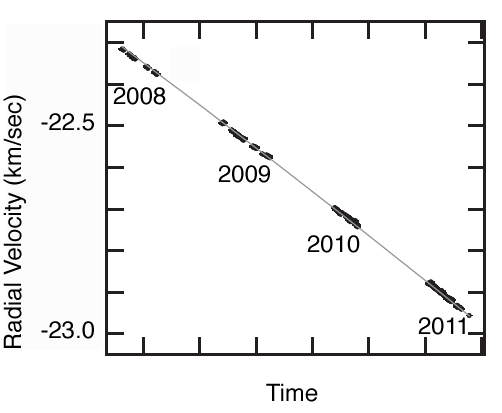
The raw radial velocities are completely dominated by the binary orbit. The following figure is from the SI document associated with the Dumusque et al.’s Nature article.
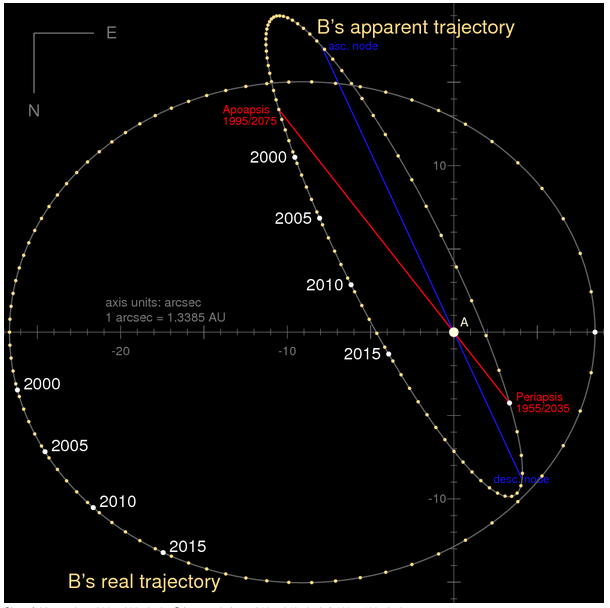
Alpha Centauri B has a velocity component in our direction of more the 50,000 miles per hour, more than twice the speed attained by the Saturn V’s just after their trans-lunar injection burns. The AB binary orbit has a period of ~80 years, and is currently drawing toward a close approach on the planet of the sky. (Figure below is from Wikipedia.) The next periastron will be in 2035.
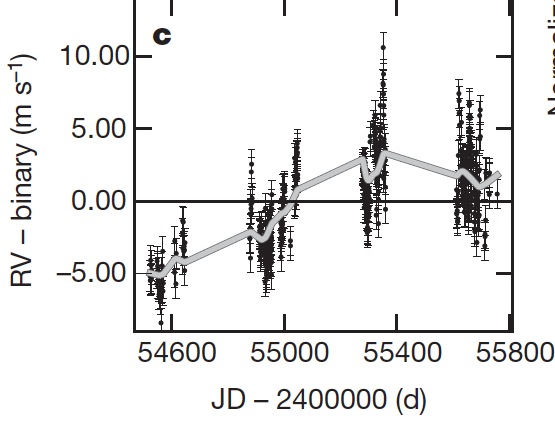
Strictly speaking, one needs five parameters (P, K, e, omega, and MA) to model a binary star’s effect on a radial velocity curve. However, because the HARPS data covers only 5% of a full orbit, it’s sufficient to model the binary’s contribution to the Doppler data with a 3-parameter parabola. When the binary is removed, the data look like this:
There’s a clear long-term multi-year excursion in the velocities (traced by the thick gray line), and there are almost 10 meters per second of variation within each observing season. That’s not what one would have ideally hoped to see, but it is an all too familiar situation for many stars that have years of accumulated radial velocity data. Browsing through the Keck database shows numerous stars with a vaguely similar pattern, for example, this one:
Many long-term trends of this sort are the product of stellar activity cycles that are analogues of the 11-year sunspot cycle on our own Sun. In the absence of sunspots, the surface of a sun-like star is uniformly covered by granulation — the pattern of upwelling convective cells.
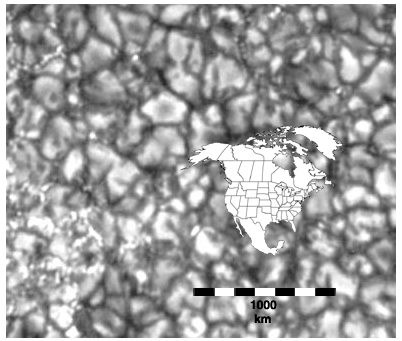
Image Source.
Most of the surface area of the granules is composed of plasma moving up and away from the Sun’s center. The gas gushes upward, disgorges energy at the photosphere, and then spills back into the darker regions that delineate the granule boundaries. On the whole, the majority of the stellar surface is blueshifted by this effect. In the vicinity of sunspots, however, the granulation is strongly suppressed, and so when there are a lot of sunspots on the surface of the star, the net blueshift is reduced.
Sunspot activity is very tightly correlated with the strength of emission in the cores of the Calcium II H and K lines (for an accessible overview, see here). As a consequence, a time series of this so-called H&K emission is a startlingly good proxy for the degree to which the granulation blueshift is suppressed by sunspots. Figure 2 of the Dumusque paper charts the H&K emission. Its variation is seen to do an excellent job of tracking the erratic long-term Doppler RV signal displayed by the star (compare with the plot above). Hence, with a single multiplicative scale parameter, the variations measured by the H&K time series can be pulled out of the Doppler time series.
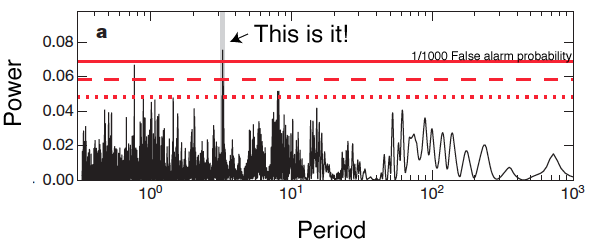
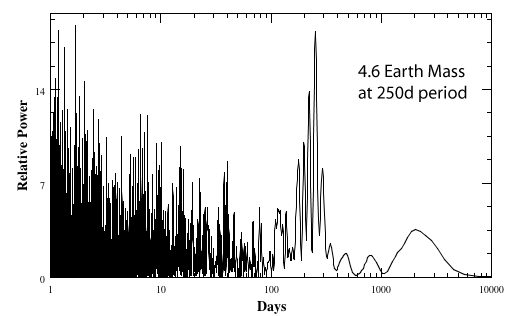
Can’t stop there, however. Starspots, which come and go, and which rotate with the surface of the star at the ~37-day stellar spin period, generate an additional signal, or rather sequence of periodic signals and overtones. Dumusque et al. handle the rotation-induced signals in conceptually the same way that one would handle a set of planets with variable masses, periods of several months: measure the strength of the periodogram peaks, and remove the signals year by year. This involves 19 free parameters, the moral equivalent of successively removing four planets to get down to the final brass (or more precisely iron) tack:

