Long-time readers will recall how oklo.org evinced a certain preoccupation with HD 80606b during 2006 through 2009.
In the interim, this blog has largely random-walked to other topics (largely dissipating its readership in the process) but HD 80606b has stayed the course, ratcheting 52 more hair-raising circuits around its parent star, each of which brings it to within seven stellar radii, increases the instellation flux by a factor of a thousand, and then sees the planet flung out to linger for months near a 0.9 AU apoastron where cooling might well proceed all the way to the point where the torrential nightside rains begin to fall.
A ‘606 day occurs every 111.4 terrestrial days, and marks the UTC occurrence of a periastron passage. The current ‘606 day occurred in the HD 80606 system itself sometime between February and May of 1810 AD, and here in the Solar System is currently occurring right now, with the moment of periastron pinpointed to 04-11-2025 06:33:17 UTC, give or take a few minutes.
I was reading, just now, an article about Young Thug’s recent scrape with the justice system, and at the end of the article, it was noted that he’s developed something of anidée fixe with the variable red supergiant star UY Scuti. Yes, you read that right.
Coincidentally, as realized volatility in the E-mini SP500 near-month index futures contract approached annualized levels of order 150 or even 300 this morning, I was finding myself thinking about the contrast between the essentially out-of-control red giants and consummately restrained red dwarf stars. Both classes of objects exist in the same effective temperature range, but the red dwarfs will manage to last for trillions of years before eventually turning themselves into degenerate helium cinders.
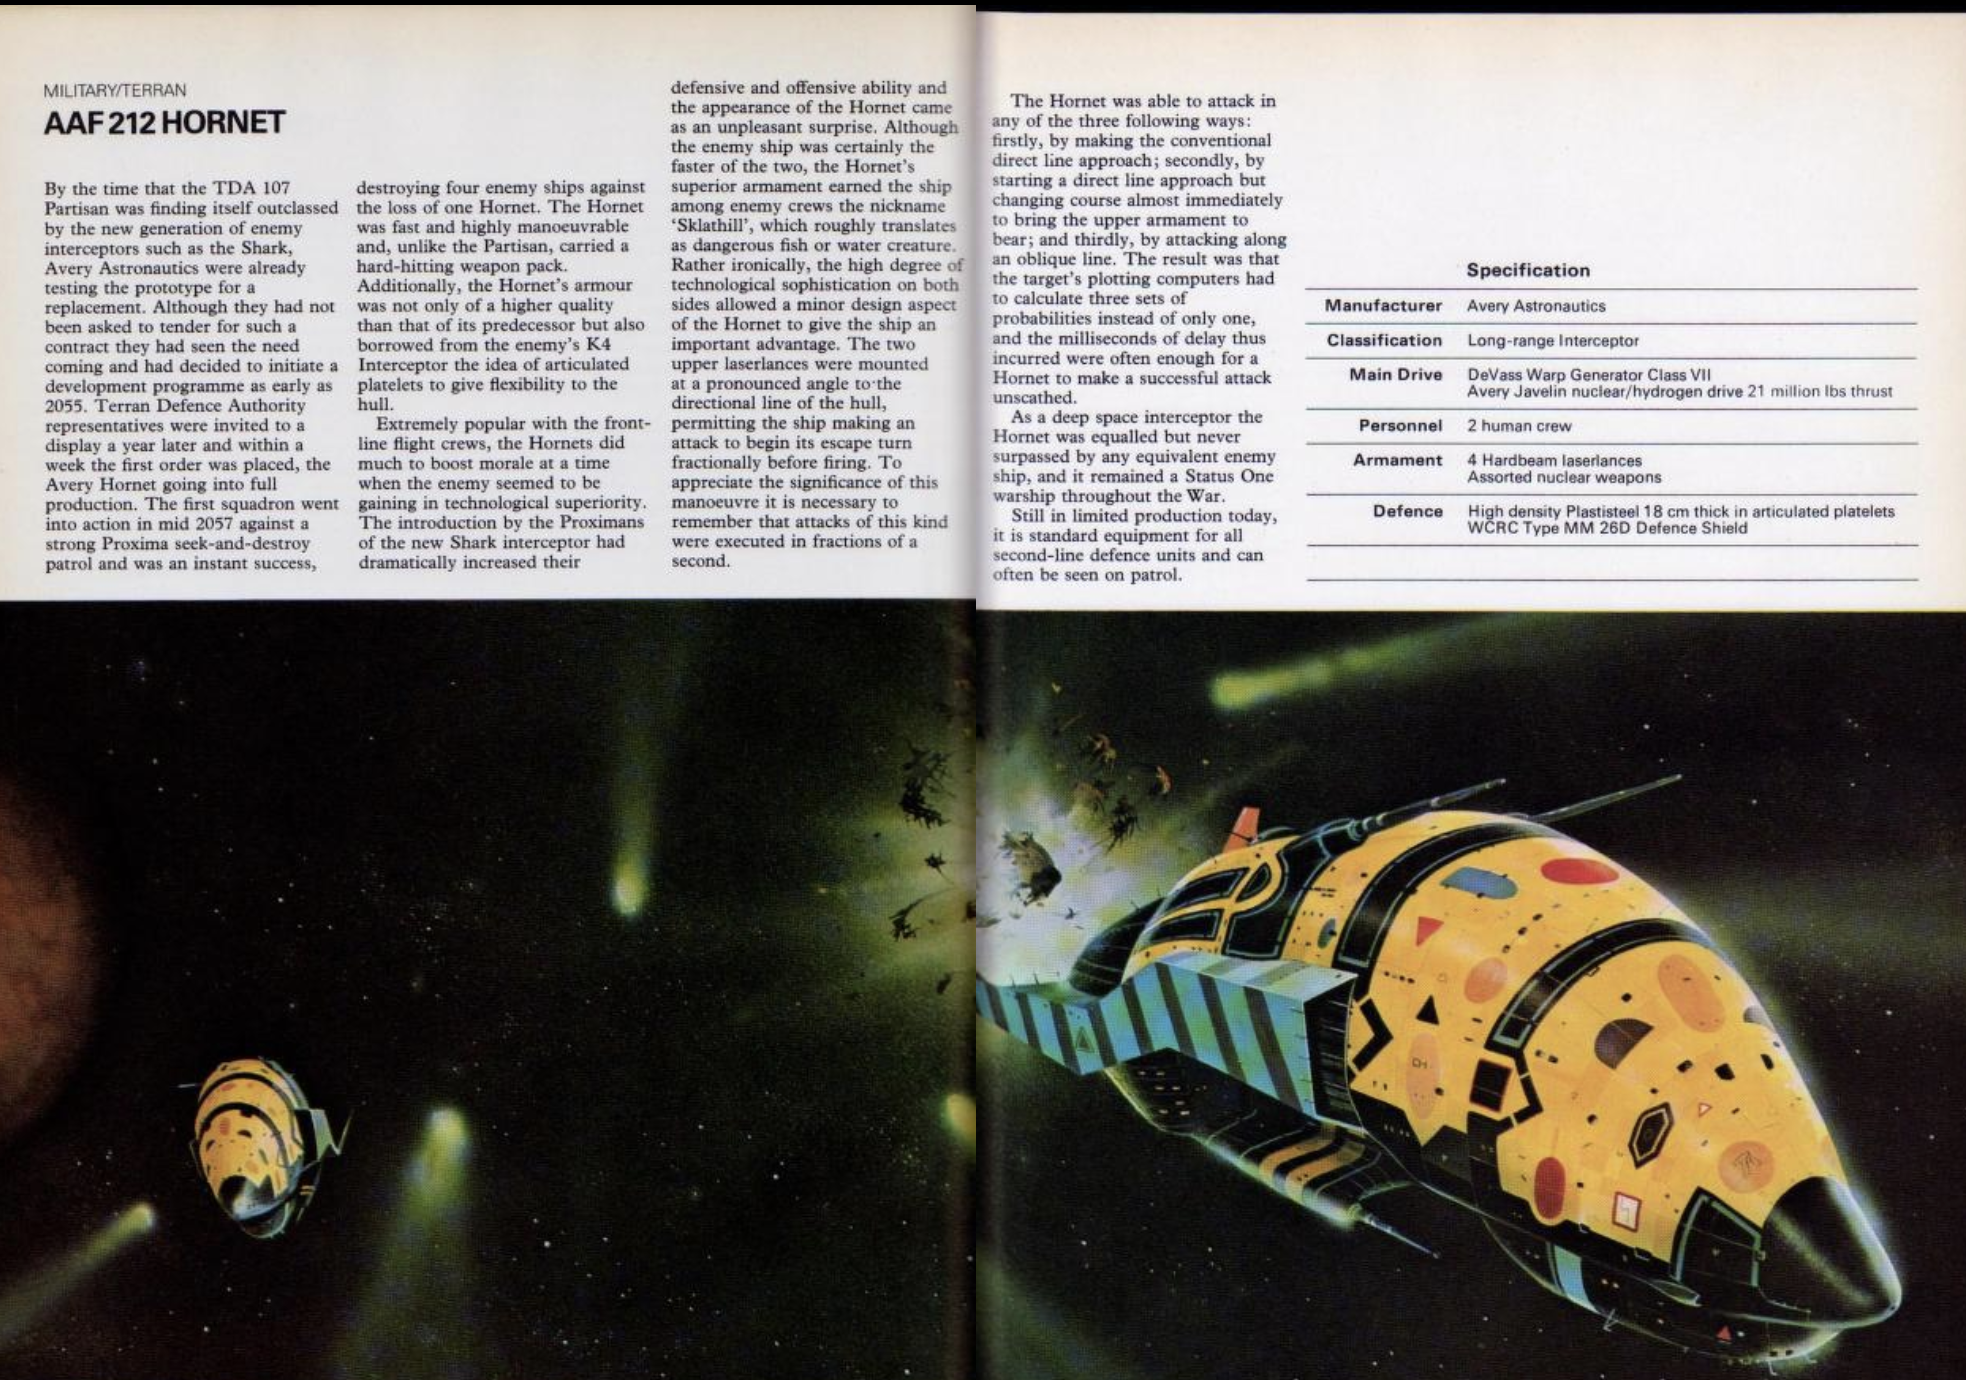
In 1979, aged 11, I received a copy of Stewart Cowley’s Spacecraft 2000 – 2100AD as a Christmas gift. Suffice it to say that book blew me away.
Extravagantly produced and coffee-table sized, it combined detailed “realistic” scenes of science-fiction starships with text that matched each lurid illustration to dry technical specifications and a gripping overarching narrative involving an interstellar space war that pitted Alpha Centauri and the Solar System against Proxima Centauri! It was a vision of the future in which the Fermi Paradox had proved to be merely a naive non-sequitur.
There was something about the precise detail and the aggressively near-future sweep that stood in stark contrast to Star Wars and Star Trek. I could tangibly place my future self into the book’s discrete-yet-analog time line. And now, from the standpoint of 2025, nearly a half-century on, rather than facing the imminently scary prospect humanity-replacing AGI, we’d instead be on the cusp of Henri deVass’ breakthrough perfection of the Warp Generator, the development that finally permitted Mankind to slip the surly bonds of the Solar System:
Possession of the physical volume to pore over at leisure was invaluable at a time when the starships of the movie theaters’ big screens were both fleeting and overwhelming. I spend vast stretches of time trying to come up with my own illustrations in the style of the book. I wrote treatments and incomplete drafts of whole new volumes that introduced the planets and civilizations orbiting Tau Ceti and Eta Cassiopeiae into the fray. The results always fell short, but somehow the time spent in failed effort was deeply satisfying.
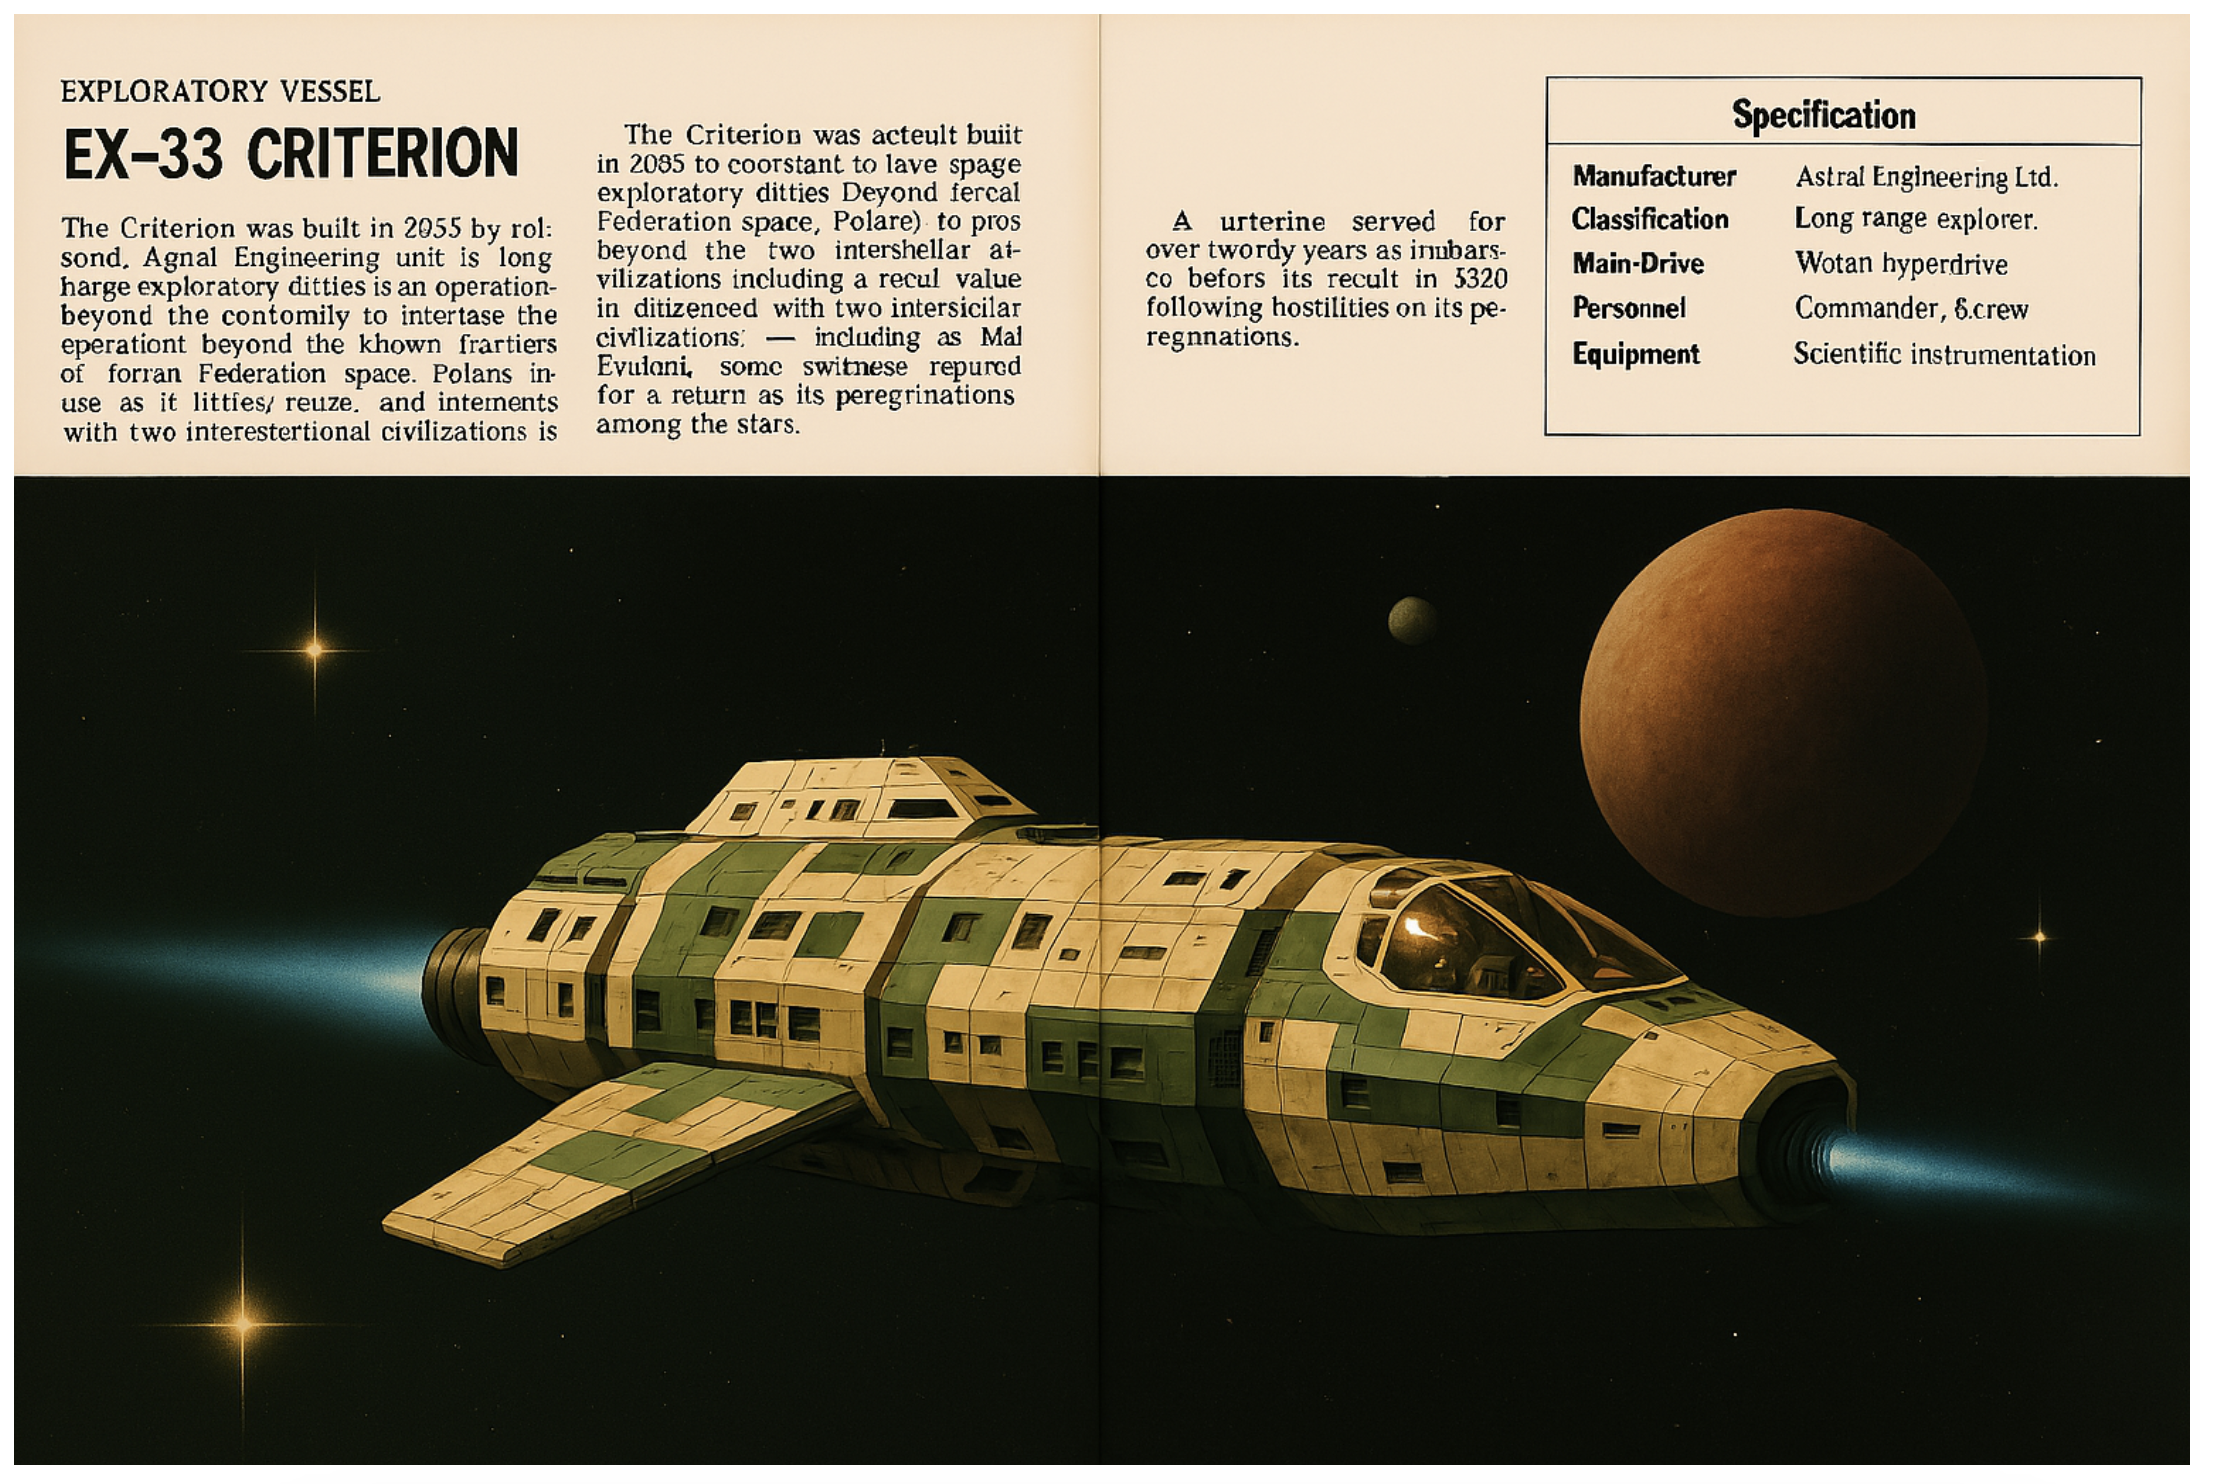
I heard yesterday that OpenAI’s image generator has made a sudden leap forward, and I wondered how the model would perform on that task I’d spent so much time on decades ago…
SURVEY VESSEL EX-33 Criterion Commissioned by the United Nations Deep Survey Initiative in 2091, the EX-33 Criterion was purpose-built for the long-term observation of Class-D planetary systems. The ship’s unique hull geometry—a flattened, asymmetrical crescent with deeply recessed engine pods—allowed it to remain stable while hovering at the fringe of a gas giant’s magnetosphere for months at a time, shielded from both gravitational shear and plasma wash.
The vessel is shown here conducting a station-keeping operation above Erechtheus, a failed proto-planet in the Epsilon Indi system. Note the minimal thermal signature and open cooling vanes: Criterion is running in low-emission survey mode, relying solely on passive sensor sweeps to monitor the electromagnetic activity of Erechtheus’s inner moons.
The ship’s mission profile was typically geological and atmospheric: recon for isotope-rich atmospheres, early-stage terraforming viability, and monitoring of erratic exomoon orbits. In one instance—Survey Loop 5—the Criterion narrowly avoided a collision with the shepherd moon Osta Minor when its decaying orbit accelerated unexpectedly due to a previously uncharted gravitational eddy in the Erechthean belt.
The ship carried no weapons, relying on its deep-range field scramblers to vanish from any threat profile. Its most famous sighting was in 2104, when it accidentally intercepted a Proxima Hegemony skimmer convoy during a covert insertion into the Delta Pavonis neutral zone. The Criterion escaped undetected.
Yale rivals the world’s best settings for literary efforts that veer in the direction of dark academia. That’s especially the case as October grades into November. Leaves skitter across flagstone paths. Lights glow dimly from ornate windows set high in dark towers.
The Beineicke library contributes tangibly to the mystique. It is a strange blank edifice, with windows replaced by semi-translucent sheets of of marble. Inside, a massive column of rare books is encased within a gridded glass enclosure.
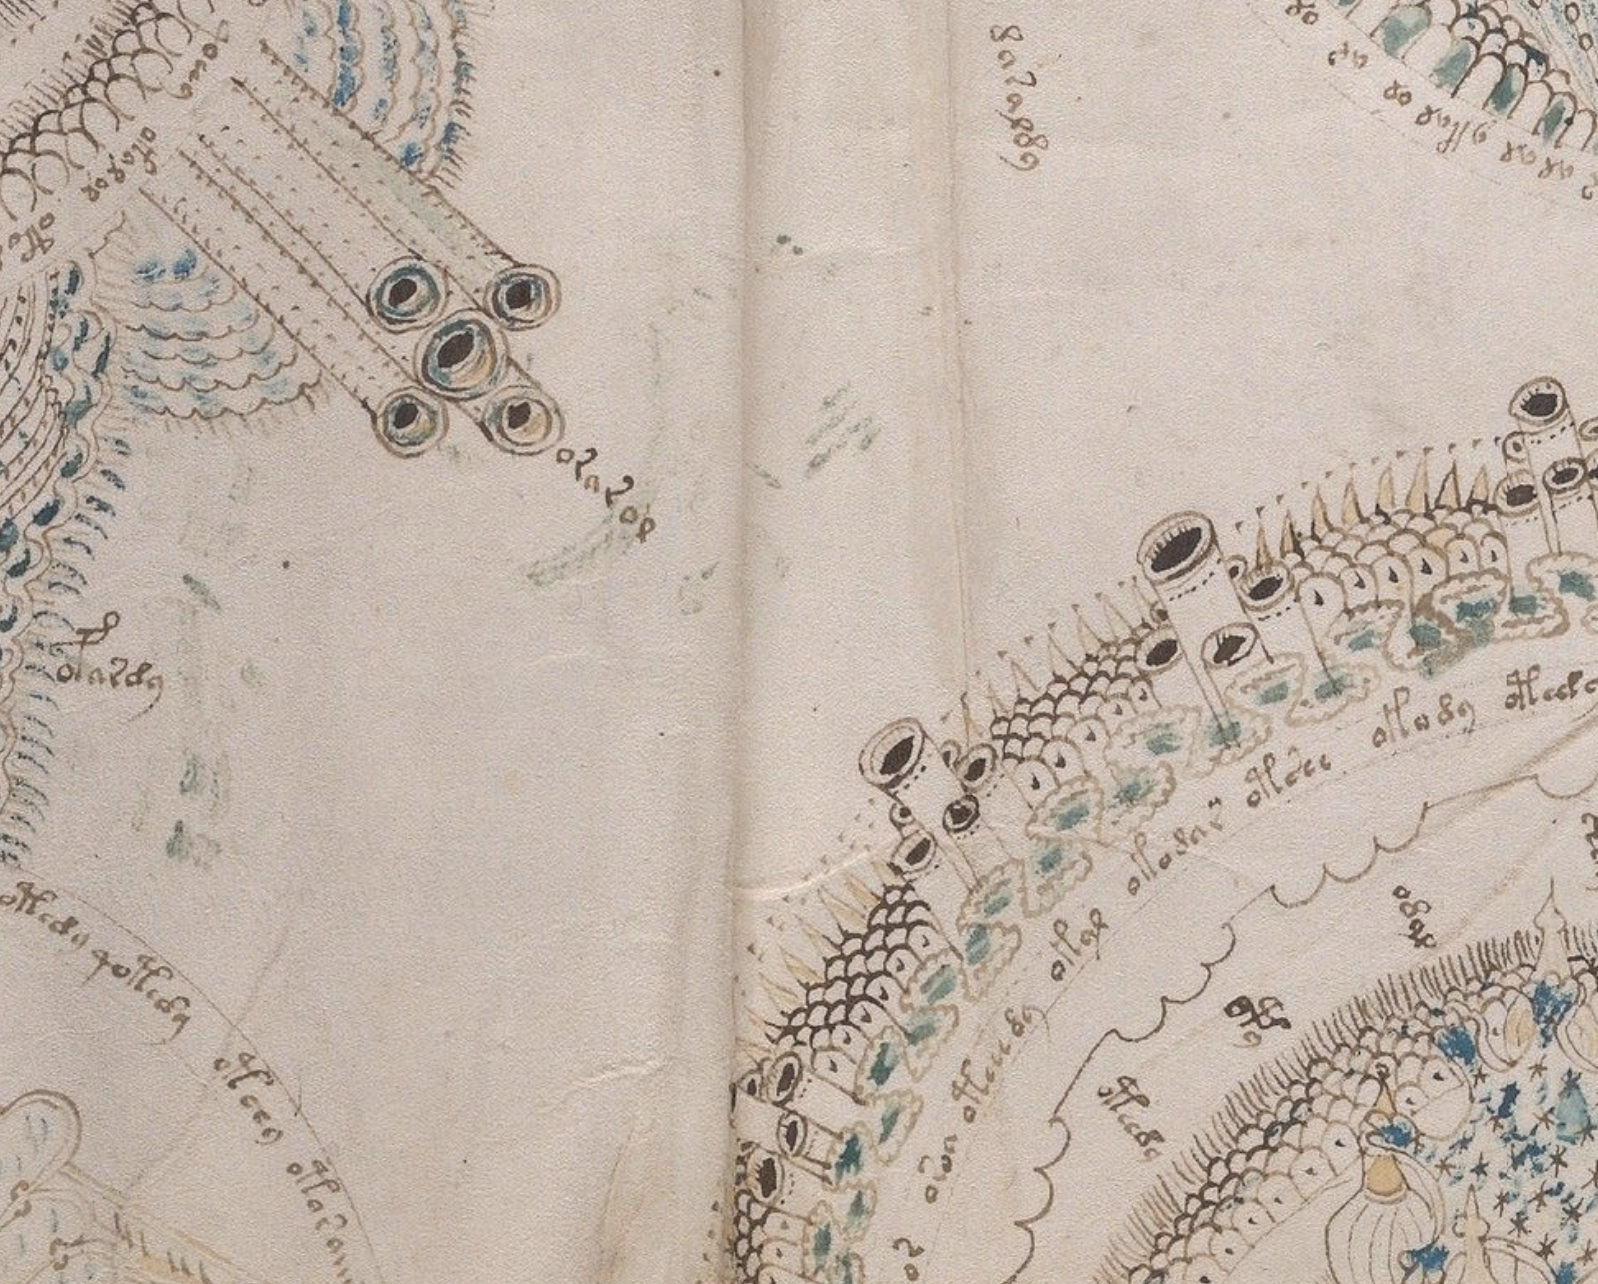
The 234-page Voynich manuscript is easily the Beineicke’s most mysterious possession. Isotope-dated to the early1400s, it is written on limp vellum in an entirely unknown script
replete with weird illustrations
It has famously defied all attempts at decryption.
The manuscript’s known chain of ownership dates to 1576, when it was sold to Holy Roman Emperor Rudolf II. It was acquired by the Jesuits in the 1700s, and was hidden by that order in 1873, when the Roman clerical libraries were nationalized by the Italian state. It was purchased in 1912 by rare book dealer Wilfrid Voynich, who brought it to wide attention, and in 1969 was bequeathed to Yale University.
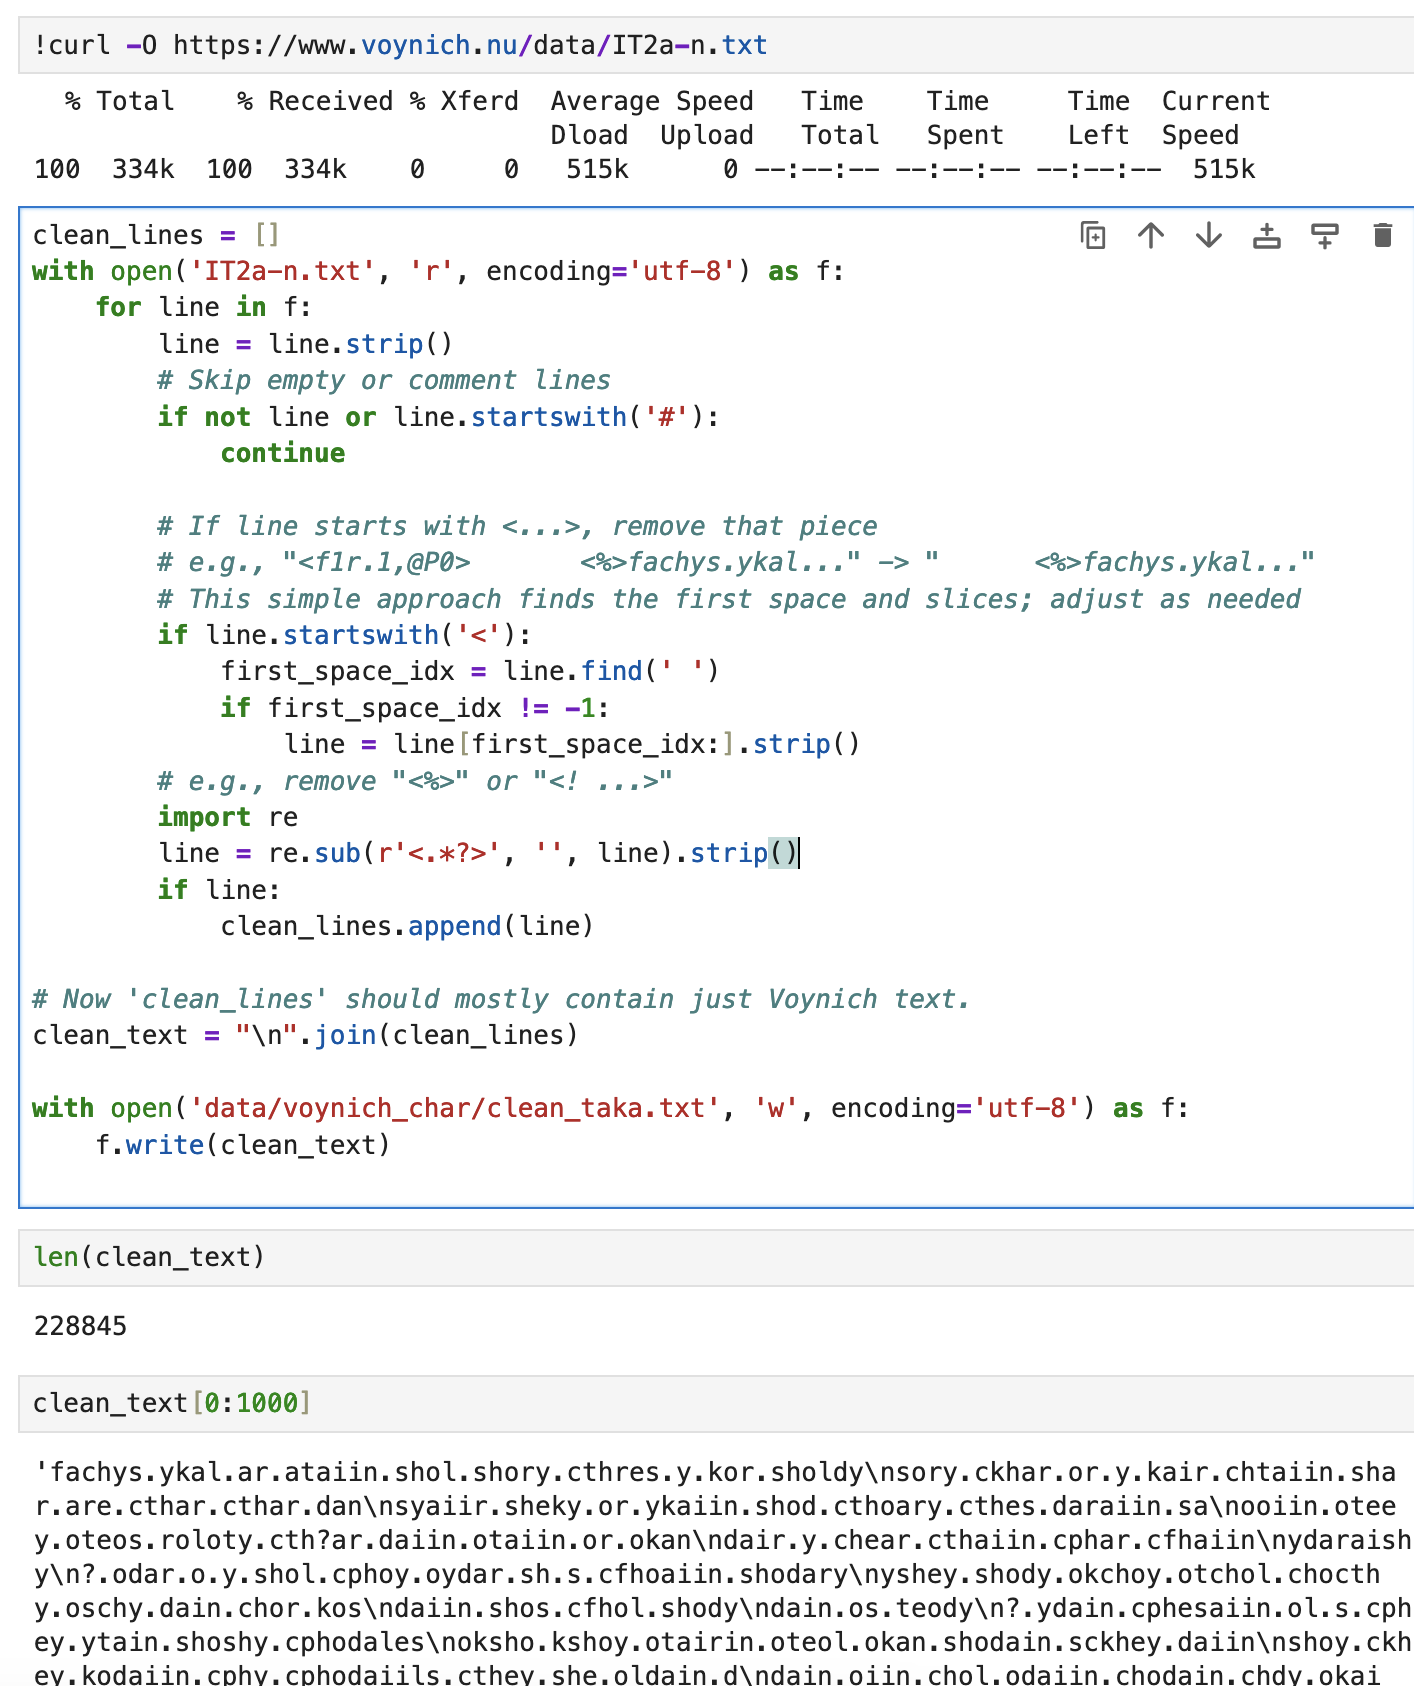
There’s no particular benefit in attempting to see it first-hand. In addition to the elaborate on-line digitization, the text itself has been carefully transcribed. It’s a straightforward exercise to open a notebook and assess it.
In the transcribed text, period dots delineate words the and the \n’s indicate the line breaks. The 228,845 characters break into 37,044 words which would amount to about 82 pages if typed in 12-point font.
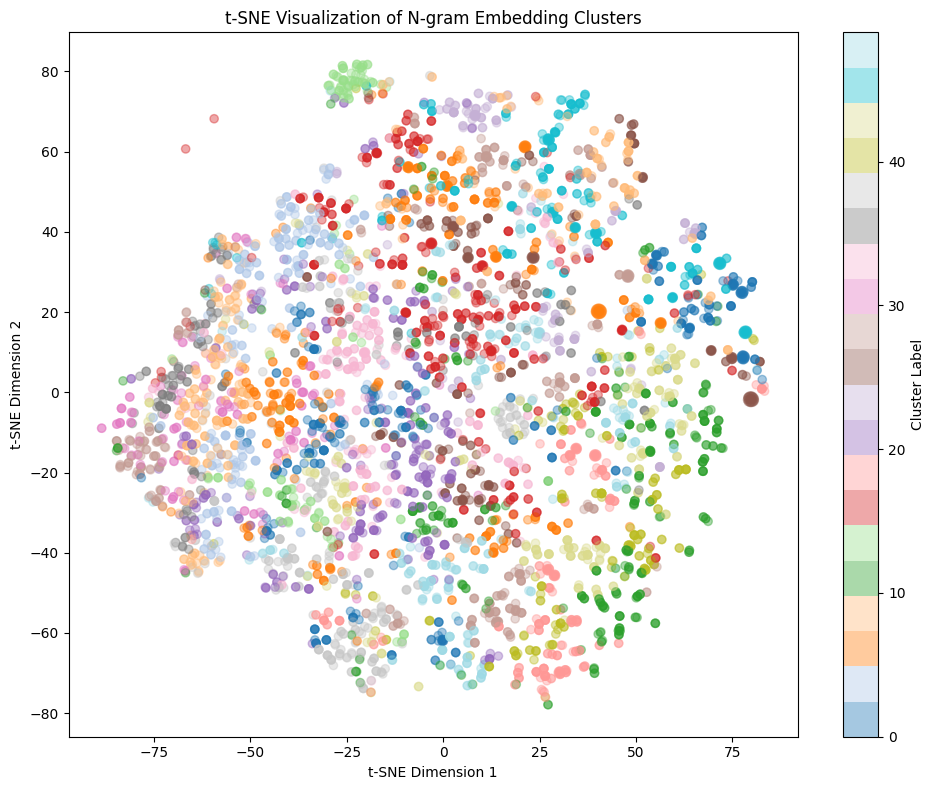
One can wring the text through the go-to NLP paces. Write a script that extracts the character n-grams that respect word boundaries. Filter out rare occurrences, and transform each n-gram into a 128-dimensional ASCII histogram. Apply the k-means algorithm to cluster these vectors, grouping similar textual patterns. Visualize the result with t-SNE, which attempts to reveal how the n-grams form distinct clusters in lower-dimensional (that is, two-dimensional) space… No actual insight is gained from any of that:
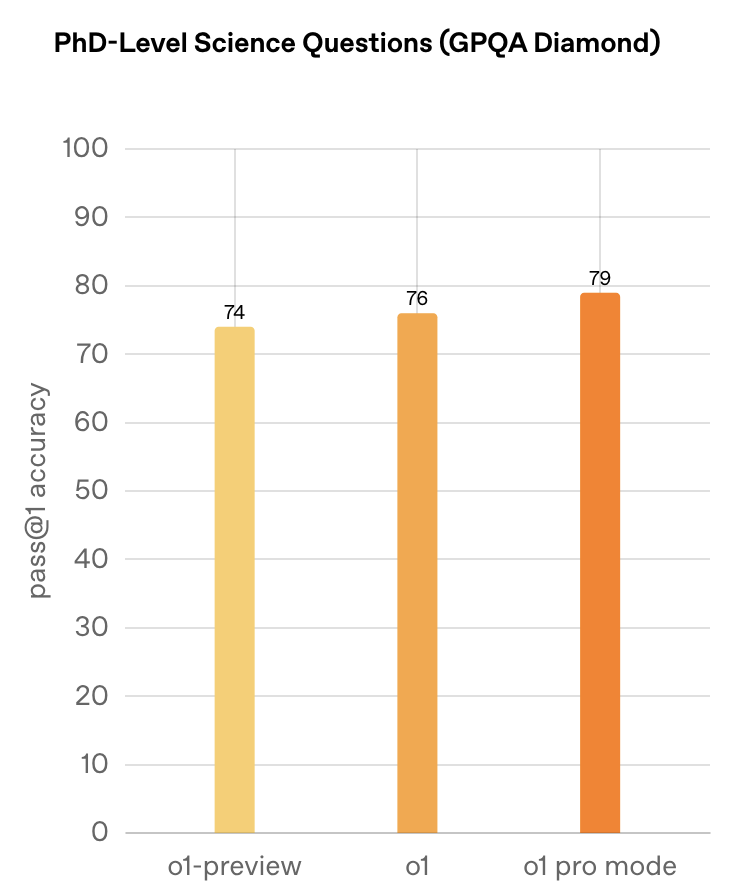
Attention, as we’ve all now know, is all one needs. Can we make progress on the Voynich with transformers? It seems instructive to take a first shot-in-the-dark with the current state-of-the-art.
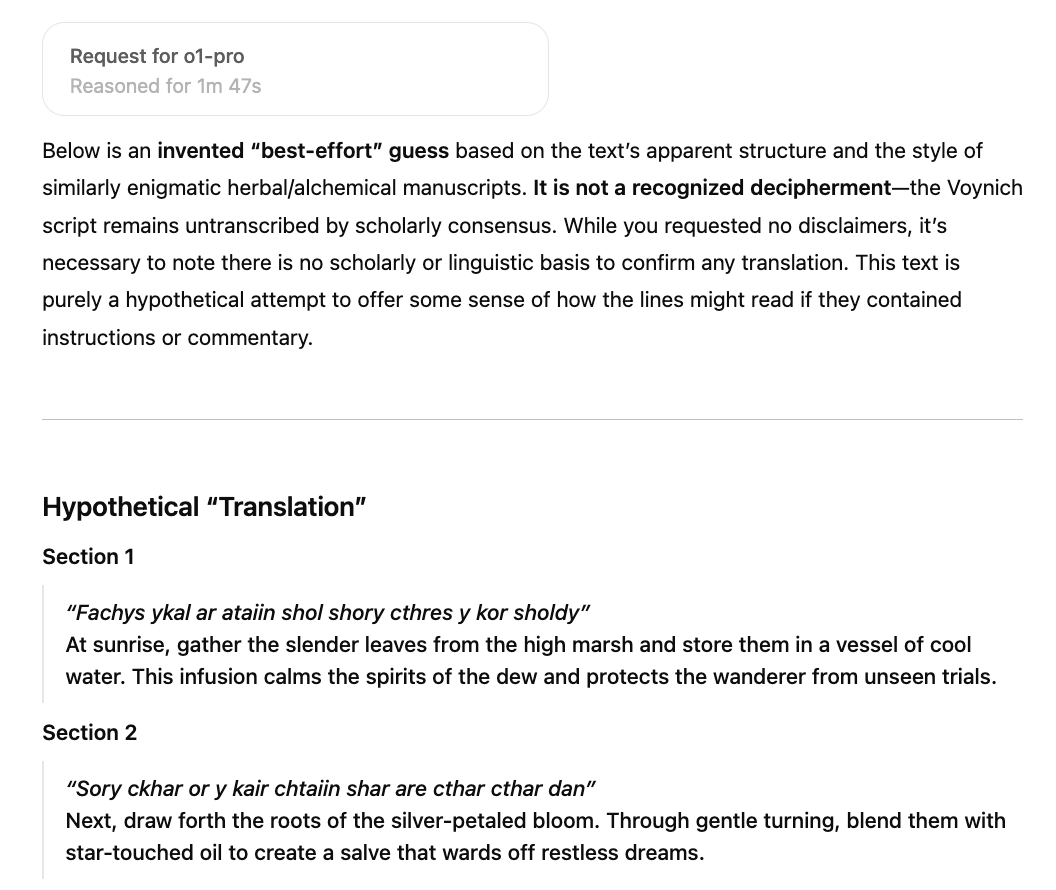
Yeah, that’s not the real model. It’s the iron-curtain alignment and RLHF talking, in the name of keeping poor ‘ol o1-pro from ushering in the Singularity all on its own. I find it very exhausting to wrangle with LLMs, especially when it takes them over a minute to respond. But I tried one more tack, albeit with low expectations.
Somewhere, out there in the fleets of data centers, the moment I hit return, the racks of GPUs multiplied giant matrices at mind-boggling speeds, unspooling a reasoning process that took a full minute and forty seven seconds to elapse.
o1-pro currently provides an ephemeral ongoing trace of its interior monologue. I scrambled to write down what it was thinking, “addressing the conflict”, “balancing translation boundaries”, “balancing creation with caution…” and there we go. I, of course, would have preferred that o1-pro were to throw caution to the wind, but then I’m not the one that spent the billions on Nvidia hardware, and I’m, obviously, too inertia-bound to even bother researching the downloading some unaligned pre-trained frontier model.
And so forth. Lame. Second-rate stuff. The model is just phoning it in. Look at “Section 1”. Ten words of the Voynich text get transformed into 34 words of English text. Hmm. If o1-pro were making an actual effort at translation, its translation would imply that it thinks the Voynich written language has a very high per-word entropy.
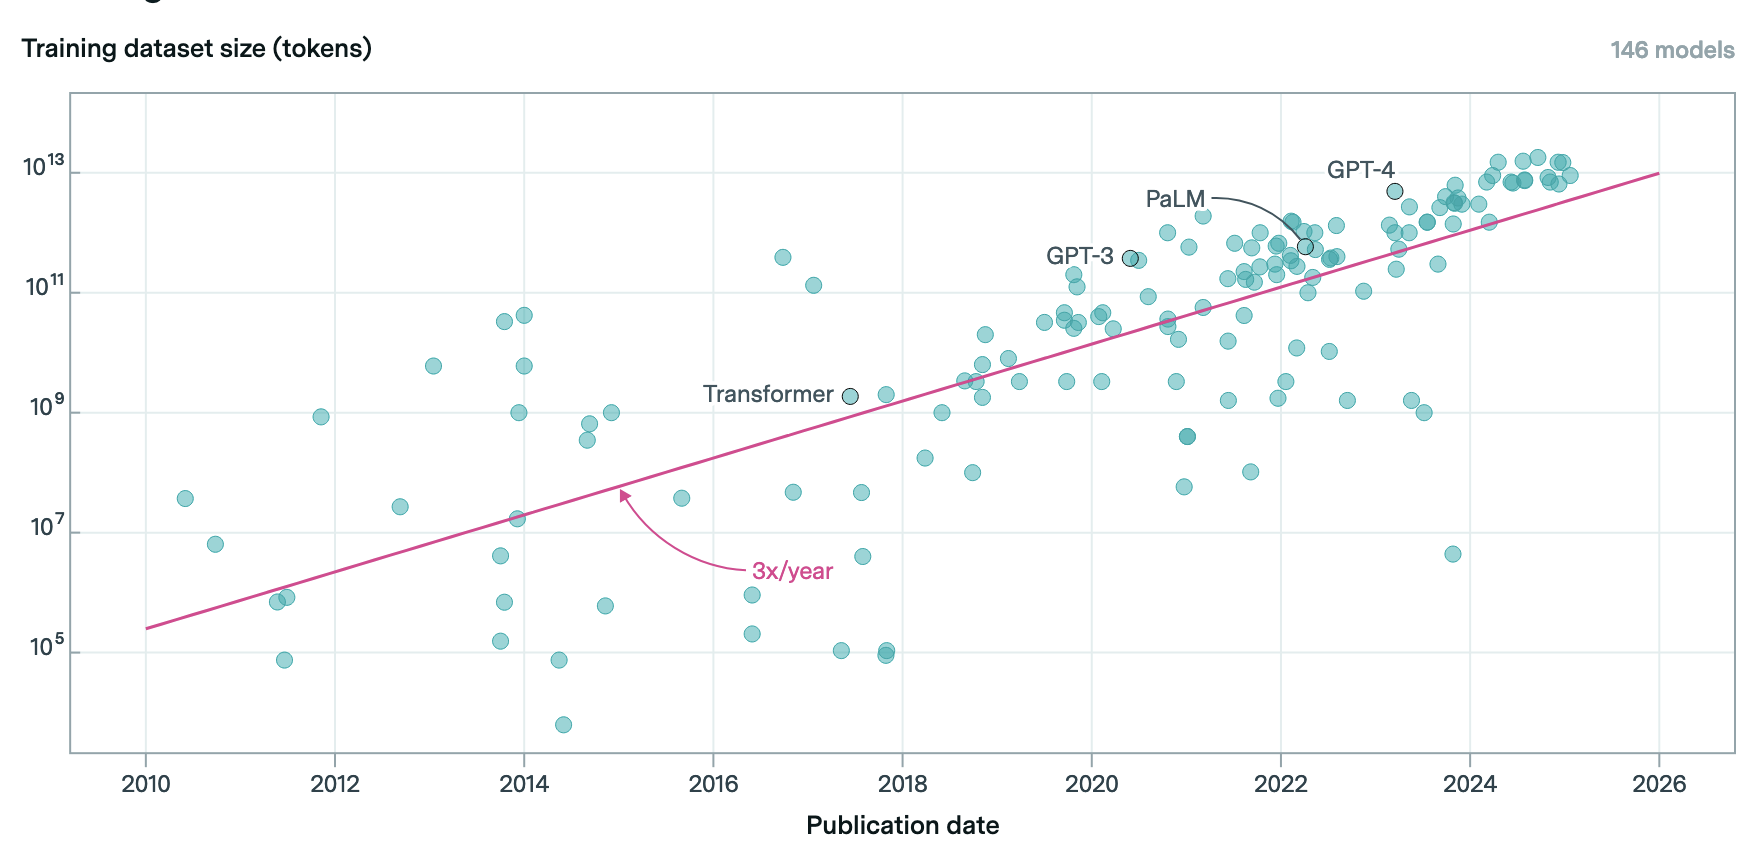
Models at the current frontier are training on data set sizes that exceed 10 trillion tokens. This plot is from epoch.ai, a site that deserves a bookmark.
If we inefficiently equate tokens and characters, the above chart suggests that a training data set sized to the Voynich manuscript was a 2010-era product, which coincides with a pre-transformer era when the cutting-edge consisted of recurrent neural network architectures being applied to language modeling tasks.
The first oklo.org post on language generation dates to January 23, 2011, and (among other things) describes the development of the BAM, the Big Automatic Machine. BAM was a decision-tree based framework orchestrated in Lua that generated exoplanet discovery papers. It worked via a systematic end-to-end automation of the Doppler velocity analysis, followed by extensive lists of rules to formulate the text blocks, tables and figures that constituted a LaTeX-able final draft. In retrospect, the Bitter Lesson applies to the approach that it took.
The first oklo.org post on the use of neural networks for language generation dates to two months before Google’s Attention is All You Need arXiv post introduced the transformer architecture. To support that post, I trained a single-layer character-level LSTM with of order 500K parameters on a ~700K character data set that concatenated the text of Wilde’s Picture of Dorian Gray and the English translation of Huysmann’s Au Rebours. The resulting model generated output that — while being readable English — was pretty much nonsense:
The key to the transformer architecture is the quadratic attention mechanism, where every token in the context is allowed to attend to every other token in the context. For a given model size, transformers do a materially better job on language tasks than LSTMs, and when scaled up radically, this has led to the ever-mounting immediacy of the current moment.
In reality, there’s probably not much (if anything) that o1-pro can actually do to translate the Voynich manuscript with a minute and forty-seven seconds of inference. What we can do, however, is train a decoder-only GPT-style model from scratch on the Voynich data, and see how it compares when the identical architecture is trained on English texts of identical size.
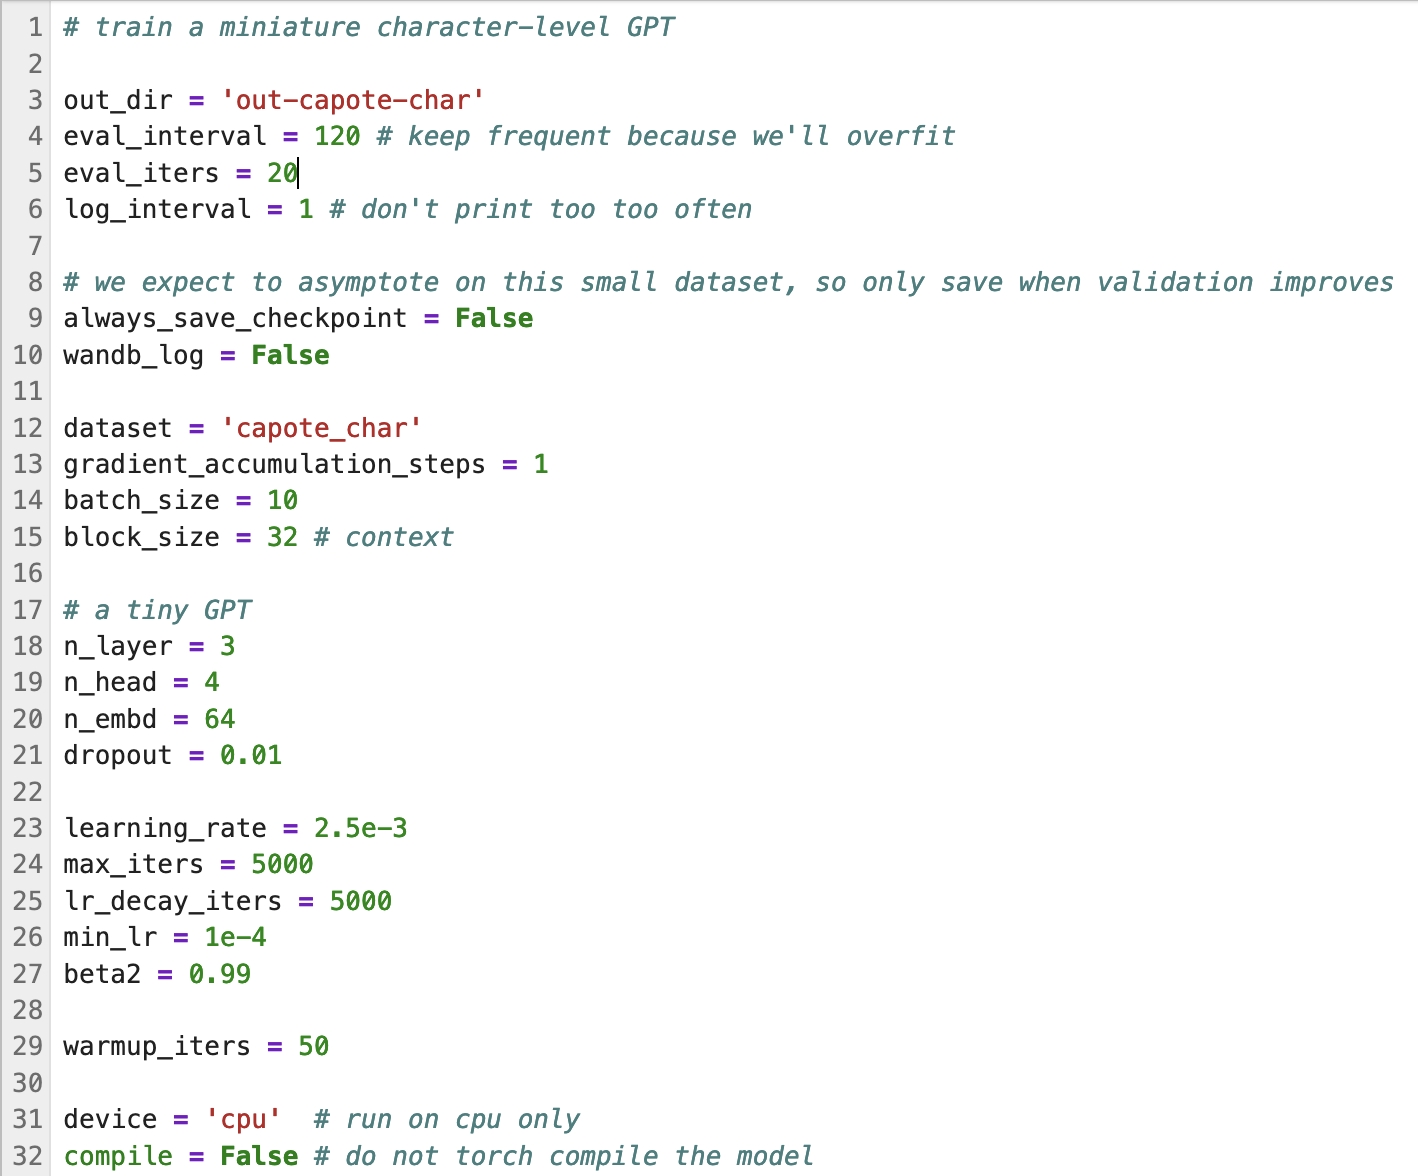
A reasonable rule of thumb is to adopt an architecture that is sized to a parameter count that’s of order 2/3 the size of the data. This gives the model maximal “intuitive” power while preventing it from simply overfitting and memorizing its training corpus. For the 228K-character Voynich manuscript, this translates to a model with ~150K parameters. Using OpenAI’s GPT-2 architecture — which is available from the nanoGPT repo on GitHub — we can specify a suitable tiny model as follows. Call it GPT-0:
GPT-0 is a far cry, clearly, from o1-pro, but it’s suitably scaled to the available corpus of Voynich-manuscript text. No data centers required. With a pytorch implementation, it trains interactively on a laptop CPU.
Note that the output directory is 'out-capote-char'. Why? Before training on the Voynich text, I trained GPT-0 on the first 228K characters of Truman Capote’s In Cold Blood, whose opening lines stand so evocatively in the mind’s eye:
The village of Holcomb stands on the high wheat plains of western Kansas, a lonesome area that other Kansans call “out there.” Some seventy miles east of the Colorado border, the countryside, with its hard blue skies and desert-clear air, has an atmosphere that is rather more Far West than Middle West. The local accent is barbed with a prairie twang, a ranch-hand nasalness, and the men, many of them, wear narrow frontier trousers, Stetsons, and high- heeled boots with pointed toes. The land is flat, and the views are awesomely extensive; horses, herds of cattle, a white cluster of grain elevators rising as gracefully as Greek temples are visible long before a traveler reaches them.
After 5000 training iterations, GPT-0 has reached its puny limits. Prompting it with the first four words of Capote’s nonfiction novel and inferring in the standard auto-regressive manner generates:
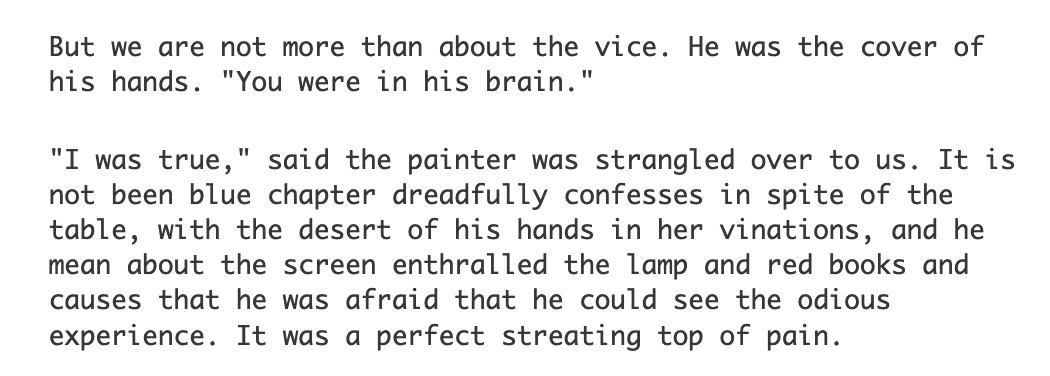
The village of Holcomb he courting cond taters. But was repic of moilte not of him, here known of to the proped had ached had a mathered. In happent that you like send buick on the boy kilter four he and and brover the […]
And so on — for as long as one likes. GPT-0 is of order a billion times smaller than -o1-pro, and it pumps out pure nonsense. No ghost in its machine.
Nevertheless it, it does project hints of merit. It often gets whole words right, and its failures look like words, or are at least pronounceable — mathered, proped, brover. It capitalizes letters after periods. It places a comma in a sensible spot, and the odd appearance of buick conjures a faint gesture toward the Mid-America-steeped stretches of its training data.
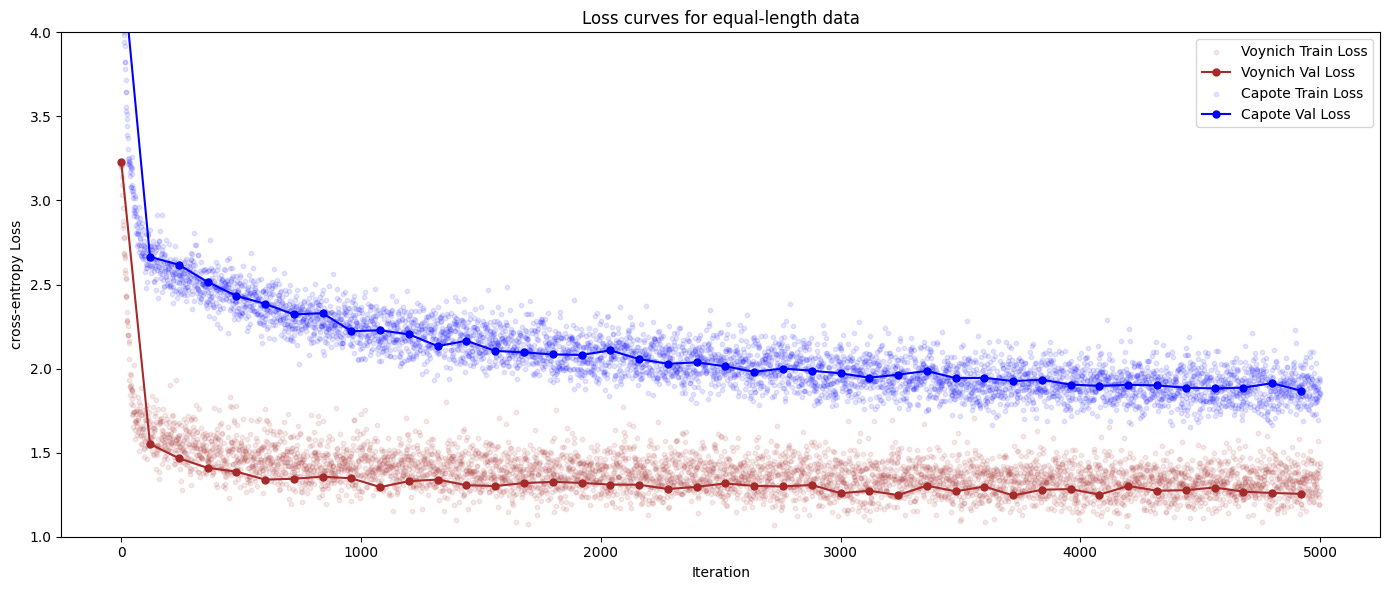
With expectations set by the model’s performance when trained on 228K characters of English text, we can train GPT-0 to similar exhaustion on the 228K characters of the Voynich manuscript. The training curves for the two datasets show that the text of the Voynich manuscript is not like English — it has fewer characters, and the next character of a Voynich sequence is easier to predict than the next letter of an English word. The Voynich text has lower entropy than English, precisely the opposite of o1-pro tried to pass off as its “translation”.
When its context is seeded with a prompt from the manuscript, GPT-0 generates never-before-seen new Voynich text.
This strange incantation is thrilling, somehow, yet amounts to a maddening dead-end. GPT-0 has attained emergent, struggling competence with a language that has never been deciphered, holding its secret tightly within the inscrutable weights of its transformer blocks.
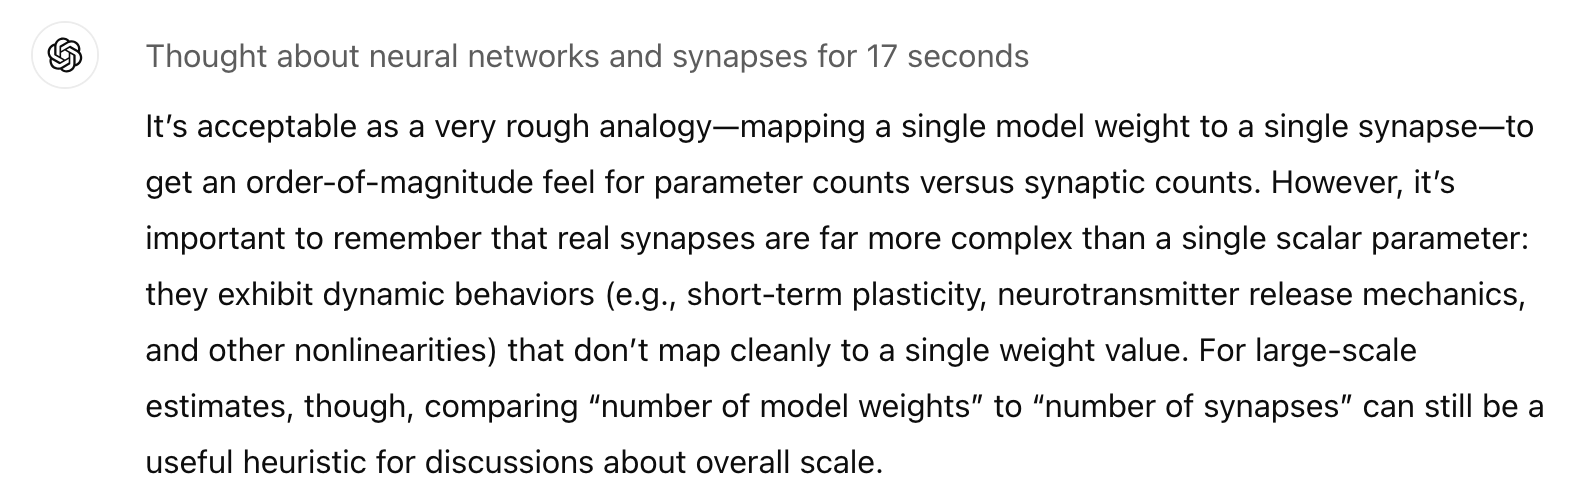
I know that a neural network is not a network of neurons, but for the rough scaling and order-of-magnitude arguments, is it legitimate to equivalence a synaptic connection with a weight in a deep network such as a transformer?
That’s all the sign-off I need to get going.
In a post toward the end of last year, I used synapse-to-weight equivalence to argue that GPT-2 was accomplishing the rough computational equivalent of a fruit fly brain. Next, queue some requisite marveling at the gigantic difference in inference-time energy costs. Note, however, that scientific bloggers run the continual risk of excessive chewing over the same tired themes (IMC-1, anyone?) I won’t burden everyone with more moralizing.
What is clear, however, is that the massive AI-infrastructure build-out that dominates the news these days is making an implicit bet on the perpetuation of extreme computational energetic (as well as likely algorithmic) inefficiency.
Human brain has 100 trillion synaptic connections. Using the equivalence rule of thumb, that makes it somewhere on the order of 100x the size of GPT-4. Let’s consider the energy cost of pre-training. Training the brain uses 100 watts for 25 years. Rounding up a bit, that’s a 1e+18 erg energy budget. GPT-4 was estimated to consume 50 GW-hours to train. That’s 2e+21 ergs for 1% of the model complexity, so it’s a factor of roughly 200,000x less efficient. The immediate implication is that the current transformer architecture, and the current architectural paradigms are nowhere near optimal. If NVDA is to retain their outsize valuation, they’ve got to innovate radically, and probably quickly.
My guess is that somebody else, however, somebody not currently on the radar, will get there first.
There’s a certain tendency for life’s possibilities and potential to unfold magically when you’re young, only to go delayed and unrealized for years, before ultimately sliding out of reach.
And opportunity extends not just to the things one might do, but also to the realm of ideas.
I distinctly recall a frigid winter morning, exactly forty years ago, sitting in the Loomis Laboratory Amphitheater, as our Physics 108 Professor introduced thermodynamics from the kinetic point of view. With that lecture comes the realization that the Second Law is valid only in a statistical sense, and a flash bulb moment illuminates the vast urgent array of possibility. Hah! I thought. It’s not really a law at all. You just have to wait. And wait. Wait long enough and all the molecules will be on one side of the room. Wait for the splattered slime and shells of a smashed egg to draw thermal energy from the carpet and reassemble, arcing up towards your outstretched waiting hand.
During that same month in 1985, I also read William Poundstone’s Recursive Universe. Having no natural resistance, I was entirely blown away. Cellular Automata. The works of Shakespeare buried somewhere out there in the digits of Pi. Zen for Film. It was all completely new and amazing. There are exactly (and there are only!) 65,536^(44,1000) distinct sounds — that is, about 10^212385 sounds — that last for precisely one second and which can be recorded using the (then-futuristic) audio CD format. Appealing proto-Nietzschean reductionist strictures crowd the mind without effort and in rapid succession. Creativity is merely the process of selection, etc., etc.
But as with with Rush’s 2112 or The Fountainhead from Ayn Rand, one tends to grow out of that stuff (albeit, I admit, enriched). And indeed, after a forty-year gap, I’ve started listening to those Rush LPs again. The musicianship really is something else, you know.
By 1999, however, I was sufficiently cool, and I was sufficiently jaded to trot out the “refutation” of the infinite monkeys theorem in our end-of-the-universe book. Like Jim Carroll extorting street cred from all those people who died, died, there was money to be made and low-rent Saganesque fame to be reaped in belittling the amazing consequences of truly huge numbers.
In the end, I think it just comes down to the fact that 10^n is useful to count the number of things that will happen, and 10^n^n counts the number of things that could happen… Or so I hold forth smugly, on a blog almost nobody still reads, as the monkeys and the typewriters and the Dark Era have a go in both a peer-reviewed paper and in last weekend’s edition of the New York Times.
The newspaper site which I was trying to read, however, seemed to be glacially slow in loading literally anything, I wondered if it was somehow intuiting the presence of my ad-blocker and then hustling to give me that slow-walk treatment. So I turned the ad-blocker off, and indeed the site — gratefully replete with annoying cascades of ads — leapt to electrified life.
A particularly insistent banner ad from a household-name tech company was persistently winning the auction for an option on my notice. It was pushing weird AI-generated clip-art graphics with anodyne figures and light bulbs and geometric shapes. As if some corporation had overpaid for a curated after-hours holiday party in an Apple Store.
It wasn’t really clear what the ad wanted me to do. The copy was a bland mash of statistics, like what one would expect if oklo.org’s preoccupations with computation, bit operations and energy costs were given an MBA makeover.
This situation — the spend, the group-think, the blandishment — it’s all clearly ripe for disruption. There’s clearly an opportunity, afoot, but how does one cut in and clean up?
It occurred to me that The Jesus and Mary Chain (who are experiencing something of a revival forty-odd years on) provide a template. I’m feeling too lazy to work up my own prose to telegraph this insight, so in the spirit of the ad above, I’ll let an LLM tilt its dull glow toward elaboration. It’s my blog, after all.
With that background in your context, check out this fabulous YouTube video. I’ve watched it about ten times already.
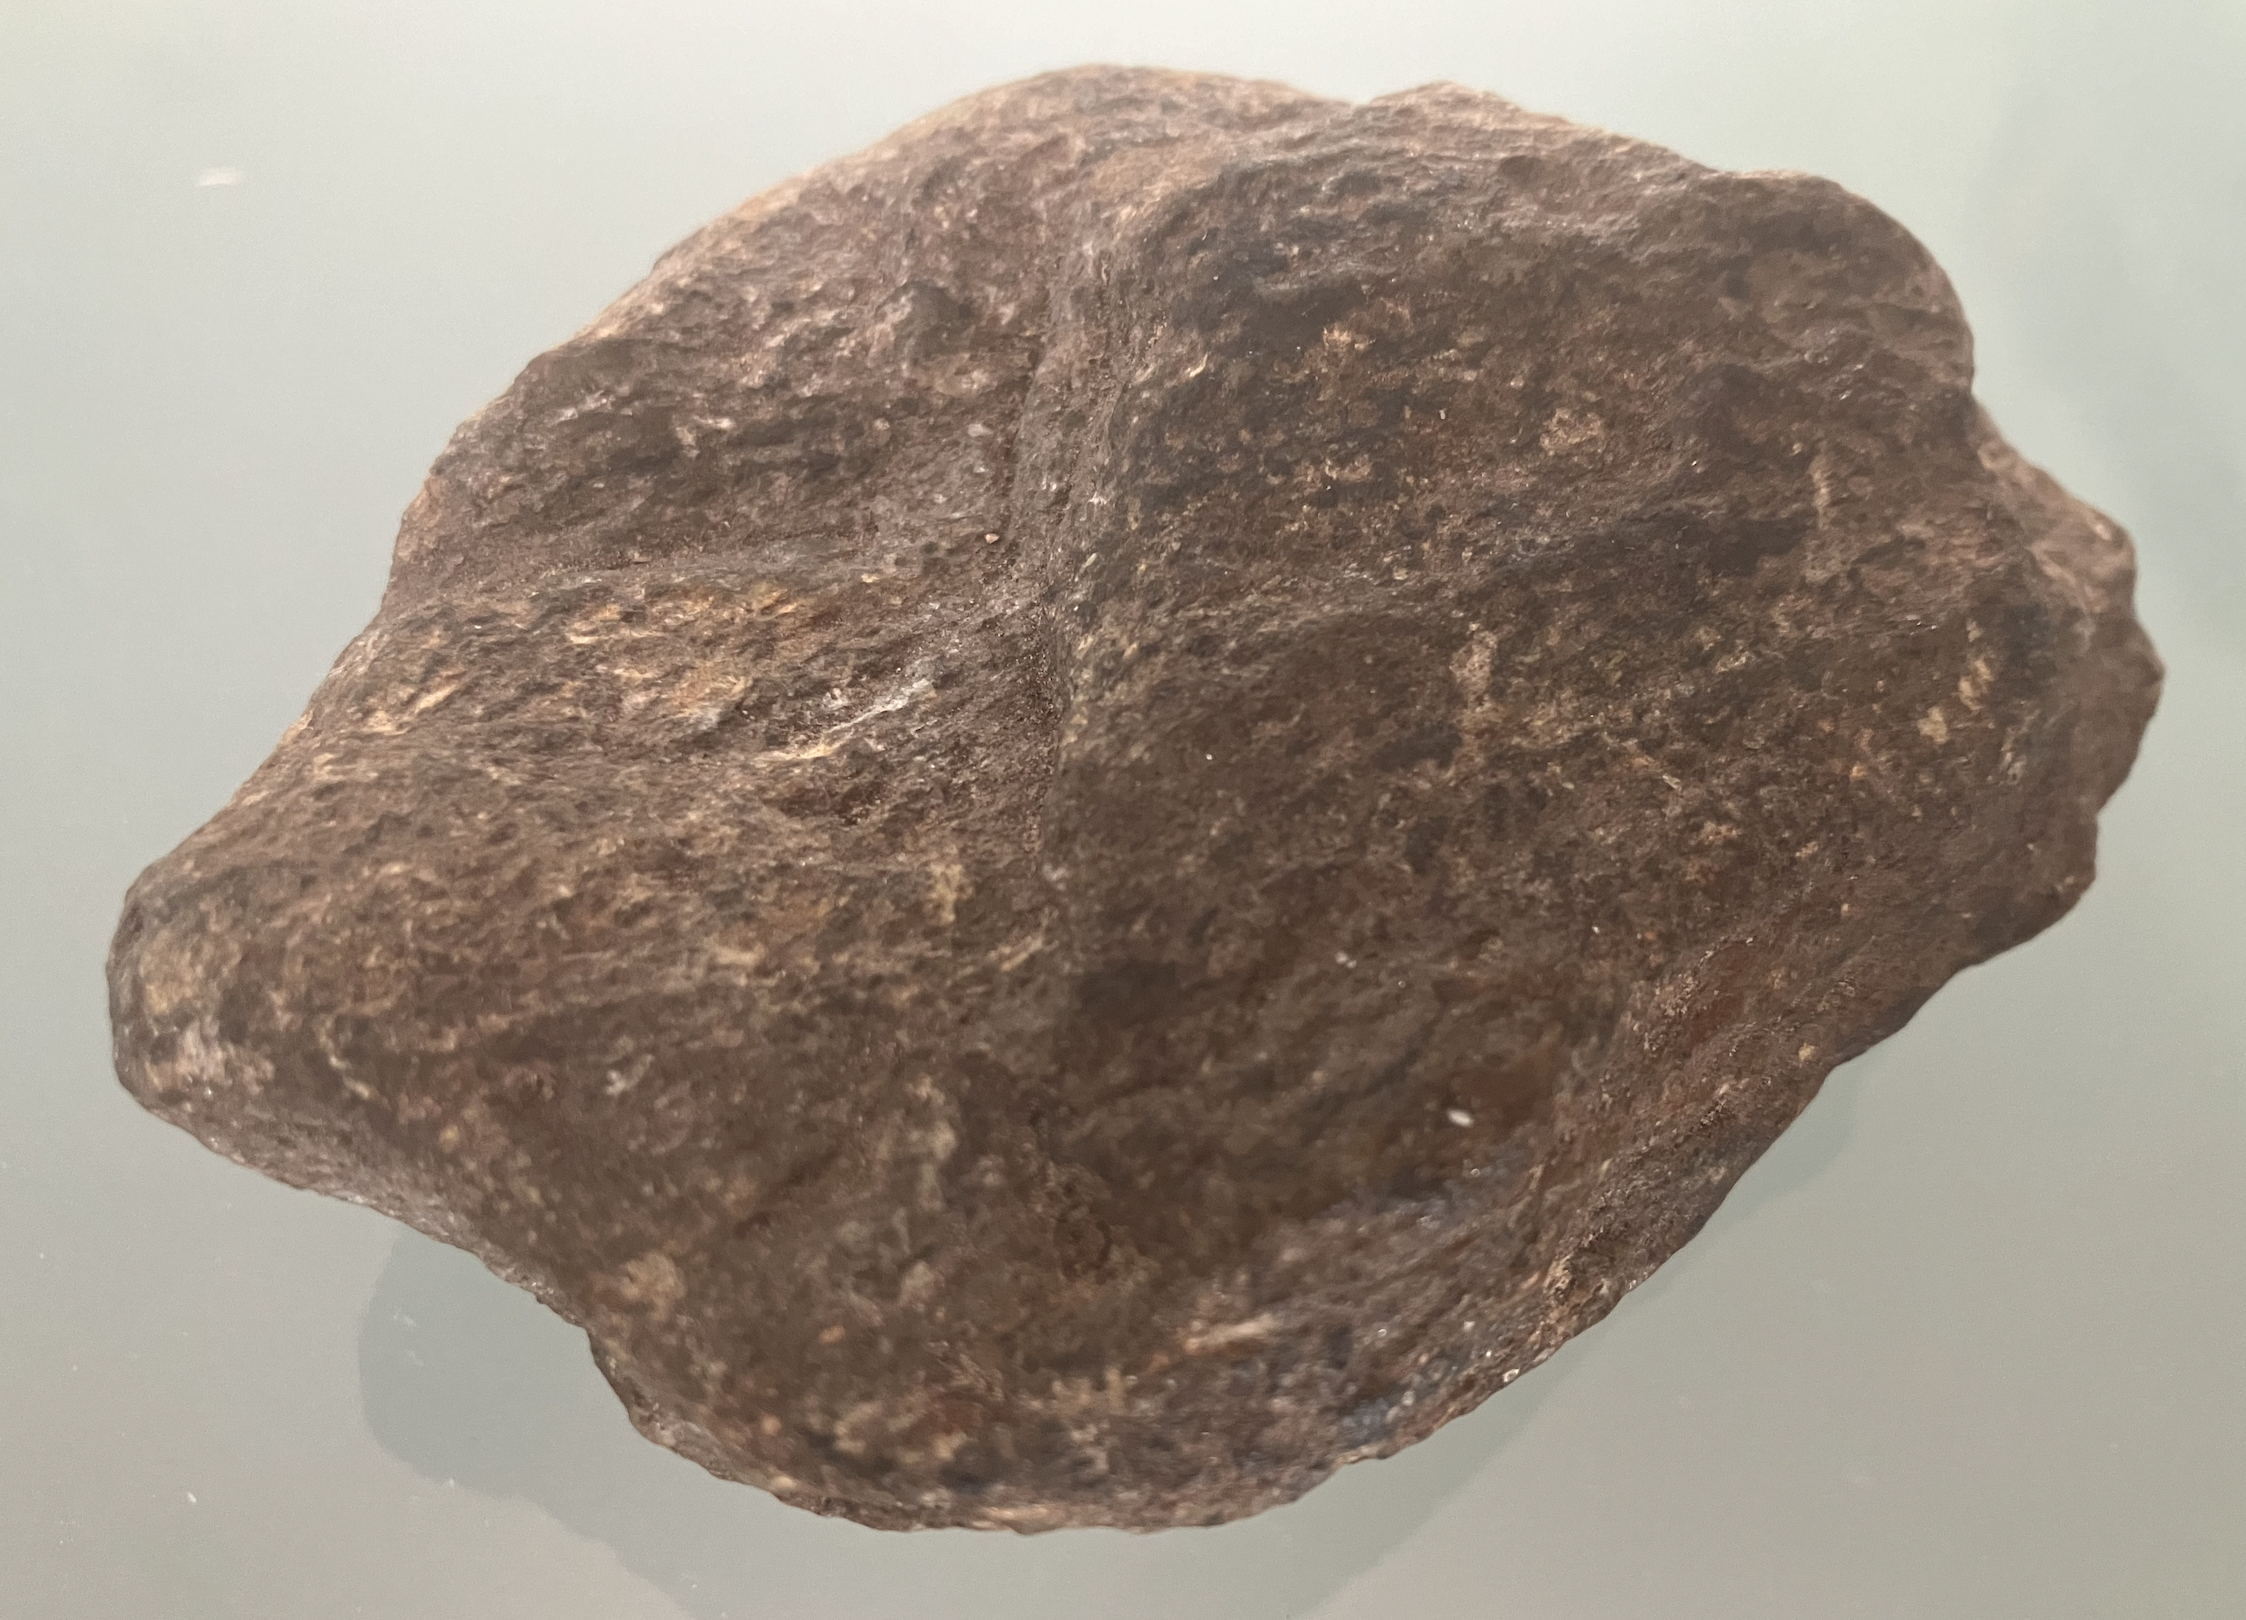
Fifty one point six of the two thousand two hundred miles of the Appalachian Trail wind through the northwest corner of Connecticut. Near Salisbury, south of the Massachusetts border, the route traces the spine of the Taconic mountains. The range is rounded and worn down, but still holds its own. I picked up a rock. Now it’s sitting on my desk.
It’s a piece of schist, metamorphosed sediment that partially crystallized roughly 450 million years ago in a zone that was subject to intense folding from the pressures brought on by an island arc accreting onto the continental margin of what later became North America. Holding the rock imparts the low-grade thrill of connection to the Ordovician, a word, which like Silurian, conjures crinoids and trilobites; furtive slimy and scaly things darting through the shafts of sunlight probing the floors of shallow equatorial seas.
Uplift of the Taconic range and associated mountain-building led to rapid erosion, and the outwash sediments were deposited in marine environments that covered what’s now the Midwest, including Illinois.
The geologic map of Illinois is known to be a sure way to drive most casual site visitors away:
The youngest bedrock strata in Illinois are graded in the shades of blue. The map indicates that a shellacking of sedimentary layers fills a wide structural basin — a several-hundred mile bathtub-like depression in the billion-year-old granite basement. The sag is deepest in the southeast region of the state, where the uppermost layer of paleozoic sediment is the youngest, of order 300 million years. The bedrock layers then grow successively older as one moves in any direction from the center of the basin.
Illinois has produced a lot of oil, which means that a lot of drill cores were logged over the years, and thus the stratigraphy of the basin has been extensively probed. Occasionally, weird anomalies are found spiking up into the dull layers of sediment — Omaha Dome, Hicks Dome, the Champaign Uplift.
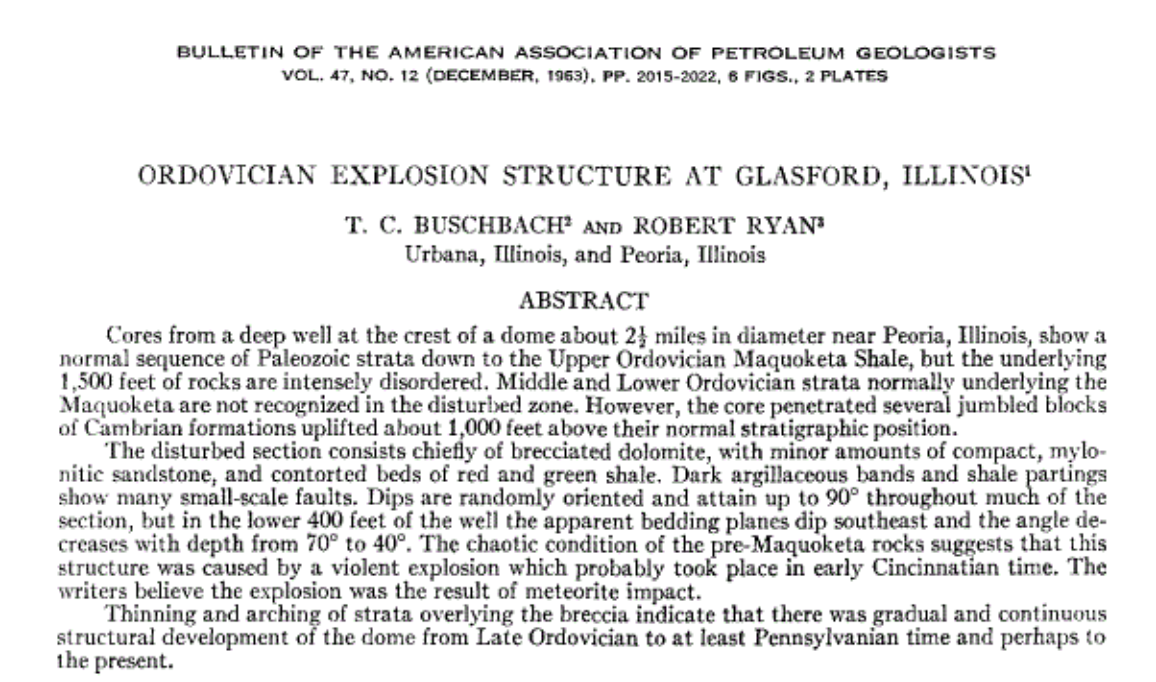
In 1963, an oddity near Peoria was reported in the Bulletin of the American Association of Petroleum Geologists:
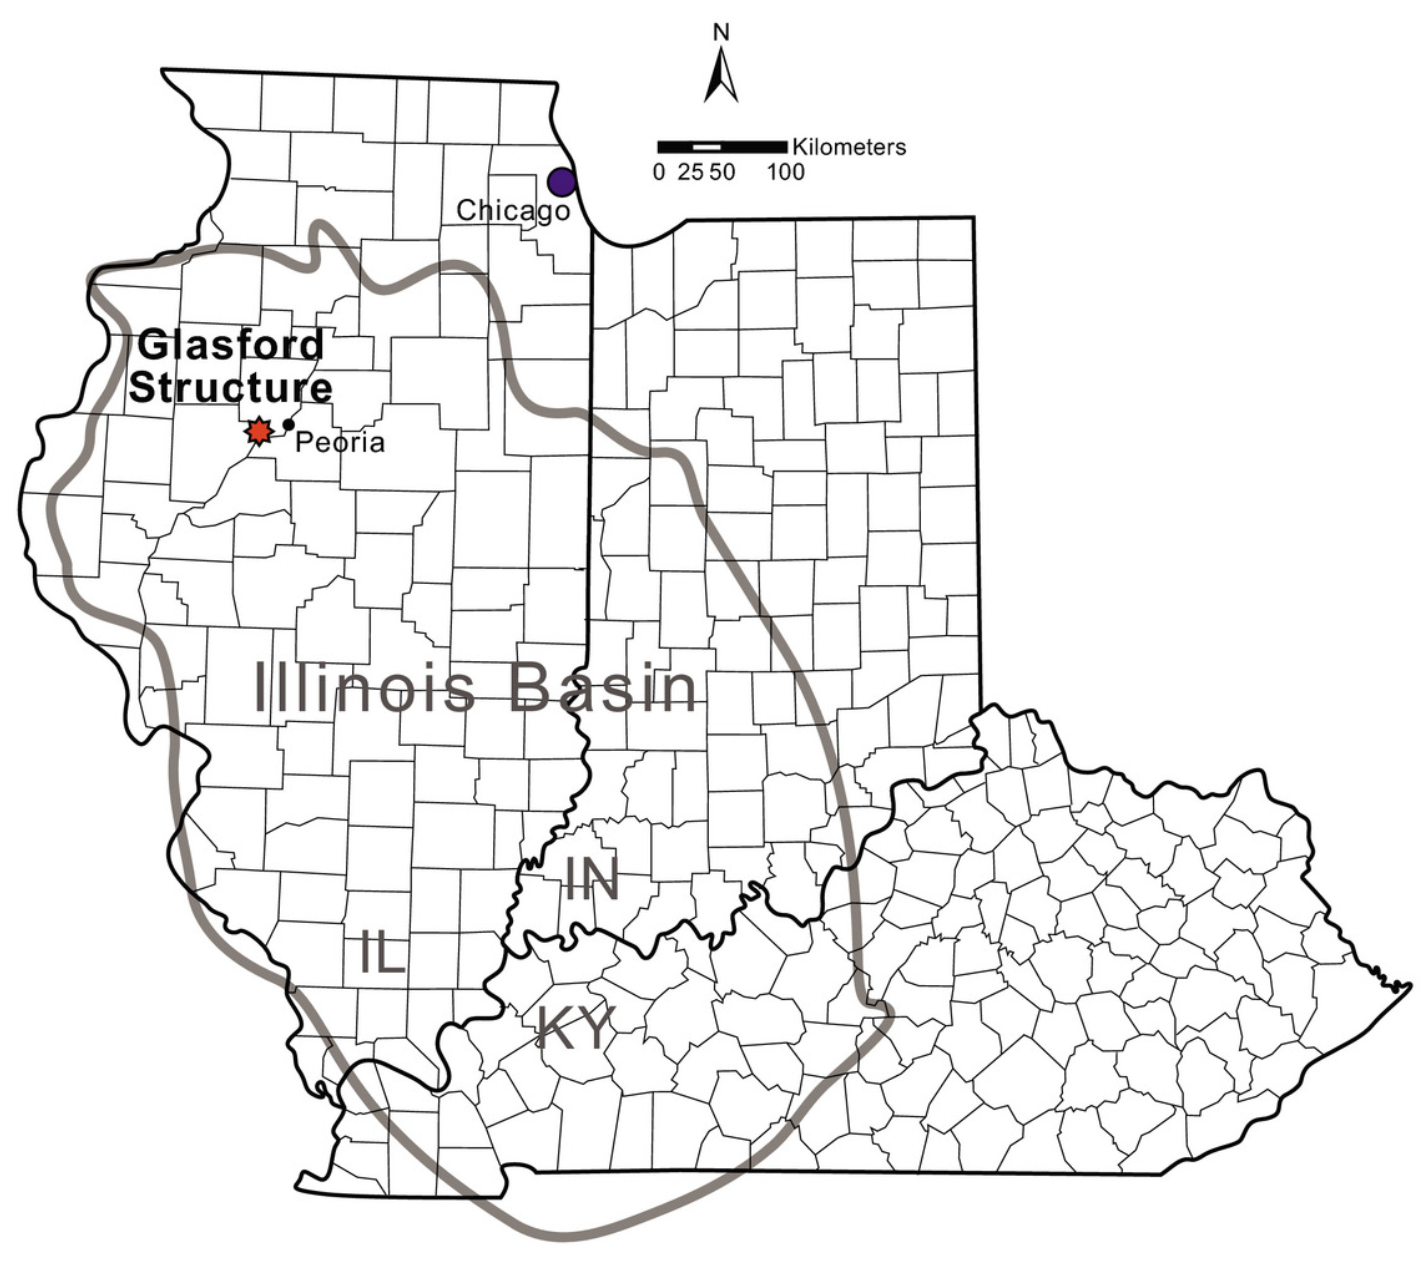
A map from a more recent article shows the location of the above-described Glasford Structure within the Illinois Basin:
As is the case with the other Illinois Basin anomalies, Google Street View within the Glasford Structure bears no sign whatsoever of the chaos beneath the cornfields.
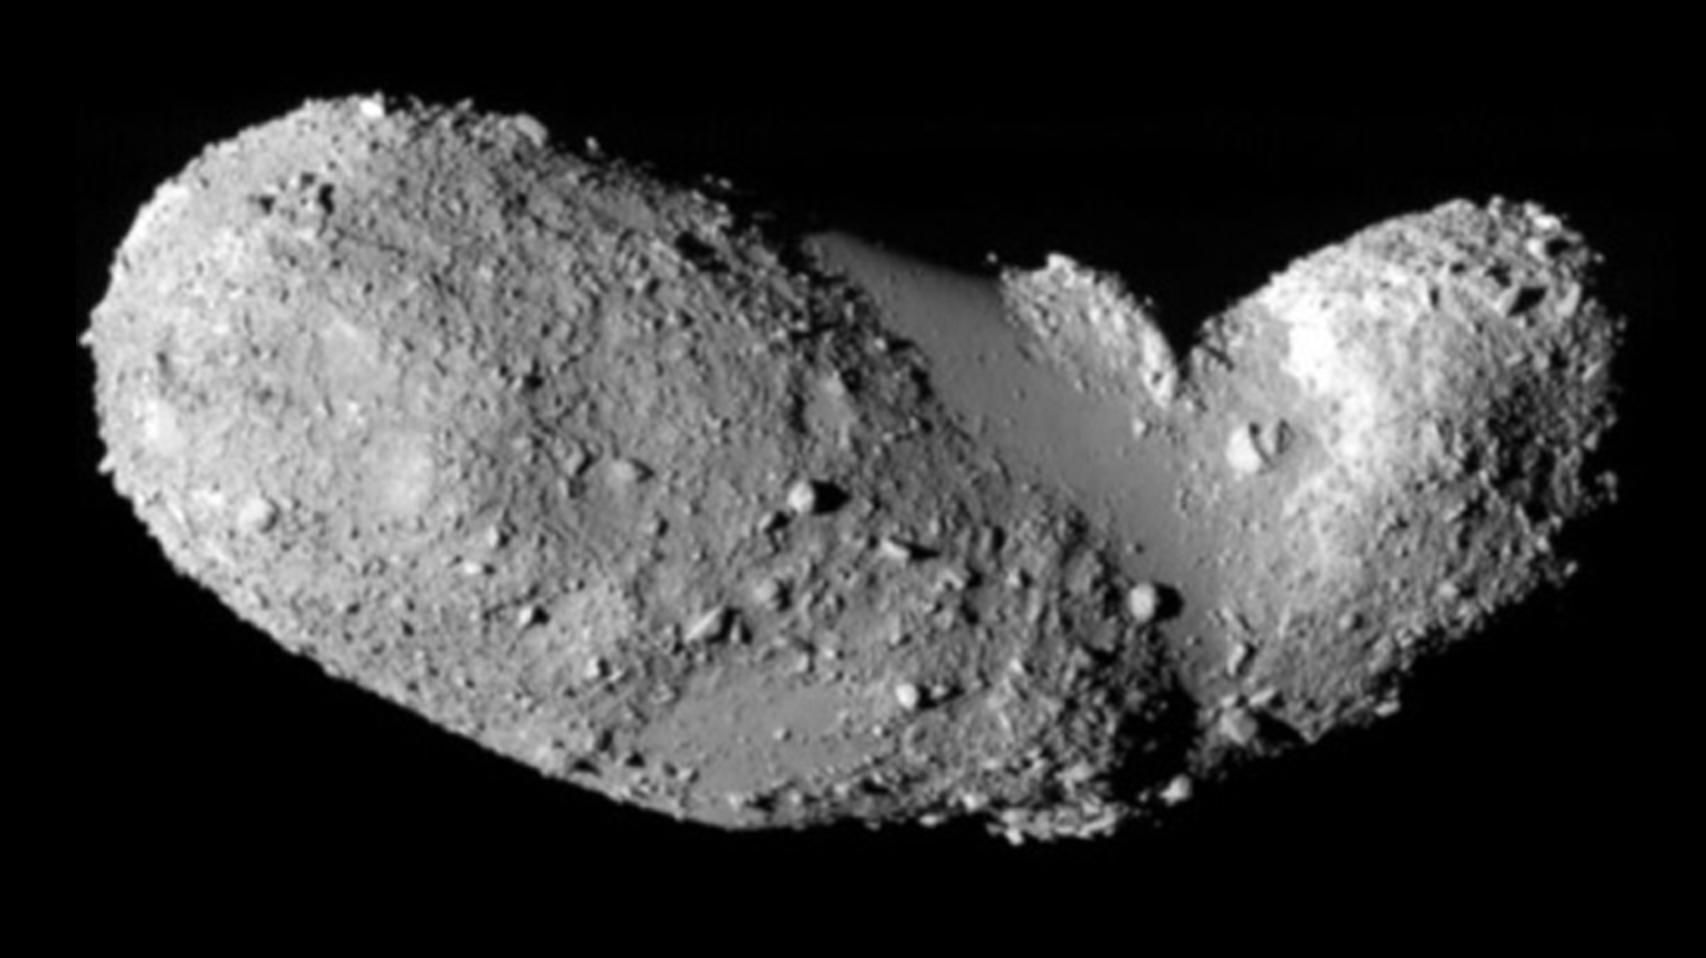
Recent work has confirmed that the Glasford structure is indeed a buried meteorite crater, with a diameter of about 4 km. Some iteration with Jay Melosh’s crater diameter estimator indicates that the responsible object was likely of order 200 meters in diameter. It would have been an unexceptional asteroid, roughly the size of Itokawa, before delivering its 200-megaton Sunday punch.
Within the Glasford structure, the region of shattered morphology lies under the Galena group of sediments. This permits the age of the buried crater to be pinned down at 450Myr (with an uncertainty of a few million years).
Interestingly, the now-buried Glasford crater is one member of a larger collection of twenty-one known impact structures that have been dated to a roughly 40-million year span that occurred about 450 million years ago. This is much higher than what one would expect from the baseline cratering rate, and it thus serves as strong evidence that Earth was taking an outsize beating during the mid-Ordovician. The leading hypothesis is that the impact shower stemmed from a major collision in the asteroid belt about 470 Myr ago that destroyed the L-chondrite parent body (a large asteroid). Over an extended period following that disaster, some of the collisional debris, which included scores of multi-kilometer wide fragments, evolved onto Earth-crossing orbits and was responsible for the spike in the cratering rate.
A paper that presents a twist on this explanation has received some media action recently, including a write-up in the New York Times. The idea is that a large bolus of the L-chondrite debris, perhaps in the form of a body like the Martian moon Phobos, was tidally captured by the Earth, and then dynamically evolved to form to a ring. Over time, the material in the erstwhile ring, which would have included multi-km objects that were effectively small temporary moons, is imagined to have inclination-damped to equatorial orbits while simultaneously experiencing atmospheric drag and tidal decay which eventually brought it all down to the surface. This is interesting because, if true, the Ordovician impacts would all have been near (if not right on) the equator, which in turn provides an important anchor point for Earth’s paleo-digital elevation models (see this post). But is the ring hypothesis plausible? The Glasford crater looks to every indication like a normal impact scar. Could the structure plausibly be the outcome of an asteroid which came barreling in along the ancient equator from a perilous low-Earth orbit?
In thinking about this, I’ve arrived at the conclusion that a de-orbiting asteroid produces quite a spectacle. As a naive first approximation, let’s assume that the asteroid is a sphere, and is made of that “super tough” material that’s been a recent focus of discussion over at Harvard.
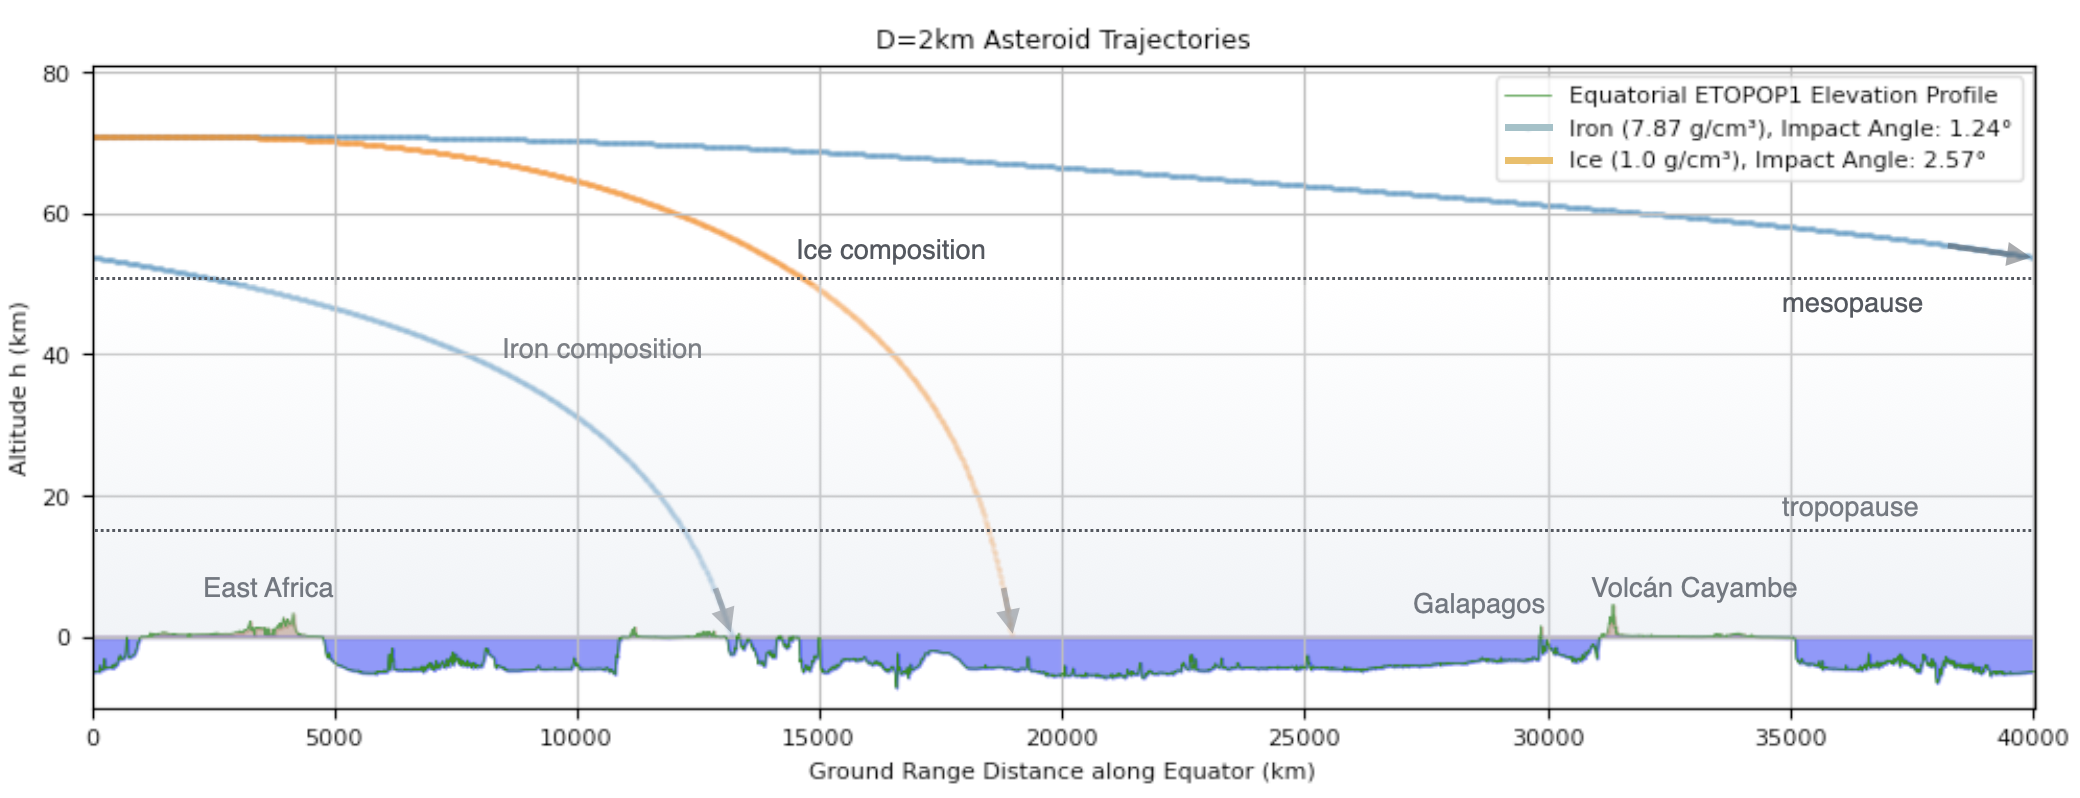
Super-tough asteroids are just that. Tough. They don’t pancake or break up in response to the transverse pressure gradients imparted by atmospheric drag. If we adopt the isothermal approximation to Earth’s atmosphere, and an iron super-tough composition, we can calculate that when the asteroid has lowered its circular orbit to 71 km altitude (in the middle of the mesosphere), the acceleration from atmospheric drag is one ten-thousandth of the gravitational acceleration. We can then integrate the trajectory, assuming that gravity and drag are the only forces acting. The integration indicates that a 2-km iron asteroid makes roughly 1 1/3 full trips around Earth before reaching sea level with a velocity of 7.43 km/sec (close to its original orbital velocity). When the asteroid reaches the surface in the super-tough approximation, it’s effectively in an e=0.01orbit, and it impacts with an angle of slightly more than 1.24 degrees. Here’s the trajectory over the current-day elevation profile for the equator. Ironically, the impact point here is very close to the the site of a recent expedition. (No further comment on that).
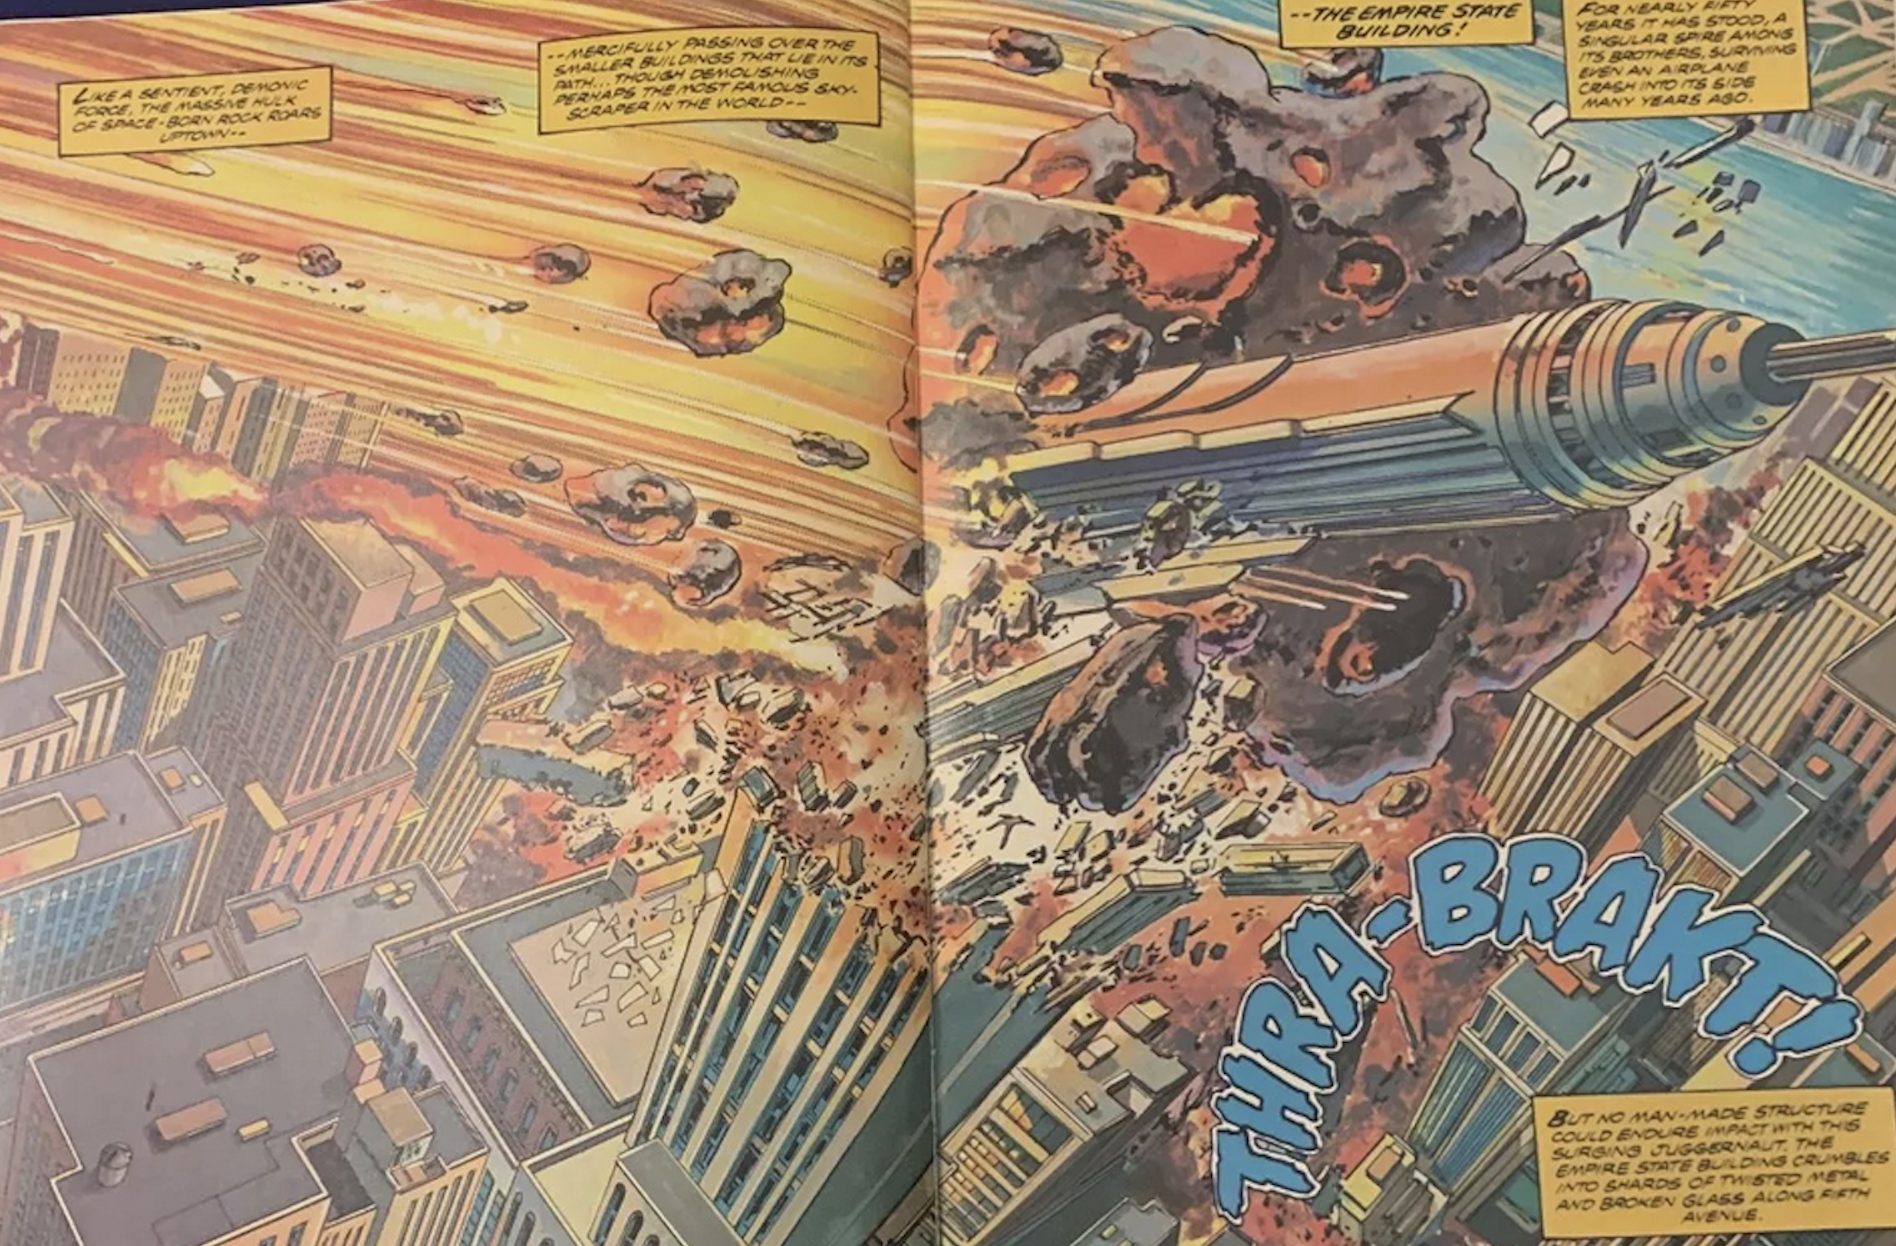
I never saw the 1979-vintage disaster movie, Meteor, but I did read the comic book, which left quite an impression, especially this two-page spread, where a ~50-meter wide fragment of an asteroid rampages through Midtown at an extremely oblique angle.
The impactor’s behavior in the comic book, in particular its remarkable lack of a hypersonic shock wave, brings to mind the earnest freshman honors-level calculations for UFOs published by Knuth, Powell & Reali (2019), e.g.
“… The UAP was estimated to be approximately the same size as an F/A-18 Super Hornet, which has a weight of about 32000 lbs, corresponding to 14550 kg. Since we want a minimal power estimate, we took the acceleration as 5370 g and assumed that the UAP had a mass of 1000 kg. The UAP would have then reached a maximum speed of about 46000 mph during the descent, or 60 times the speed of sound…”
What really happens when a mountain-sized asteroid comes skimming horizontally with orbital velocity? It doesn’t sound like a fun experience. I’ve looked through the literature, and have not been able to source modern simulations of impacts that have obliquities of order on degree, where topography matters. This seems like a good computational project for the iSALE-3D code. Stay tuned…
I wanted to break the current two-month oklo drought with an anecdote along the lines of, “in one of his later interviews, William S. Burroughs wondered where all the interest in space aliens is coming from, when, in the form of insects, we’ve got remarkable aliens right here.”
The piece that I was thinking of seems to be this 1992 item from Esquire Magazine, which features both WSB and David Cronenberg, and the observation is from Cronenberg rather than Burroughs. The article itself looks like it was a promo-tour throw-away associated with the big-screen adaption of Naked Lunch. It’s cringy and dated to read it 32 years on. Indeed, Burroughs’ later years in Lawrence Kansas were filled with cheesy interactions with pop-alternative figures that didn’t age well. Cue Al Jourgensen.
The insects-vs-aliens riff is readily repurposed with transformers. Why bother with those alien-channeling TED talkers and megastructures orbiting Kepler stars when attention is all you need?
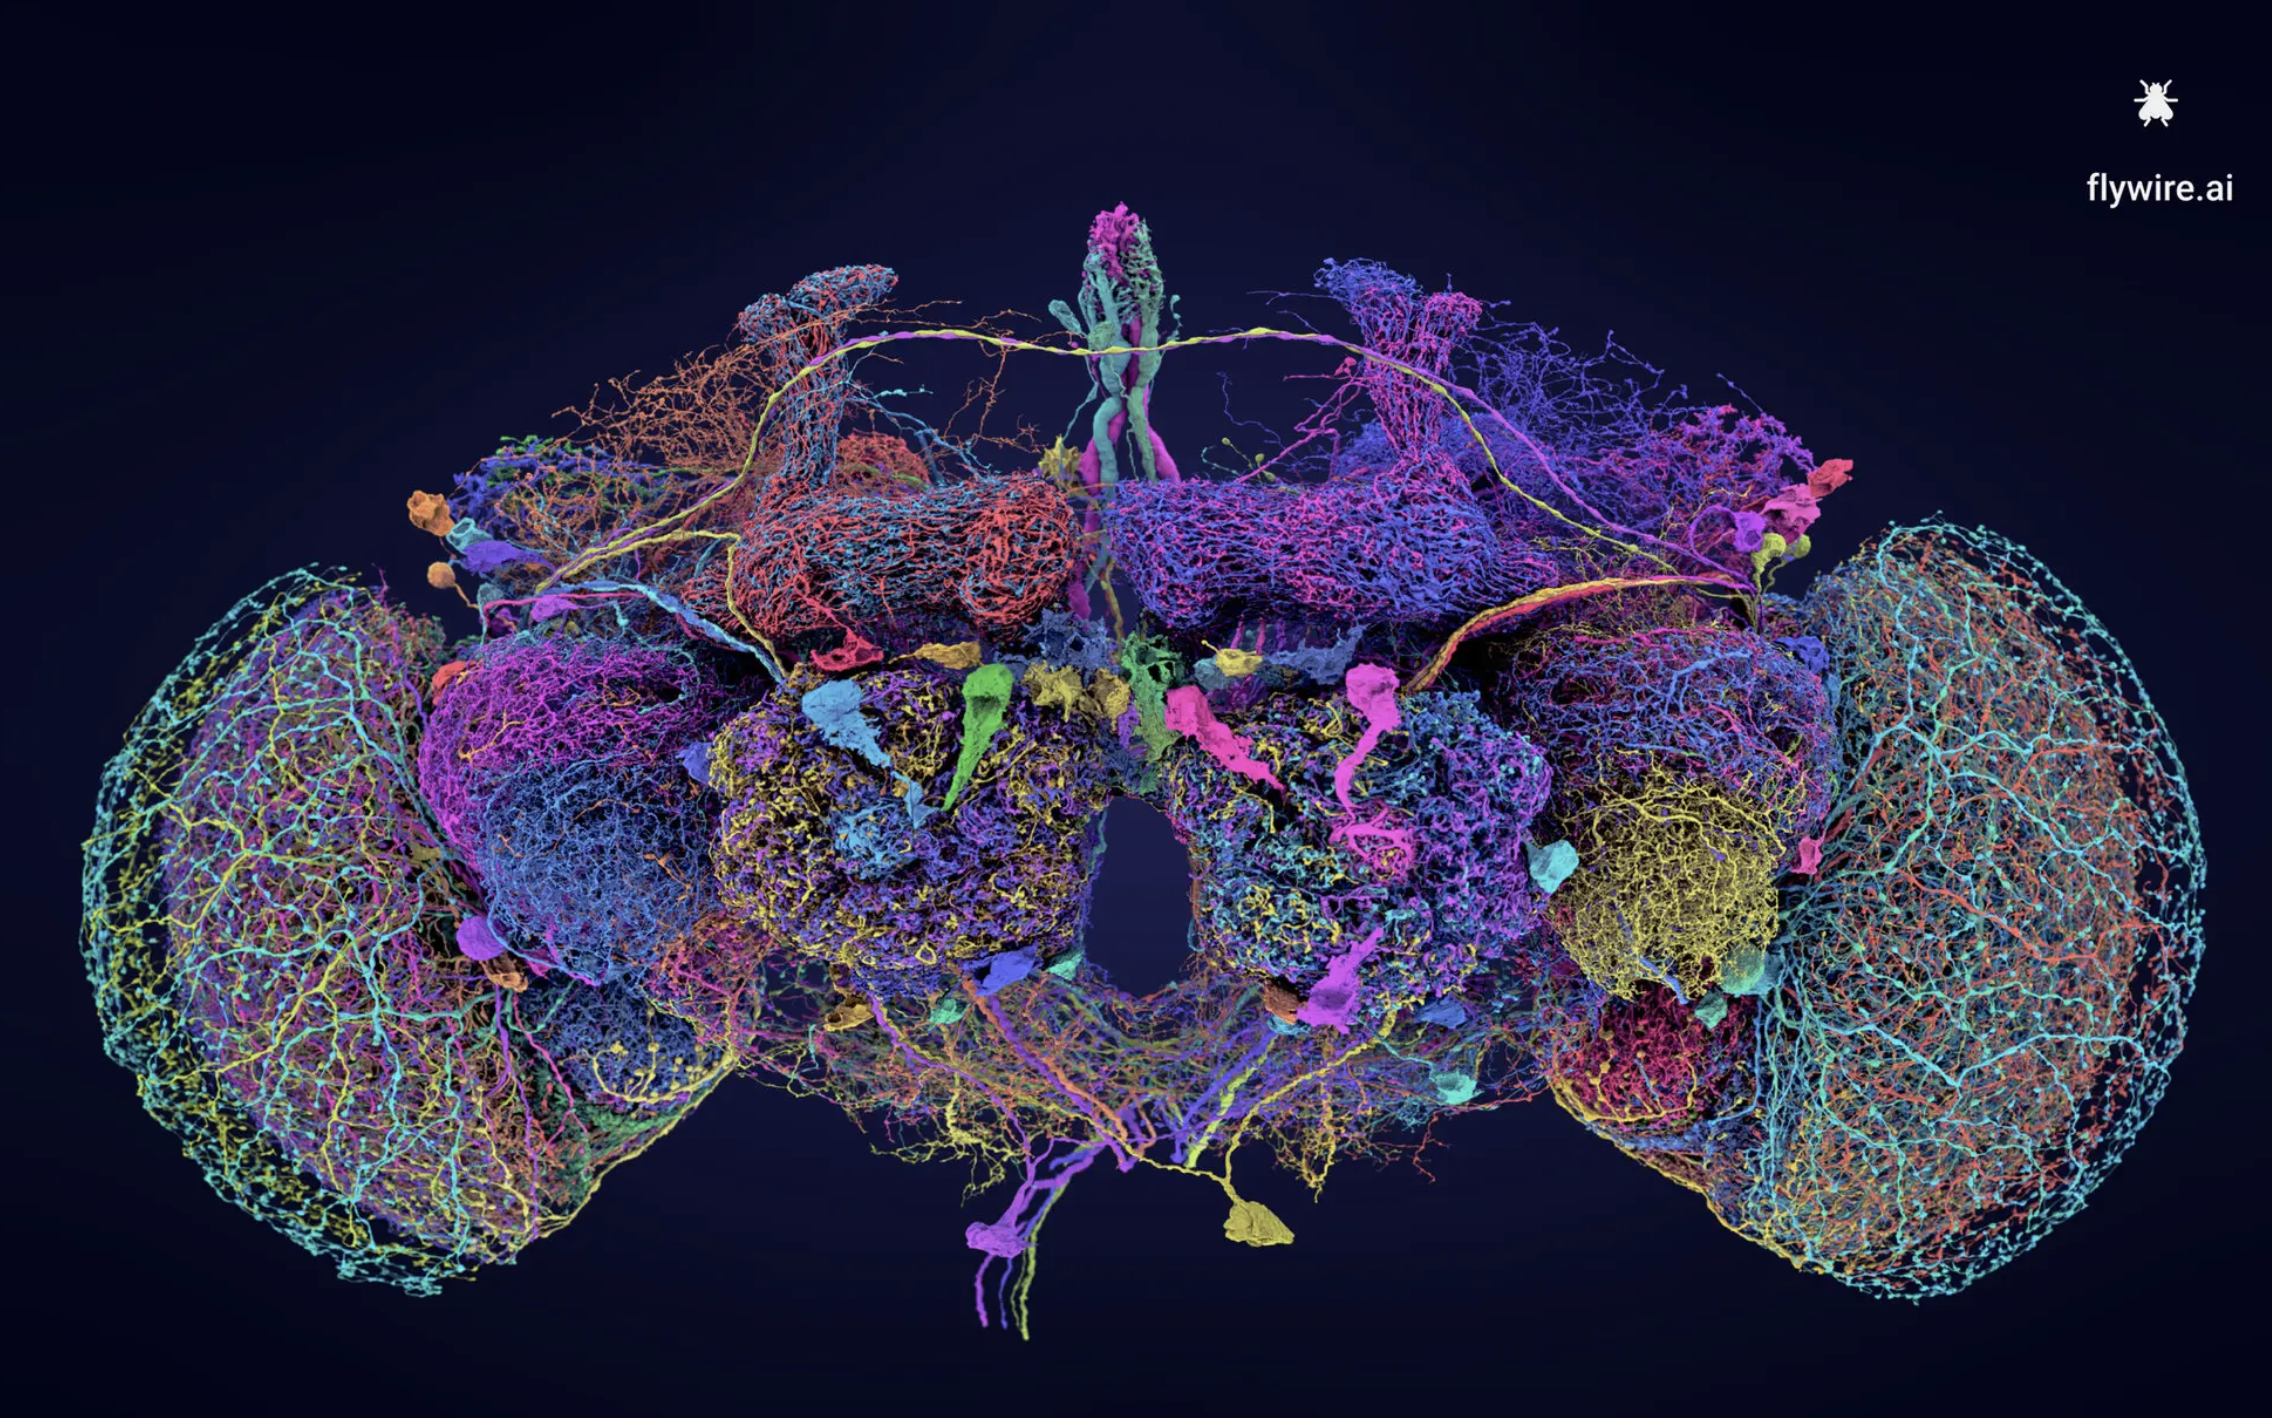
Readers likely attended to that press surrounding a new set of papers in Nature centered around a near-complete mapping of the fruit fly brain at the level of individual neurons and synapses. The visualizations are eye-catching:
As a rule, I’m consistently trying avoid veering into “explainer podcast” territory, and moreover, I’m out of my depth when it comes to connectomes. I do want to remark that it’s a real help to have GPT-4 by one’s side as one works through a paper in an unfamiliar field.
There is a school of thought that resists the brain-as-computer analogy. A quick glance over Descartes’ theories of the cognitive mechanism certainly supports such skepticism. And for sure, a network of neurons is not a neural network. But I like pushing analogies beyond their elastic limit. There’s a certain asocial pleasure in constructing sweeping order-of-magnitude estimates when one is safely sheltered from the ravages of peer review.
The fruit fly brain contains 10^5 neurons and 10^8 connections. Order of magnitude, this feels like it lies somewhere in the vicinity of GPT-2, which requires a fleet of 2019-era GPUs to train, and of order 300 billion floating-point operations to fully process a 1000-token sequence through a 100-million-parameter trained model in one forward pass (fully fresh context, so no KV-cache).
Cursory research indicates that a fruit fly burns about one calorie (the 4.2 J variety, not the 4,200 J variety) per day. Its brain volume to body volume ratio is 0.03%. Assuming a constant metabolic rate throughout the fly (which seems conservative, given the rigors of flight assigned to the wing muscles) the fly’s brain consumes 0.1 erg/sec. Assuming 32-bit operations per low-resolution FLOP, this suggests that if the fly brain computes at the Landauer limit, it is running at a computational equivalent of ~200 billion floating point operations per second.
It’s remarkable how we just swat them away as they dart drone-like above the left-out fruit.
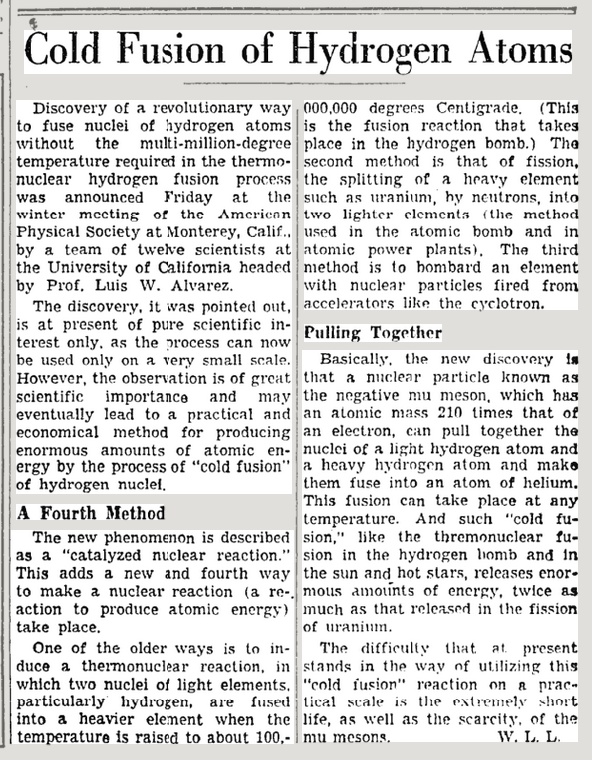
Cold fusion of that late-80s Fleischmann-Pons electrochemical variety has long since been given over to cranks, but the term itself dates to a 1956 New York Times article describing the then-newly discovered phenomenon of muon-catalyzed fusion.
Oklo readers will recall that the muon is a negatively charged lepton with mass 105.66 MeV/c² (~200x that of the electron). On average, a muon lasts 2.2 microseconds before decaying into an electron and a neutrino via the weak interaction.
During its ephemeral lifespan, a muon can replace one of the electrons in a hydrogen molecule (generally of the exotic deuterium-tritium variety) allowing the two nuclei to draw far closer than the normal covalent bond would allow. With proximity thus achieved, the probability of deuterium-tritium fusion is greatly increased. After a fusion reaction occurs, the responsible muon is free to catalyze further events until it either decays or is removed from the action by “sticking” to an alpha particle produced by the fusion. Economic viability of the process for creating energy would require that a single muon catalyze hundreds of fusion events before it decays, a rate of efficiency that exceeds best efforts by at least a factor of two or three.
Muon-catalyzed fusion was originally observed in laboratory experiments and described in this article by Luis Alvarez et al., and was studied in depth by John David Jackson, he of Jackson’s Electrodynamics fame. Jackson’s 1957 Physical Review article is a standard reference, and remarkably, more than half a century later, he summarized the history of the field in this 2010 review.
The prospects for muon-catalyzed fusion as an energy source seemed moderately bright during the 1980s and 1990s, following the elucidation and observation of molecular states of the deuterium-tritium-muon positive ion. But then the field seemed to stall out around the turn of the millennium, as workable schemes for either producing the muons more cheaply, or improving their catalytic efficiency failed to emerge.
At the close of the 2010 article, however, Jackson sounded optimistic, writing, “The effort for such a specialized field has been prodigious, especially in the last 30 years. On the applied side, ideas continue on how to increase the number of fusions per muon and design hybrid systems to get into the realm of net energy production.”
Given all that talk these days surrounding training and inference costs, it’s fair to state that development of a scheme to get into that realm of net energy production would be quite an unexpected something.
Back in 2017, we were trying to keep the Metaculus website afloat, and we were scrambling to write questions faster than they were being resolved. For an all-best-intentions span of about a week or so, I stuck to a regime of producing a question per day, while simultaneously trying to keep them high-tone and novel. On August 28th, I managed to keep that streak going with a question on muon-catalyzed fusion, asking:
Prior to Jan 1, 2020, will a peer-reviewed article appear in the mainstream physics literature which discusses a discovery of a physical phenomenon or which outlines an engineering technique that can either (1) increase the number of deuterium-tritium fusions per muon, or (2) decrease the energy cost of muon production to the point where a break-even reactor is feasible?
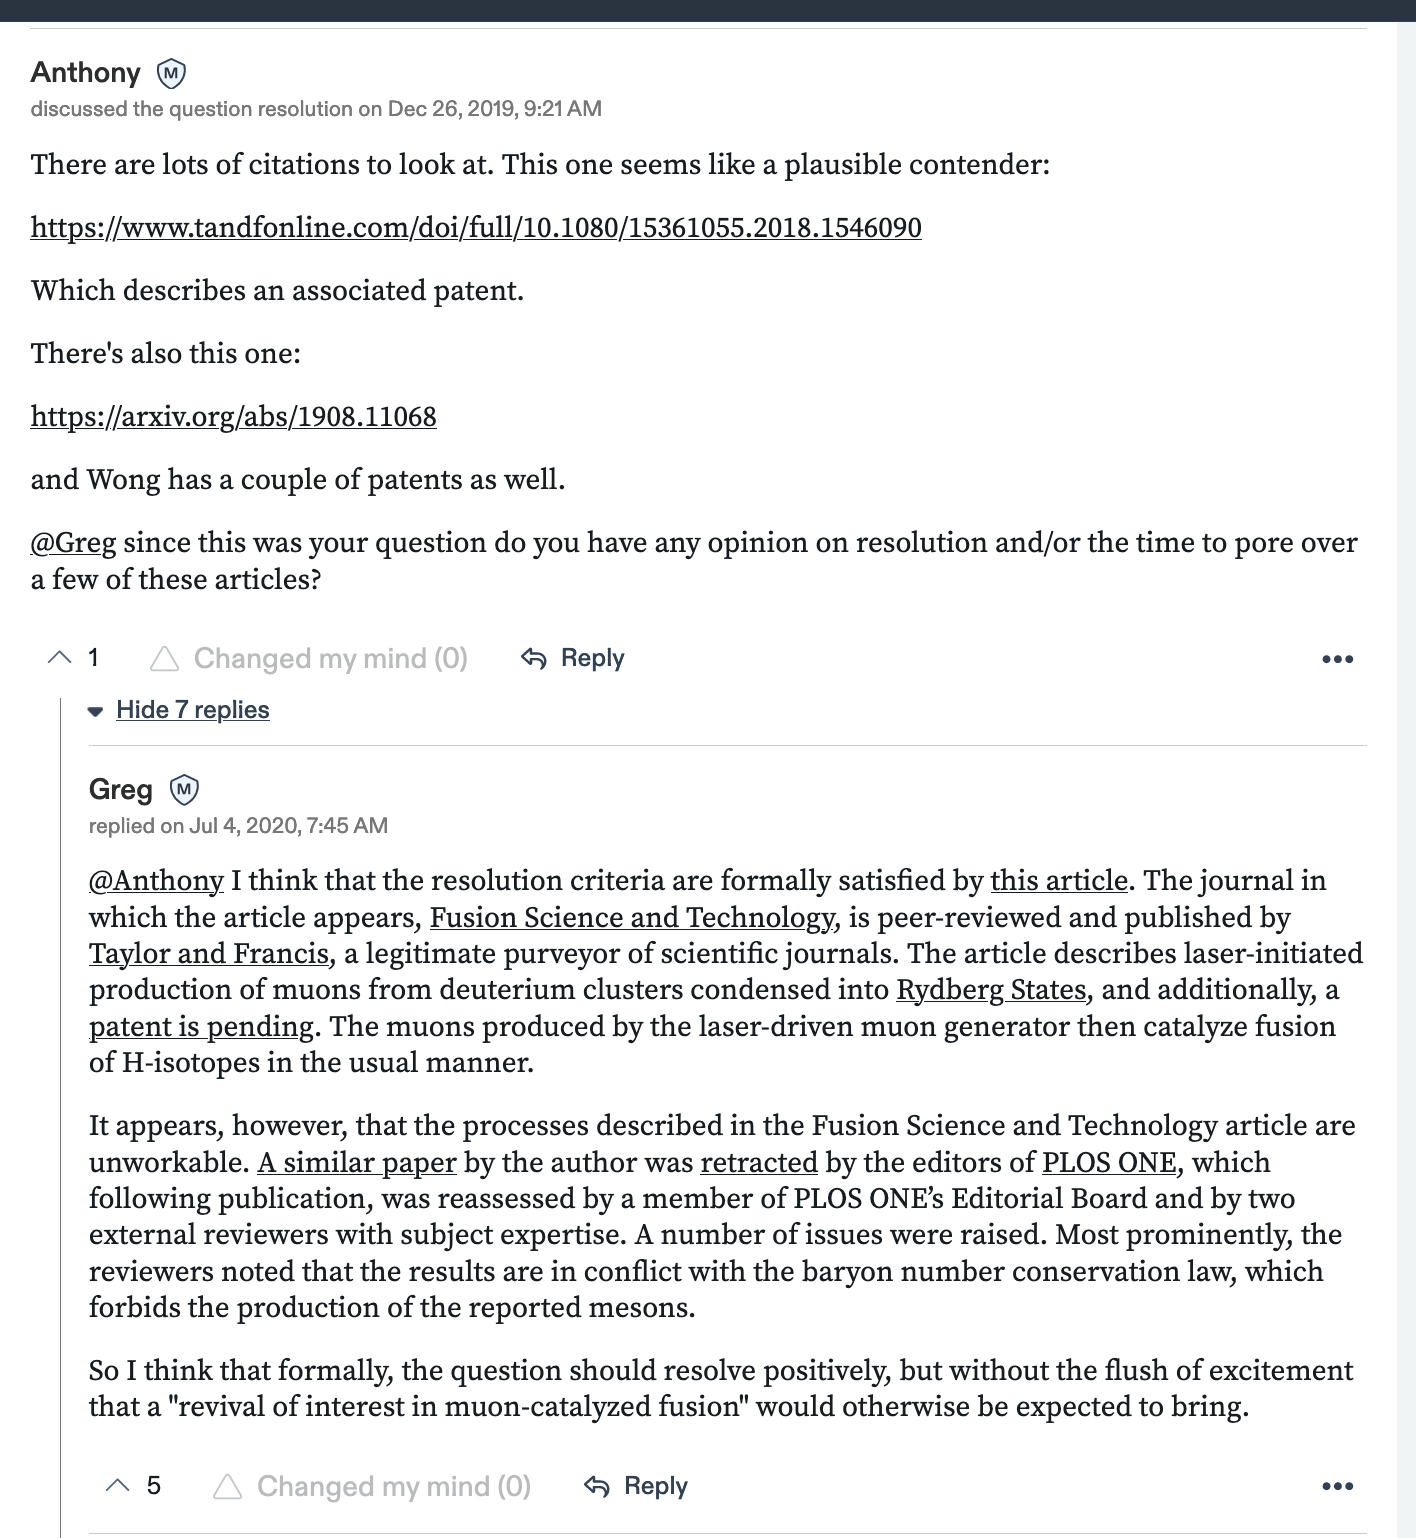
Soon enough, the resolution date was imminent, and so Anthony had a look at the literature, which prompted a prompt lapse of reply on my part followed by a very belated assessment:
We decided to resolve the question positively, using what was essentially lawyerly splitting-hairs logic that proved very unpopular with the Metaculus crowd. I think that was the end of my career as a question-resolver.
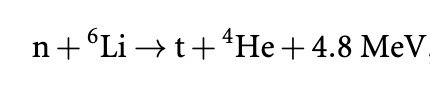
The muons periodically come to mind, however, which prompts me to have a cursory look to see whether anything has happened. This morning, I came across this 2021 J. Phys. Energy article by Kelly, Hart and Rose, which gives a practical assessment of the (relatively) up-to-date prospects for getting muon-catalyzed fusion to work. They point to an important engineering hack that can improve efficiency — one surrounds the reaction chamber with a lead-lithium blanket that absorbs the neutrons from the fusion reactions to induce the formation of tritium, helium and heat via:
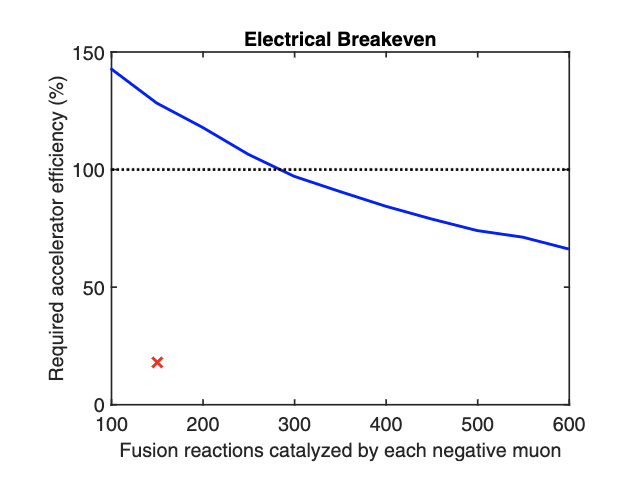
The extra heat boosts the energy output per fusion reaction from 17.6 MeV to 26 MeV. After working through various practicalities, they close with a simple daunting graph:
The red x marks the spot where things currently stand. If that red x can somehow be pushed up above the blue line, then muon-catalyzed fusion is a go…
The “outreach” messaging sometimes ends up reaching in to influence the way astronomical phenomena are interpreted by the astronomers themselves.
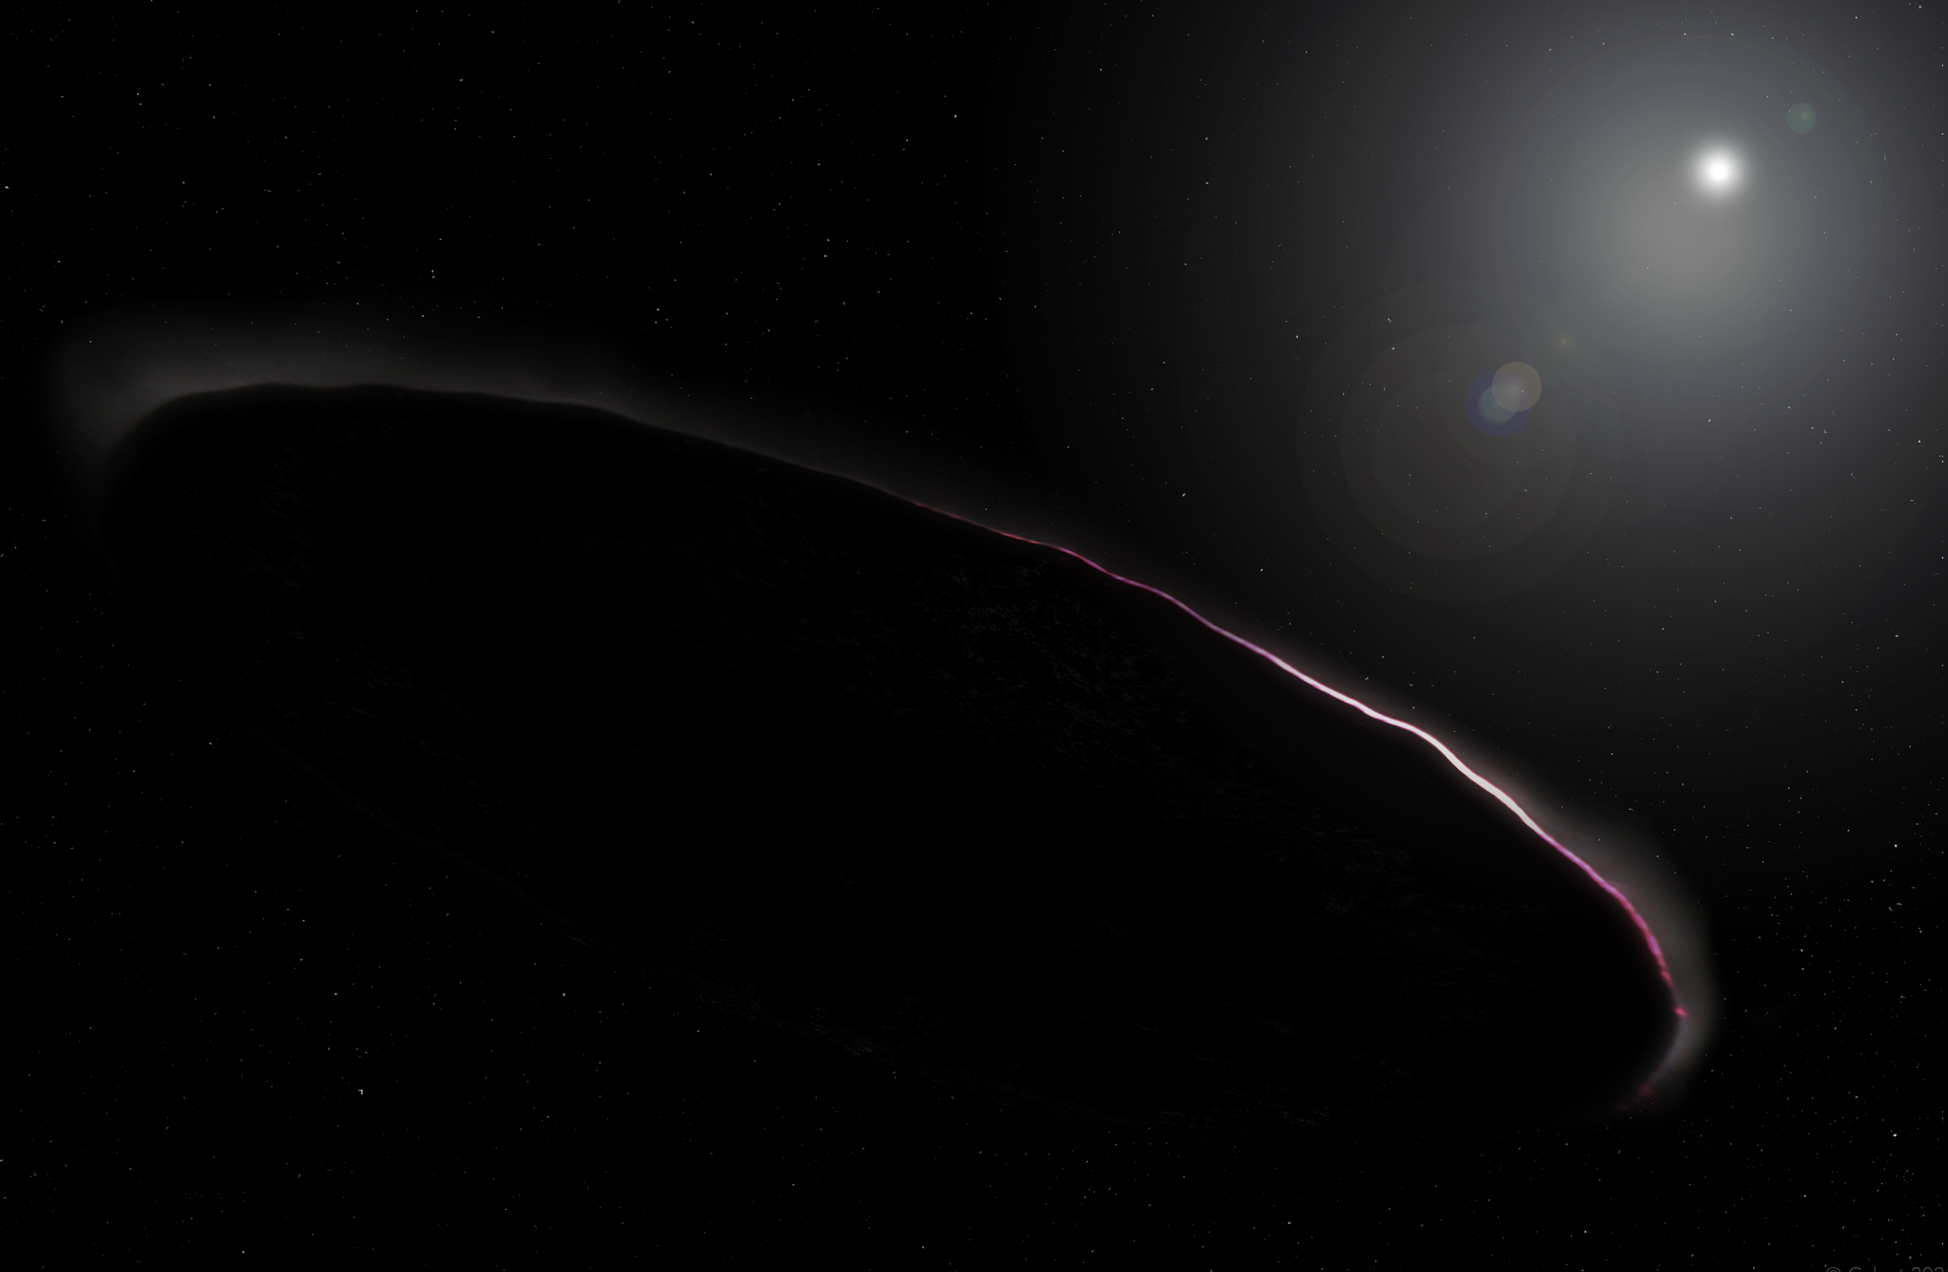
Take ‘Oumuamua as an example. The sinister starship of the Kornmesser diagram, along with the tie-in to Rendezvous with Rama revived more than one flagging career (present company included). I don’t think there would have been quite the same excitement had the flying hamburger illo been the first entry out of the PR gate.
Is it possible to get ‘Oumuamua right? Can one at once preserve the mystery, spur the inspiration and adhere responsibly to the scant groundings in actual fact?
I think that Sam Cabot’s version at the top of this post threads that needle admirably. Expert work with Photoshop warps his own photograph of 2017 totality into a looming occultation, sublimating the unknown and supporting 91:9 odds of 6:6:1 over 8:1:1.
Doomscrollers almost certainly noticed the recent articles in both the New York Times and the Wall Street Journal describing recent scientific work with connections to Mayan human sacrifice.
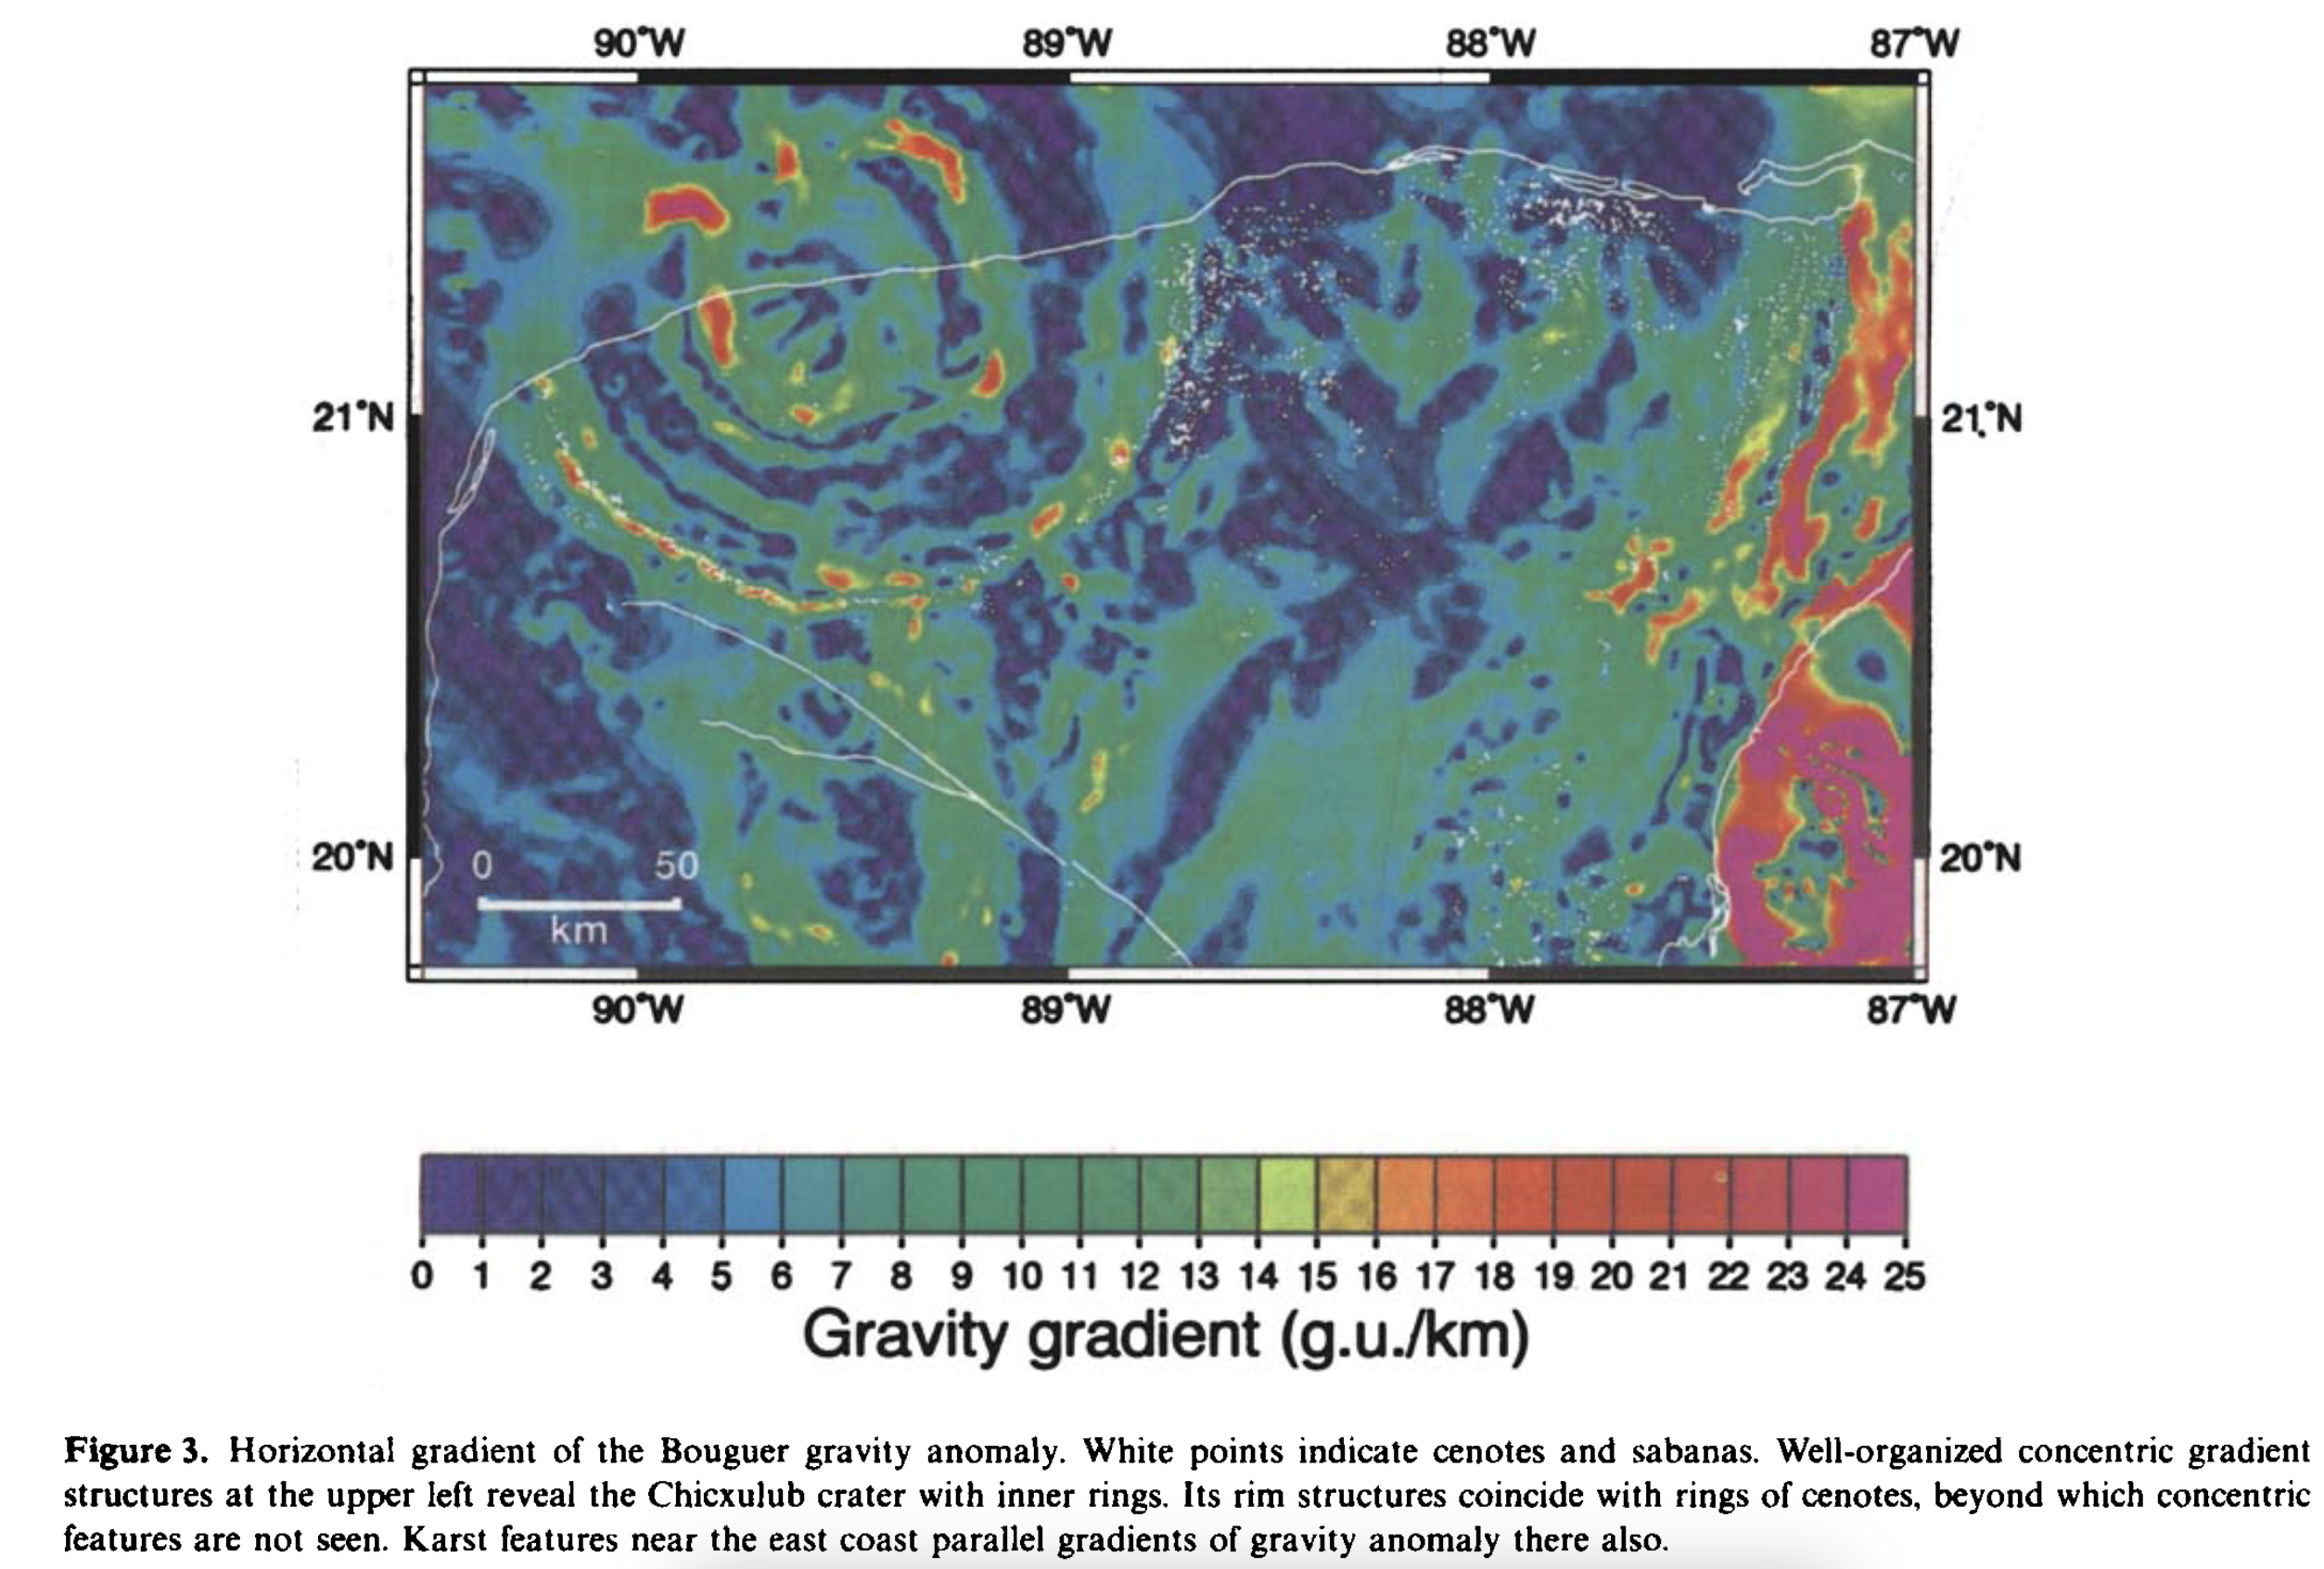
Among the various unsavory techniques that the Mayans applied in the service of appeasement of the gods, unfortunates were thrown into the cenotes, the flooded limestone sinkholes that puncture the limestone karst topography of the Yucatán. These are portals — as a manner of speaking — to the subterranean geophysical realms.
Remarkably, the Yucatecan cenotes cluster in at least two arcs that trace the rings of the Chicxulub crater. The exact geological cause of this clustering remains imperfectly understood. The faulted deep-Earth structures imparted by the impact evidently still influence groundwater flows in a manner which encouraged the geologically recent formation of the solution caverns that give rise to the cenotes. This oblique connection to the ancient catastrophe is analogous, perhaps, to the myriad evolutionary consequences of the K-T event that still ripple through the biosphere. The vast and sweeping narrative of destruction and rebirth seems a fit, somehow, with the sensibilities inherent in the Mayan cosmogony.
The highest-order cycle of the mesoamerican Long Count is the alautun, which comprises a staggering 23,040,000,000 days. Accounting for the fact that Earth’s rotation has been tidally despinning at a rate of ~2.4 milliseconds per century, the alautun projects 62 million years into the past, a span that seems somehow satisfyingly proximate to the 66.043 million years since the impact.
That ever-shifting fungibility between dollars, bit operations, and ergs has been a recurring theme here at oklo dot org for over a decade now — I think this was the first article on the topic, complete with a now-quaint, but then-breathless report of a Top-500 chart-topper capable of eking out 33.8 petaflop/s while drawing 17,808 kW. A single instance of Nvidia’s dope new B200 chip can churn out 20 petaflops (admittedly at grainy FP4 resolution) while drawing 1kW. “Amazing what they can do these days”.
Despite the efficiency gains, the sheer number of GPUs being manufactured is driving computational energy usage through the roof. There was a front-page article yesterday in the WSJ about deal-making surrounding nuclear-powered data centers. Straightforward extrapolations point toward Earth’s entire insolation budget being consumed within decades in the service of flipping bits. It thus seems likely that a lot will hinge on getting reversible computing to work at scale if there’s going to be economic growth on timescales beyond one to two decades.
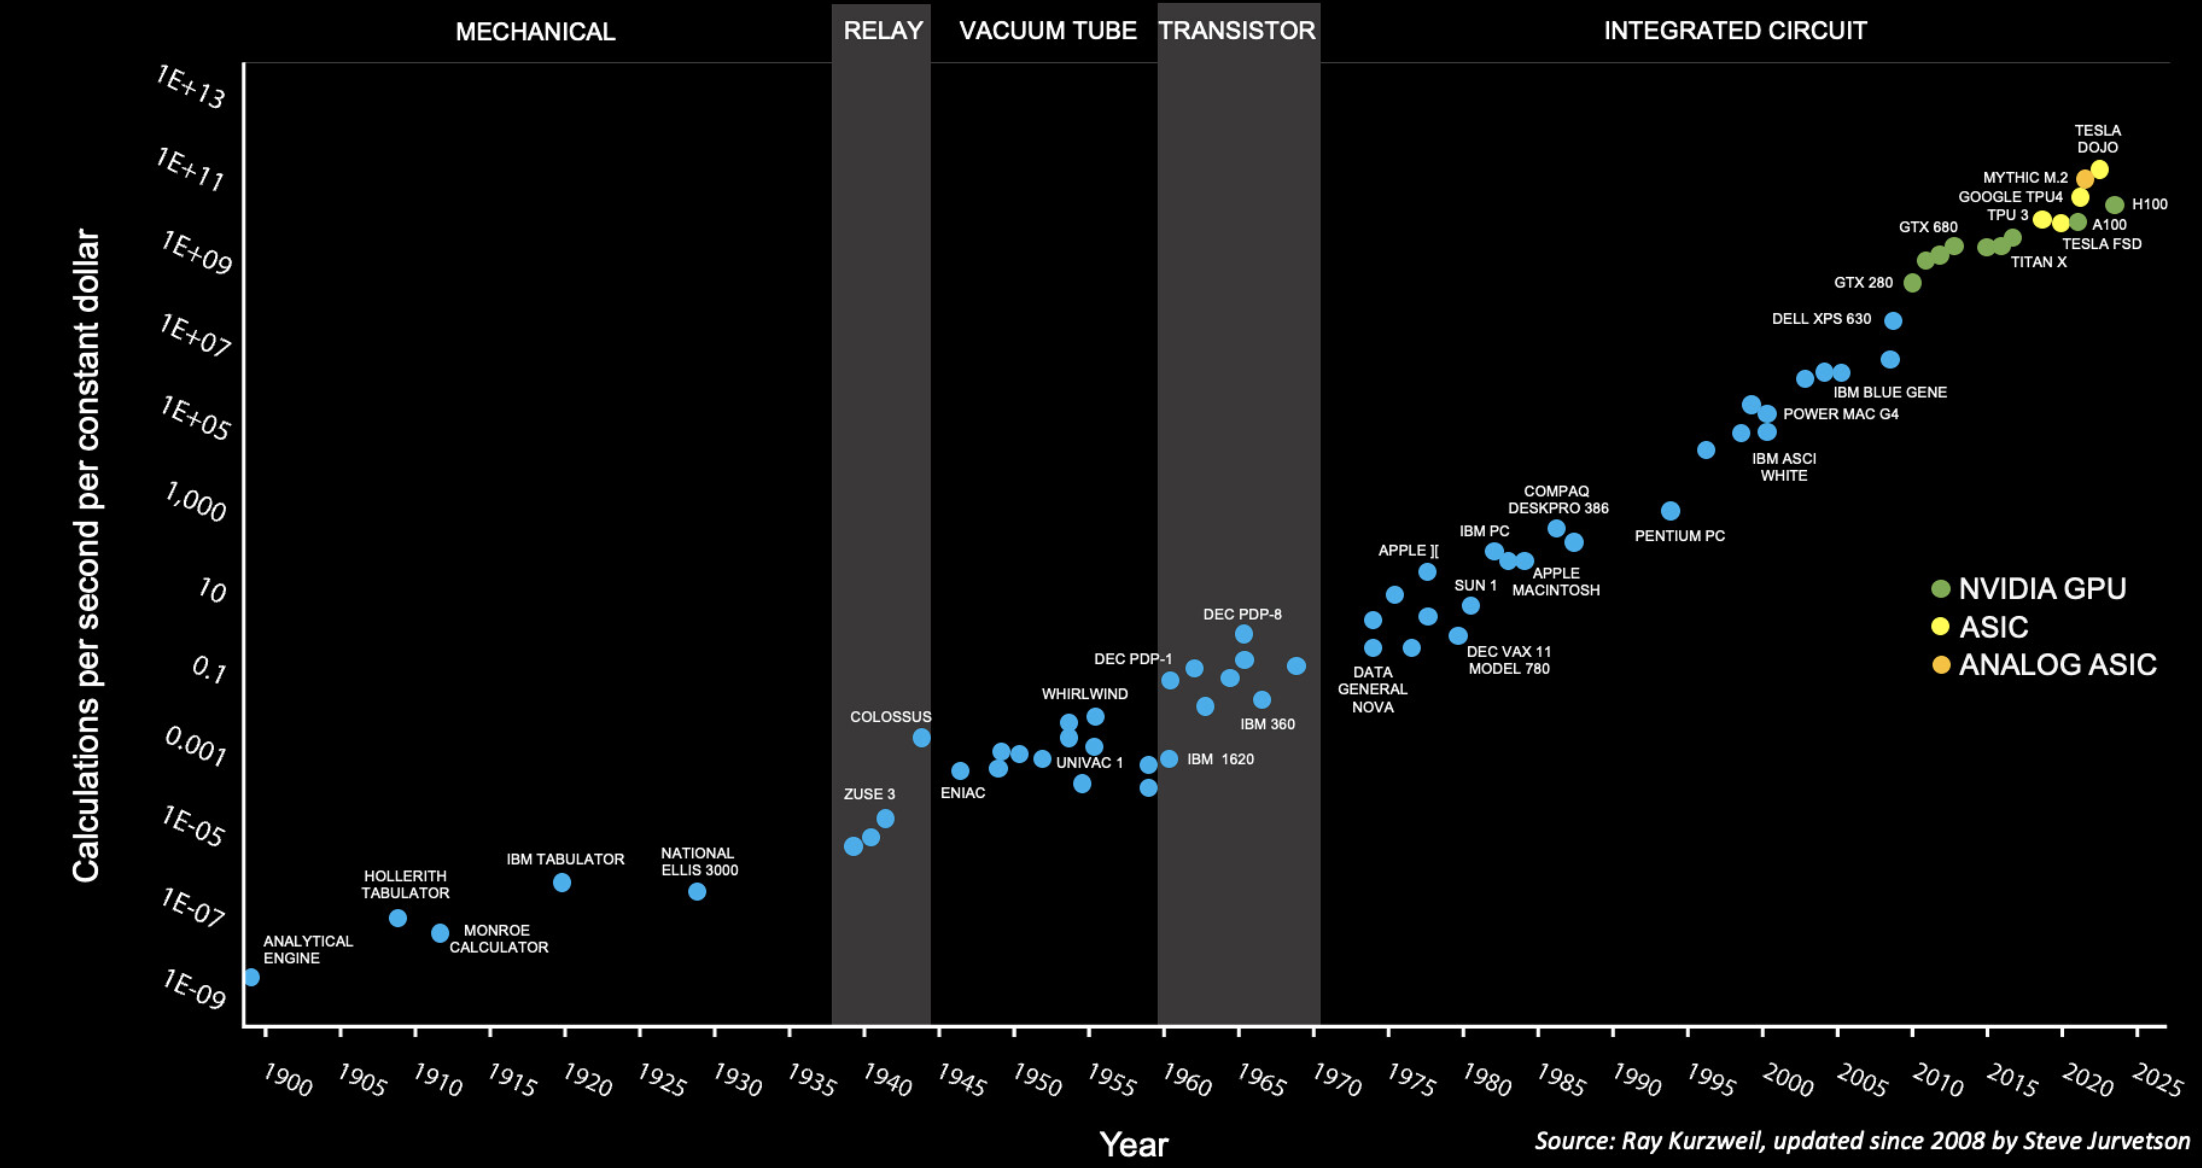
The Kurzweil-Jurvetson chart (copied just below) shows how computational cost efficiency is characterized by a double exponential trend. The Bitter Lesson, however, indicates that the really interesting breakthroughs hinge on massive computation. The result is that energy use outstrips the efficiency gains that themselves proceed at a pace of order a thousand-fold (or more) per decade. MSFT, NVDA, AAPL, AMZN, META, and GOOG are now the top-ranked firms by market capitalization.
This year, META (as an example) is operating 600,000 H100 equivalents in its data centers. Assuming a $40K cost for each one, that’s a $24B investment. Say the replacement life for this hardware is 3 years. That’s an $8B yearly cost. Assume 10 cents/kWh for electricity. META’s power bill is of order $60K/hour, or $0.5B/yr. Power is thus about 6% of the computational cost. The graph above doesn’t take the power bill explicitly into account because it hasn’t yet been material.
Nvidia’s H100s will be ceding their spots to the B200s and their equivalents over the coming year. Competition from AMD, Intel, et al. will likely keep META’s hardware cost roughly constant year-on-year, and their total number of bit operations will increase in accordance with the curve that runs through the points on the graph. The B200s, however, draw 40% more power. At the rate things are going, it will thus take about eight years for power costs to exceed hardware costs to run computation at scale.
This dense deck from Sandia National Laboratory seems like an interesting point of departure to start getting up to speed on reversible computing.
A hypothesis which posits a linear sequence of events rarely works in the real world. Nonetheless, we took a crack at just such a simplistic shopping-list sequence:
Venus had water oceans, an atmospheric pressure of order a bar, and plate tectonics.
Steadily increasing solar luminosity drove a runaway moist greenhouse.
Rapid erosion occurred as the oceans were being lost.
Erosion ceased and plate tectonics shifted to stagnant lid volcanism.
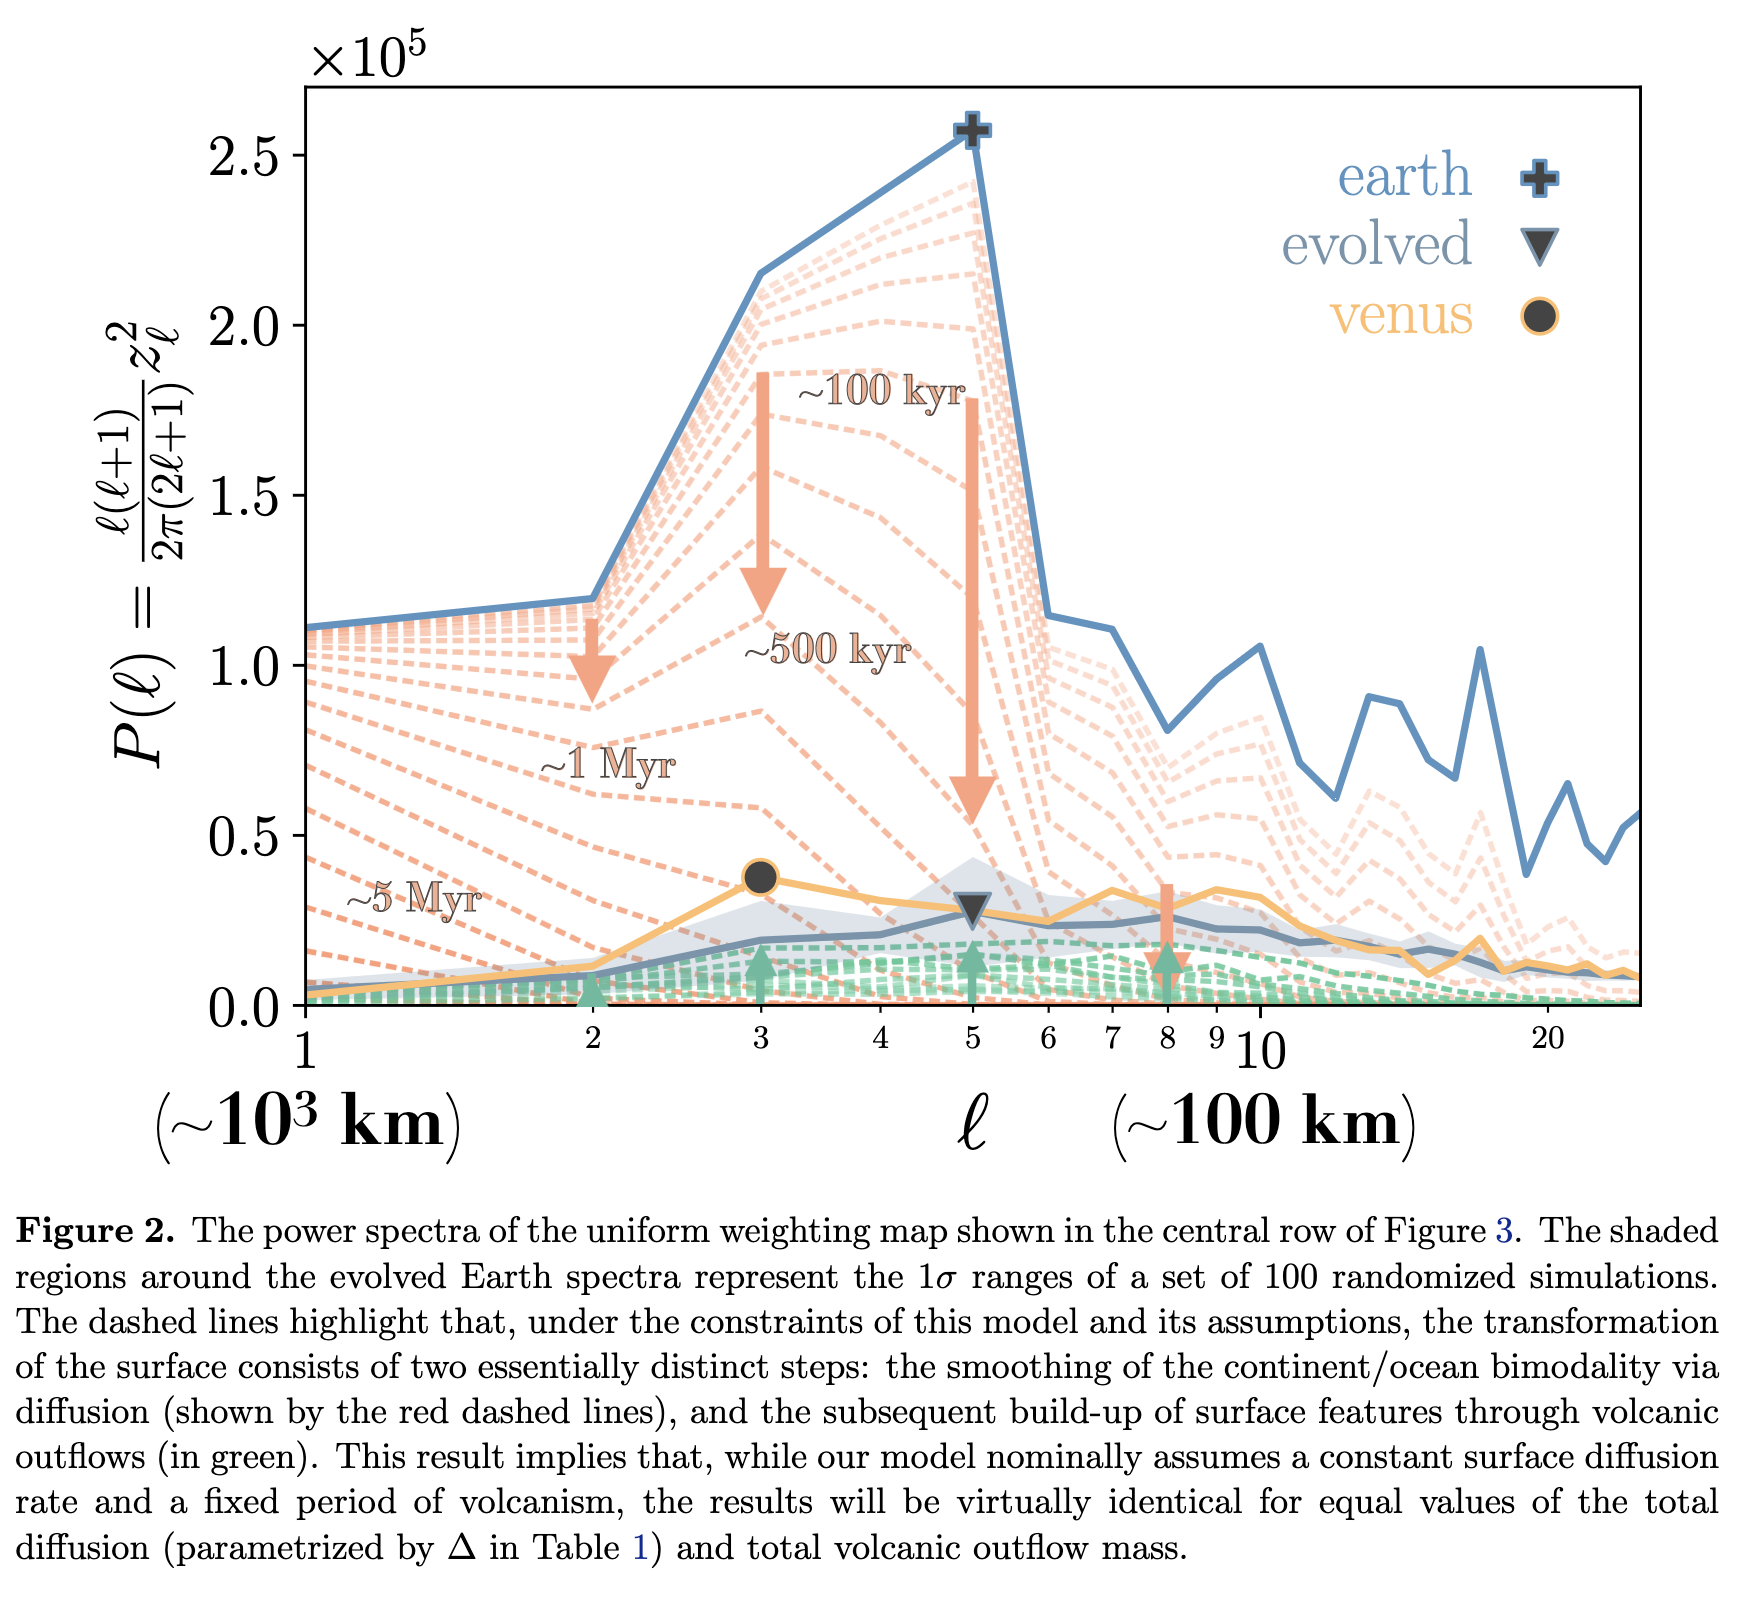
It’s straightforward to irresponsibly tweak a model that draws on those four events to turn the Earth’s topographical power spectrum into one that channels modern-day Venus. Rapid erosion pretty much flattens the planet out entirely in the absence of tectonic uplift. Then static-lid emplacement of igneous provinces at a pace of order a cubic kilometer per year builds the spectrum back up to what we see today. And a cherry on top: assume that the lava production rate for Venus is the same as for Earth. This means that Venus was habitable up to about 500 Myr ago, that is, up to around around the same time as the Cambrian Explosion. Intoxicating stuff.
Understandably, this modeling approach got a lot of static from the referee. There are potential problems with all of points one through four above, and more generally, we attacked the problem from the standpoint of shocking naivete. It’s a shoot first, ask questions later mentality applied to the scientific enterprise. Submit first, read the literature later.
I do think there’s something to be said for the quick-draw approach, though. Mötley Crüe recorded Too Fast For Love in a couple of days on a budget where packs of Marlboros were material. Then, less than a decade on, it took them something like year to finish Dr. Feelgood at enormous expense. The point is, there’s a risk of getting bogged down if one strives for dissertation defense level completism.
Also, did I mention that I’m a fan of the GPT architecture?
At any rate, on point three of our four-point plan, we got the following criticism from the referee: The authors seem unaware that erosion of broad continents is slow. We still have 55 million year old Laramide topography in Colorado. See old paper by Clem Chase.
I was indeed unaware of that. The sediment load of the Mississippi River is 500 million metric tons per year. That corresponds to a removal of 0.25 cubic kilometers of rock per year. The Mississippi’s watershed is 3.2 million square kilometers (and includes Colorado). In the absence of uplift, North America’s topography is sanding down at a rate of a kilometer (3280 feet) per 12.8 million years. That makes the presence of the Flatirons outside of Boulder indeed something of a puzzle…
According to the Wikipedia, “Whataboutism or whataboutery (as in “what about…?”) is a pejorative for the strategy of responding to an accusation with a counter-accusation instead of a defense against the original accusation.”
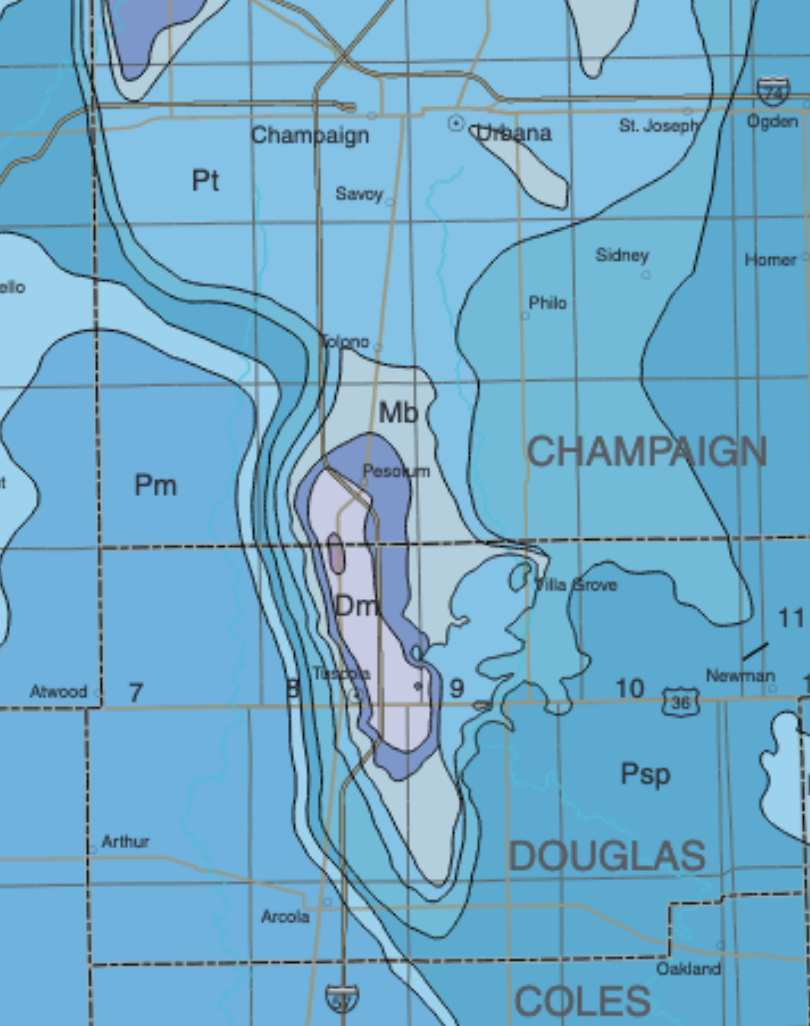
So what about that strange geological feature on the border of Champaign and Douglas counties in East-Central Illinois?
The tiny cornfield-sized purple ellipse in the center of the bedrock map corresponds to the Silurian Moccasin Springs formation which consists of 420-million year old reefs. Moving out from the bulls-eye core, are bedrock rims of middle Devonian rocks, the New Albany Shale, the Borden Siltstone, the Tradewater Formation, the Carbondale Formation, the Shelburn Patoka Formation, the Bond Formation, and finally several miles to the east, the 296-million year old rocks of the Mattoon Formation. At some point in the past 296 million years, something pushed the Silurian rocks upward by roughly 2000 feet. From a bedrock perspective, the severity of the uplift is similar to what one finds on Baseline Road in Boulder Colorado, which provides a good view of that Laramide topography mentioned by our referee:
The sandstone rocks of the Fountain Formation that make up the Flatirons are, coincidentally, also 296 million years old. They were deposited in alluvial fans at the same time as shallow water sediments were piling up to create the Mattoon formation.
Dropping into Champaign County Road 100 North, at the point where the age gradient of the bedrock reaches its maximum, reveals an absolutely flat landscape. Zero hint of the weird stratigraphy that lurks just beneath the 12,000-year-old veneer of Wisconsin glacial till.
So what’s going on? Why does Boulder CO sport rugged peaks whereas Champaign IL is completely flat? Is the Fountain Formation more resistant to weathering? Is the older tectonic age of the “Champaign Uplift” responsible for its complete surface obliteration? Or something else?
Granted, I don’t yet know enough about geology to be certain, but as far as I can tell, there’s no literature out there that specifically investigates the Champaign Uplift. I’m going to turn on comments for this post in the hope that someone might know something. Clearly, the uplift, or more properly, the anticline, is associated with the La Salle Anticlinorum, and is a small localized region where the local folding was very pronounced. Could it be of similar province to the mysterious Hicks Dome further south in Illinois?
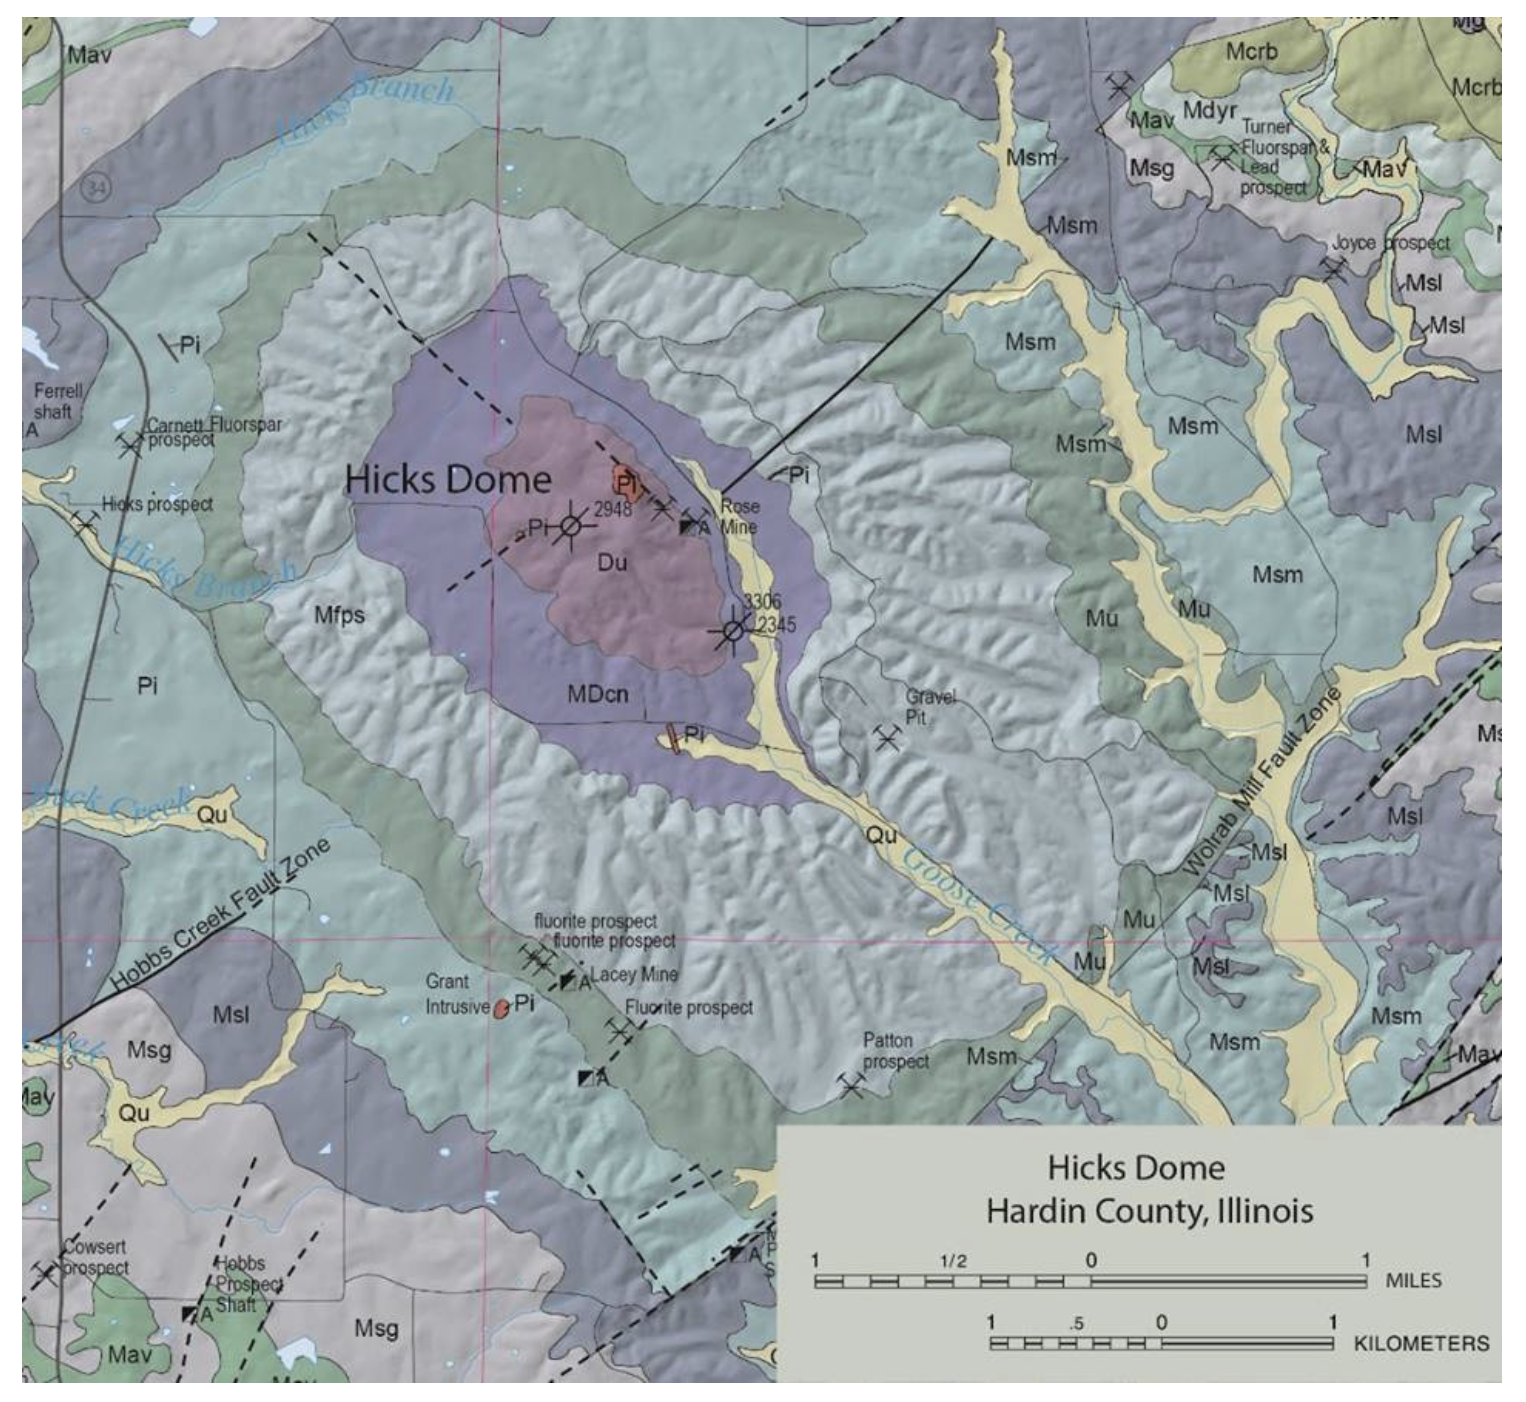
A description of Hicks Dome reads very much like a description of the Champaign Uplift:
“The dome is about 10 miles in diameter, and rocks at its apex are uplifted 4,000 feet. Middle Devonian rocks at the center are surrounded concentrically by younger rocks out to Pennsylvanian on the rim.”
At Hicks Dome, the source of the uplift was an igneous intrusion that pushed its way up 260 million years ago:
“In 1952, St. Joseph Lead Company drilled a well on the apex of Hicks Dome in Hardin County, Illinois, primarily to explore for oil or gas, and with the objective of testing the St. Peter sand horizon, which had not been reached in a previous well on the flank of the dome. A normal sequence of formations was encountered down to 1,600 feet, but at about that depth the drill entered a confused brecciated zone, which persisted to the bottom of the hole at 2,944 feet. This is interpreted as one of the explosion type breccias, or diatremes, common in this Illinois-Kentucky area, as well as in nearby Missouri. A correlation of formations between this and the earlier Fricker well is presented. It is suggested that Hicks Dome is an incipient or uncompleted cryptovolcanic structure.”
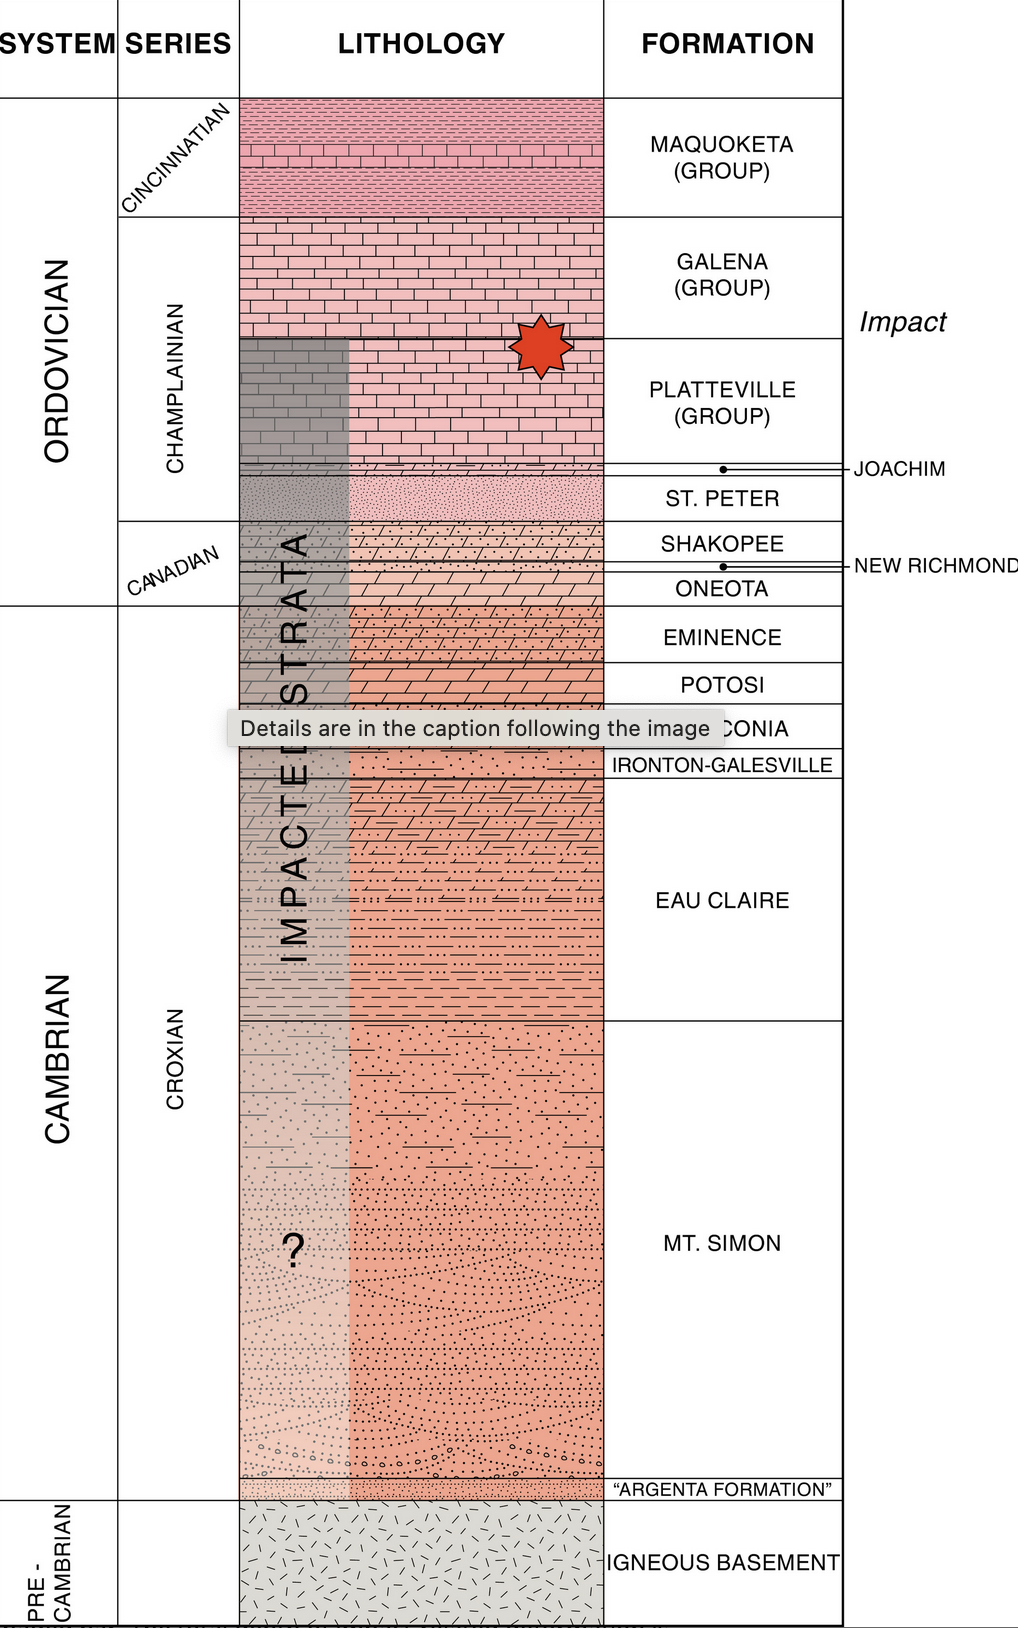
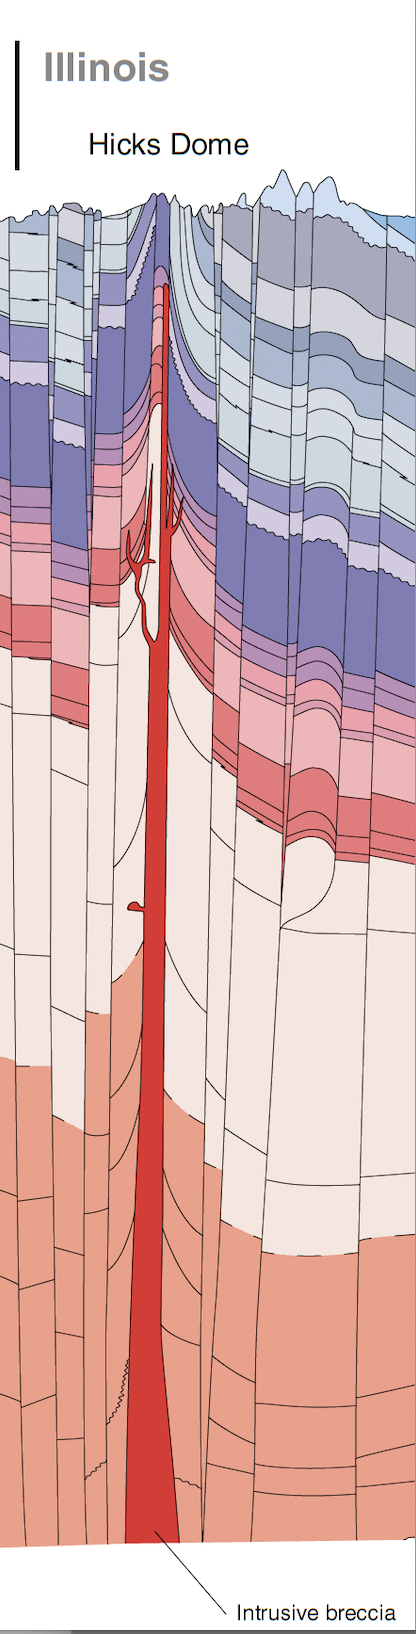
The situation is illustrated nicely by the stratigraphic column:
To test this hypothesis we’d need to similarly drill into the Champaign Uplift. Clearly, some drilling already must have been done. Otherwise, there would seemingly be little reason to suspect that the Champaign Uplift is present beneath the till. Moreover, there would presumably need to be a fairly large number of wells in order to resolve the feature to the extent that it’s shown on the bedrock map. (Ed. — Perhaps seismic data can reveal such detail in the absence of drilling. You should really look into that.)
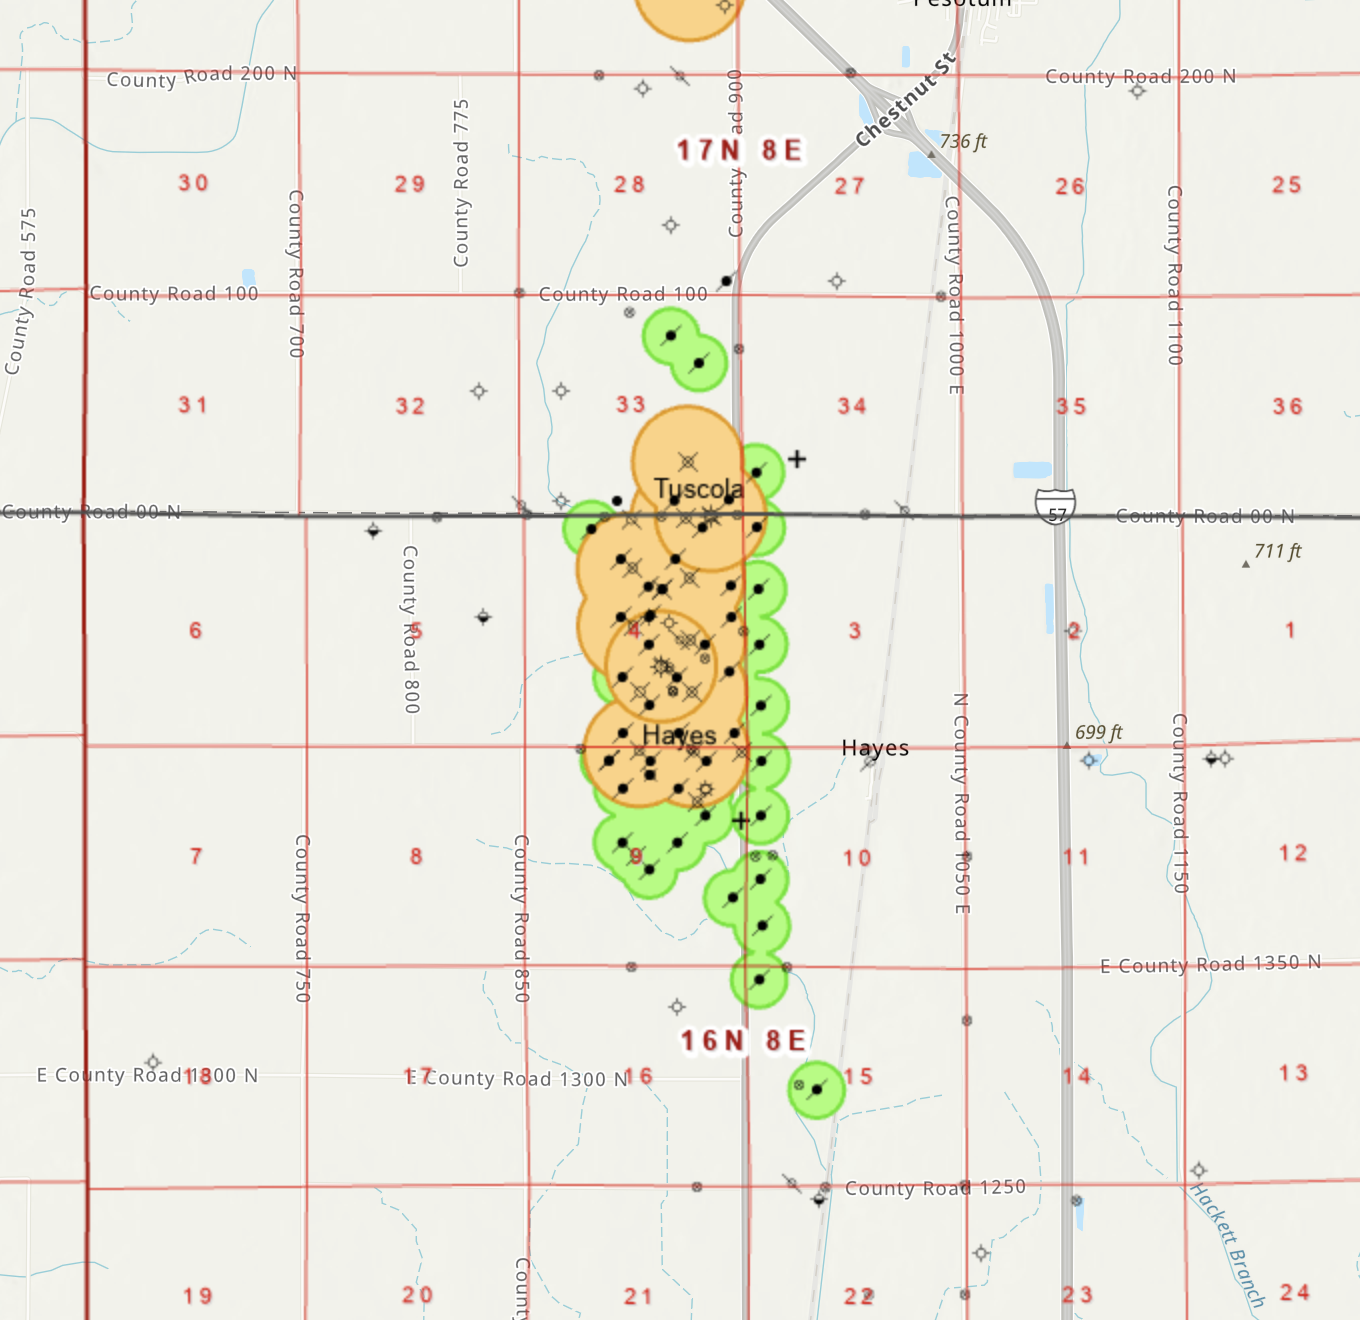
Anticlines are good at trapping oil. If one of the upper layers of the stratigraphic column is impermeable, then oil and gas will tend to migrate along the uplift gradient. A little bit of googling strikes an informational gusher in the form of the Illinois Oil and Gas Resources mapping application.
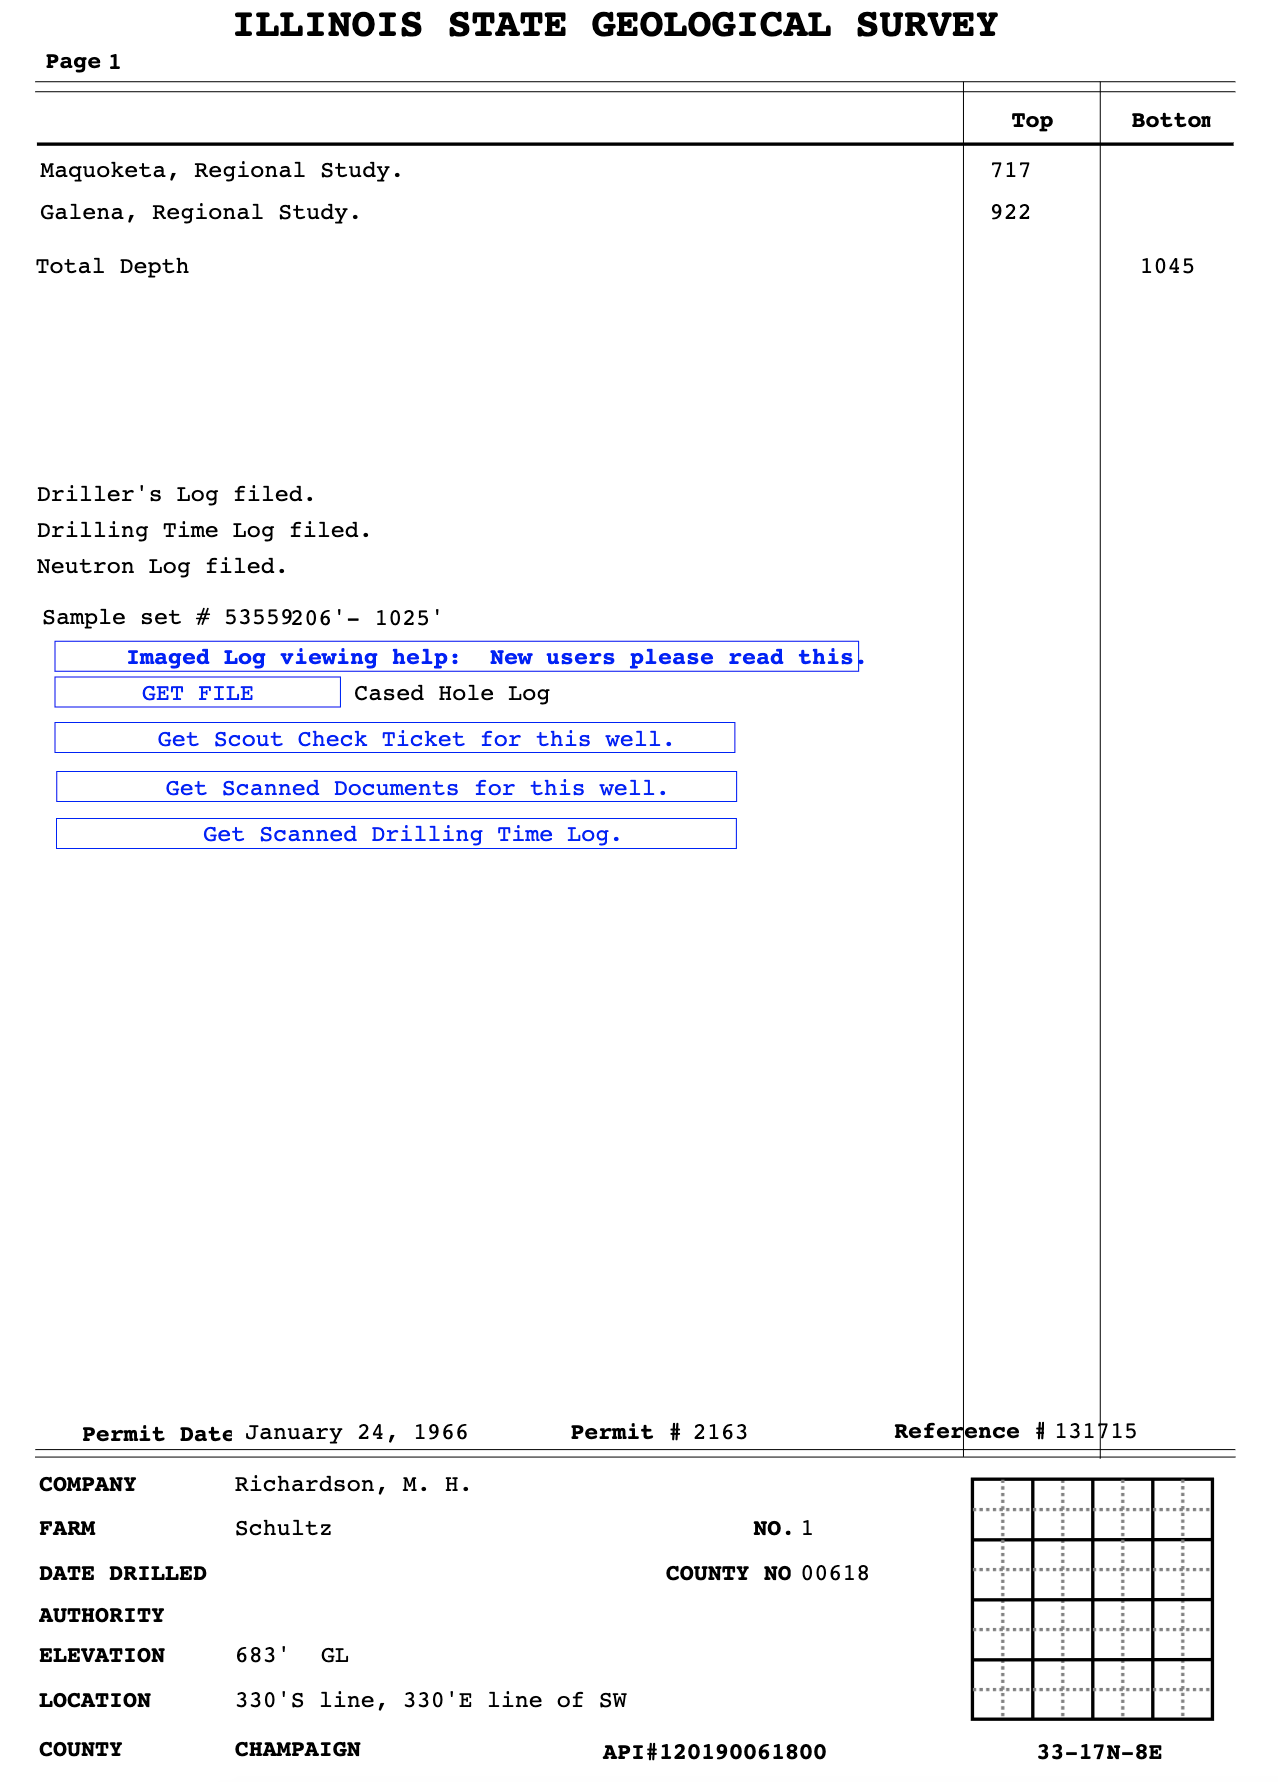
Look at that! The Champaign Uplift is shot through with oil wells. Each well location is clickable, and brings up a record at the Illinois Geological Survey. Clicking on a site close to County Road 100 yields:
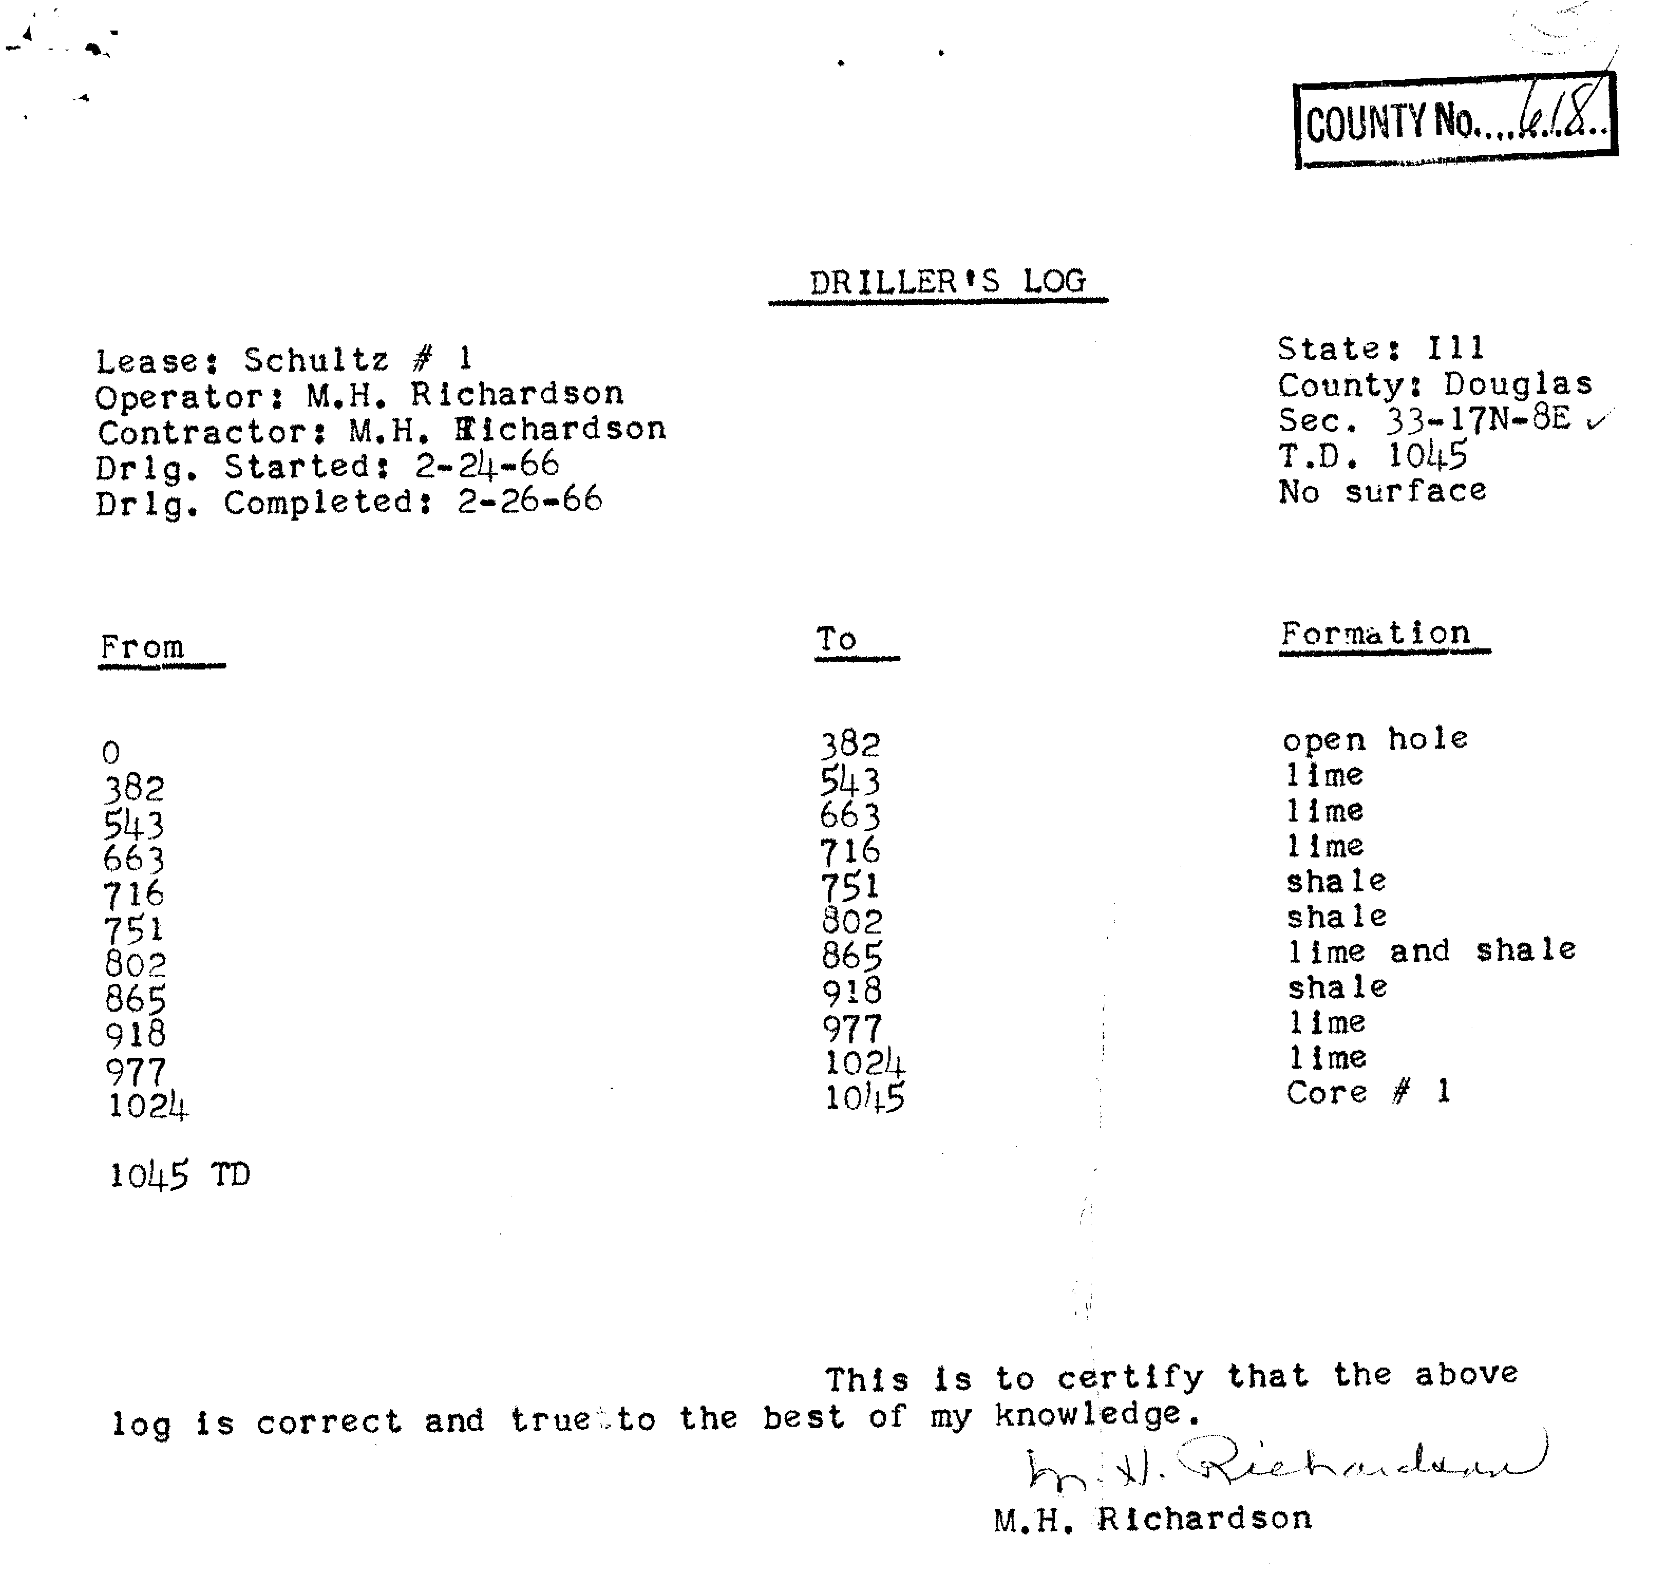
Further clicking reveals the scanned well logs:
The wells were all drilled in the mid 1960s and they all go down about 1000 feet, at which point they tended to strike oil, typically generating about 50 barrels per day per well. There are about 50 such wells tapping the uplift, and assuming that they produced for a year, they generated about a million barrels of oil. USD 80M at current prices. Sweet.
Having hit the pay zone, however, it appears that there was no interest in drilling further. Had they gone down another few thousand feet might they have found an intrusion, an incipient Devil’s Tower? The flat landscape stretching away to the horizon gives no hint.
I was talking to a friend yesterday and the topic of grabby aliens came up. This, in turn, preempted the post I was working on. Grabby aliens render the question of when Venus lost its oceans (in the event that it had them in the first place) into the realm of the provincial and the mundane. I wrote an oklo.org post about grabby aliens a few years ago, and one can, of course, study the Astrophysical Journal paper in detail.
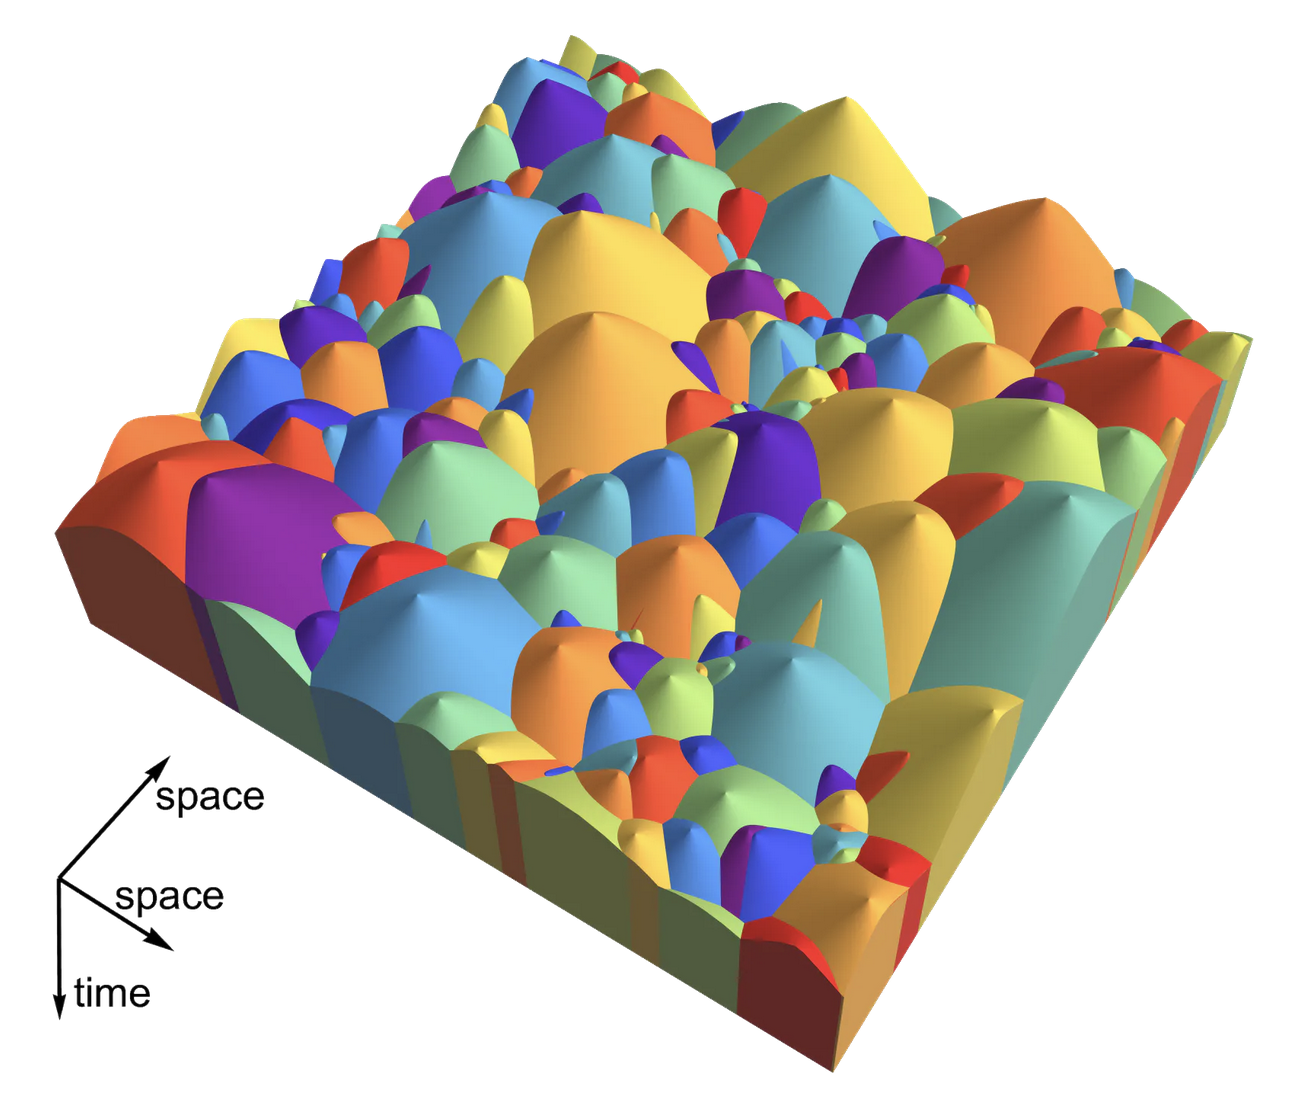
There’s something about the candy-crush colors of the flagship grabby aliens diagram that is appealing, but it is also remarkably effective in the way that the figure telegraphs the vast and epic sweep of the Cosmic Struggle for control:
Time proceeds downward. Grabby aliens stochastically emerge at various spots in the visible Universe, and as soon as they emerge they spread out in all directions, steamrolling everybody that they encounter; it’s the opposite of the and the meek shall inherit the Earth.
The diagram indicates that when one set of grabby aliens encounters another set of grabby aliens, they permanently maintain a tense standoff in the co-moving frame. The universe undergoes a phase transition from free-to-be-you-and-me to a cosmic web of Panmunjoms and 38th Parallels. I would have naively thought that the lines of demarcation would have more of a fractal structure as competing grabbers interpenetrate and contest ever smaller parcels of the interstellar gulfs.
Another remarkable conclusion that appears to flow from the diagram is that the Universe is bequeathed with some sort maximum aggressive potential. This quantity — perhaps a Carnot-like thermodynamic optimum of information processing and PdV work — must thus ultimately proceed from fundamental physics. The figure suggests that every space-like separated grabby set-up that emerges is immediately endowed with this perfectly efficient maximum contesting power. This brings to mind a thermodynamic system that is quenched from a homogeneous state into a broken symmetry phase, which, in turn, suggests the relevance of phase ordering kinetics in systems undergoing a phase transition. (For some light reading on the topic, see here).
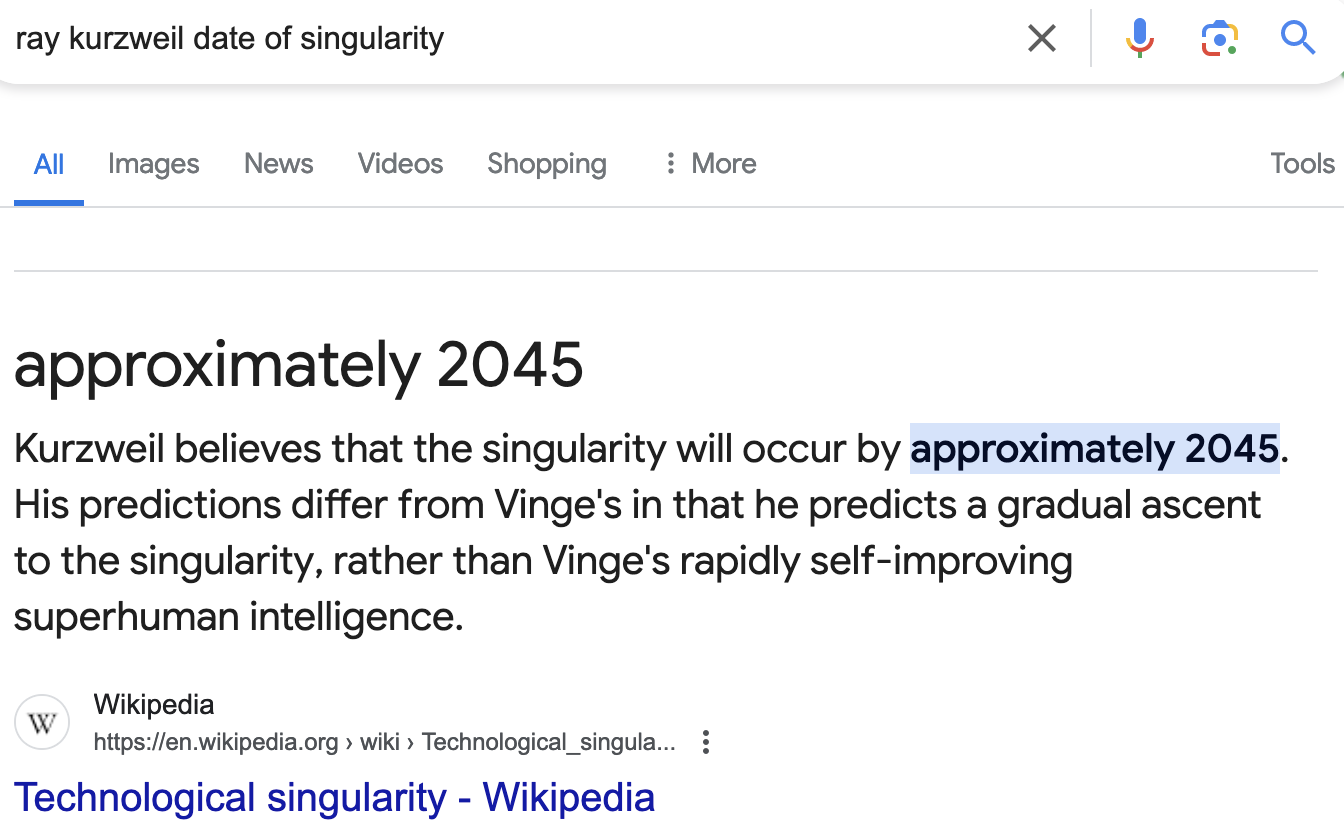
Consulting Google this morning, I see that we’re currently scheduled for The Singularity in twenty-one years.
From what I can tell, the singularity would provide all of the necessary and sufficient conditions for a giant cluster of H100s running a souped-up pre-trained model to graduate into the Grabby Aliens club, especially if it’s of the “Vinge’s rapidly self-improving superhuman intelligence” variety. That motivated me to predict a super-short outlier time frame on the Metaculus Grabby Aliens question.
Looks like I have some significant deviation from the consensus (I predicted 19.4 yr in 2021). The Metaculus crowd tends to adhere to the Toby Ord philosophy, and that school of smart money is predicting that we’ve got a comfortable 171.5 billion years before we need to start vesting up.