The whole astronomical community is buzzing with anticipation over the imminent release of the unredacted First-Run Kepler results — all of the good stuff that was held back from the data release that occurred last June.
One can only imagine what might be contained — multiple-planet transiting systems, giant planet satellites, potentially habitable planets transiting low mass stars, a definitive answer to the super-Earth occurrence rate (to name but a few).
Once the candidates hit the stands, there will be a rush to skim the cream, and a mobilization of follow-up observational campaigns to capitalize on the best opportunities in the data set. With this eventuality in mind, Konstantin Batygin and I have prepared a follow-up characterization flow chart to aid fellow exoplanet prospectors in sifting potentially interesting systems — a template for the treasure map. As always, keep in mind that the brighter the individual parent star, the better the chances for the most interesting planetary characterizations.
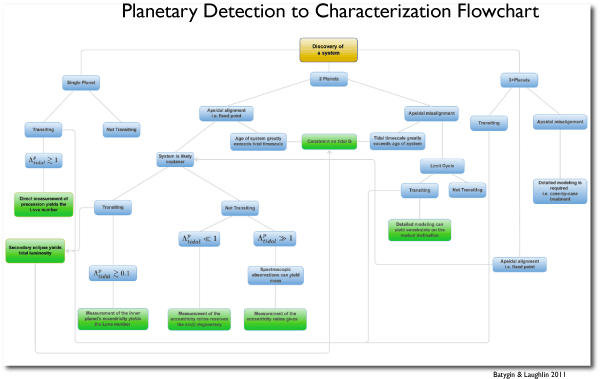
Click here for a legible full-size version of the flowchart. (The paper containing it is focused primarily on the rather remarkable things one can do with tidally evolved multi-planet RV-detected systems. It’s been accepted to the Astrophysical Journal, and will appear on astro-ph shortly. It’s available now for download from oklo.org.)
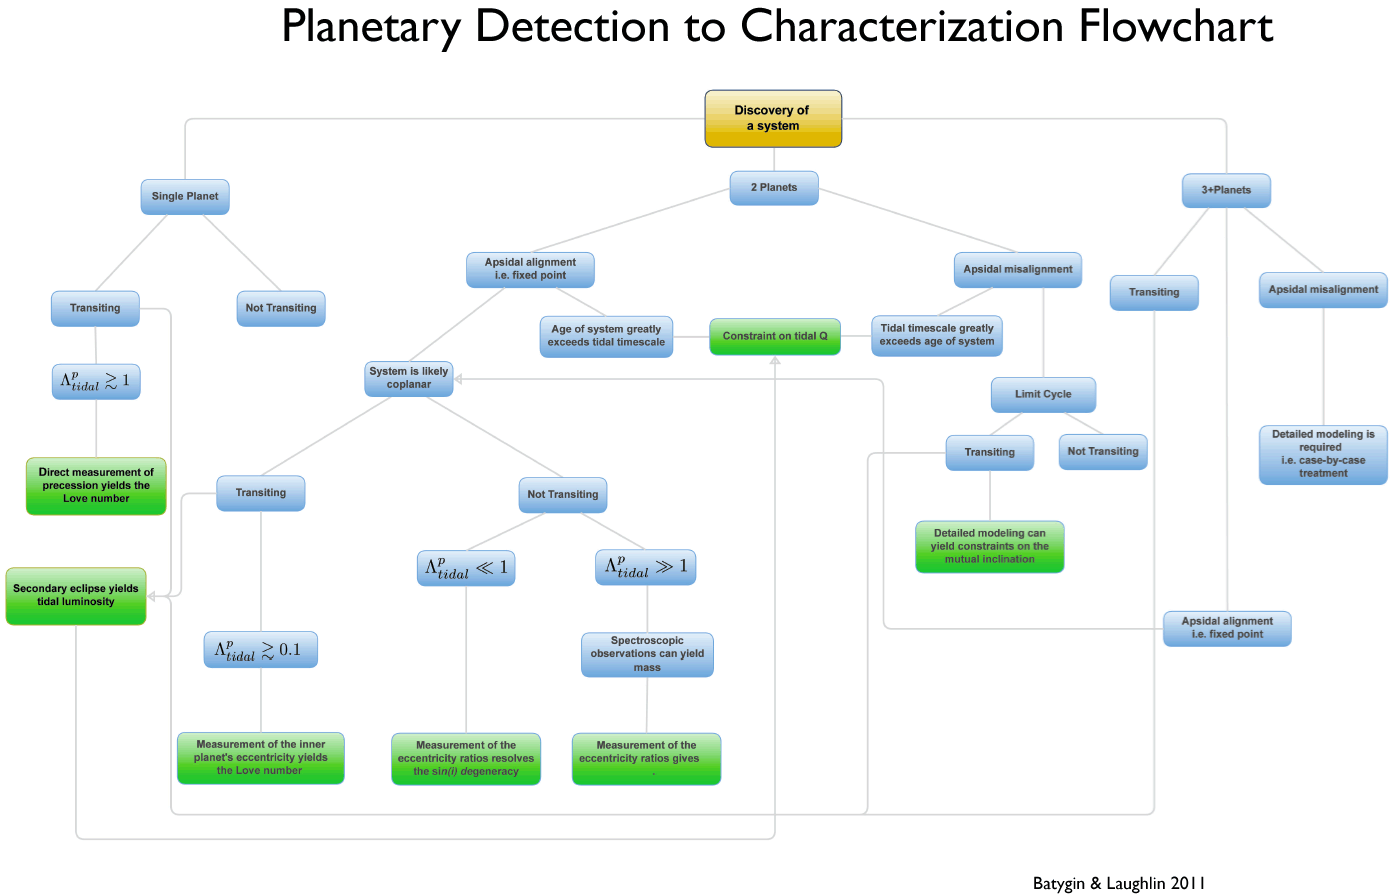
The bottom middle green box of the flowchart seems to be cut off : “Measurement of the eccentricity ratios gives .”
[…] särskilda instruktioner för hur man tankar hem dem.16:46 Exoplanetguru Greg Laughlin skriver på systemic-bloggen om hur han klarat spänningen inför Keplers datasläpp. Han gjorde ett flödesdiagram för att […]
[…] have the release of these data, and the first thing I want to do is direct you to Greg Laughlin’s systemic site, where you can find a follow-up characterization flow chart to help work through systems of […]