Ceres

Screen-Shot-2015-03-10-at-9.18.11-AM

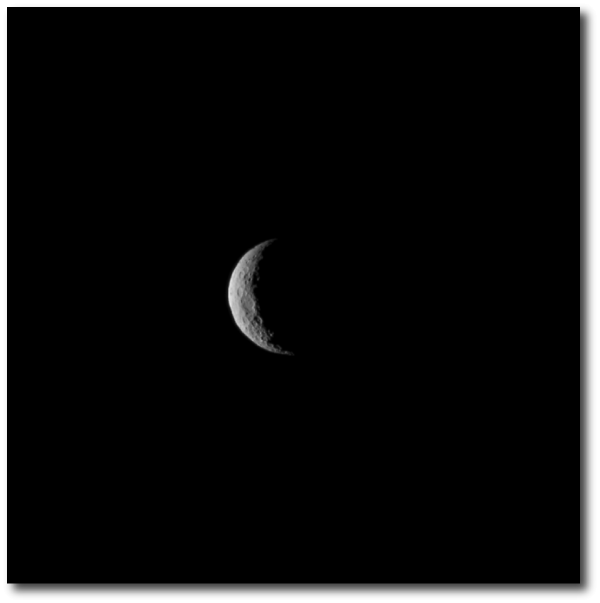
I was struck by the image that NASA released several days ago, just before the Dawn Spacecraft braided itself into orbit around Ceres.

From a graphic standpoint, the photograph is perfect. The black expanse relays that the asteroid belt, and by extension the solar system, are mostly empty. Even more subtle is the message telegraphed by the crescent phase. We arrive to our first clear view of this world as outsiders, from a distance further from the Sun than Ceres itself. A consequence of the energetics and the constraints of the trajectory design to be sure, but metaphoric nonetheless.

Electra

FullSizeRender2222015
Have you noticed that the Internet can seem slow? Sometimes it takes a long time for web pages to load. It would really be better if they would just snap up instantly on the screen.

In practice, “instant” response occurs if the latency is less than ~1/30th of a second, or ~30 msec. Animation at thirty frames per second looks smooth. Only a small minority of the population has the retinal read-out frequency required to see that the Crab pulsar is flashing at 33.5 msec intervals.

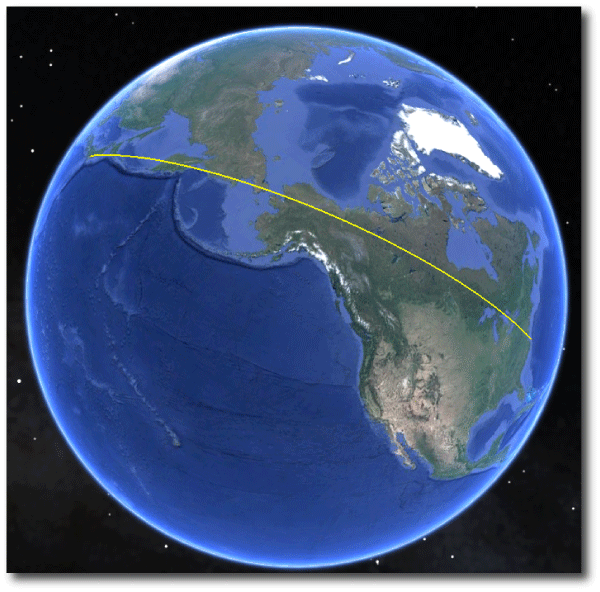
Coincidently, the speed-of-light travel time along the (almost entirely overland) great circle route between Tokyo and New York is (to within a millisecond) the same as the Crab Pulsar’s current spin period. In theory, it should possible to load Japanese-sourced web pages with barely perceptible latency, as the service of a request involves a round-trip.

Screen-Shot-2015-02-22-at-5.17.14-PM

The fastest communication between Japan and the West Coast of the United States is via NTT’s PC-1 cable, which runs between cable landings at Ajigaura (near Tokyo) and Harbour Pointe (near Seattle). Round-trip communication on the cable takes 80 msec, which, given that the speed of light in optical fiber is ~1.44x slower than the speed of light in vacuum, indicates that cable must adhere fairly closely to the great circle route beneath the Pacific.

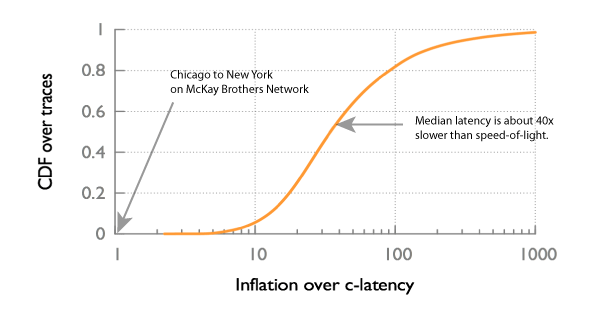
Here’s an interesting paper by Ankit Singla and his collaborators which explores the various drag terms that keep the Internet from actually running at the speed of light. As part of their research, they report on 20+ million measurements of 28,000 web urls served from 120+ countries. The cumulative distribution function of all that pinging points to a median latency for loading html that is ~40x slower than if the message was covering the inferred great circle distance at the speed of light in vacuum.

Screen-Shot-2015-02-22-at-5.52.43-PM

Singla et al. argue that the speed doesn’t have to be so slow:

A parallel low-latency infrastructure: Most flows on the Internet are small in size, with most of the bytes being carried in a small fraction of flows. Thus, it is conceivable that we could improve latency for the large fraction of small-sized flows by building a separate low-latency low-bandwidth infrastructure to support them. Such a network could connect major cities along the shortest paths on the Earth’s surface (at least within the continents) using a c-speed medium, such as either microwave or potentially hollow fiber. Such a vision may not be far-fetched on the time horizon of a decade or two.

Even a decade might be an overestimate. As oklo.org readers know, during the past several years, a secretive fleet of microwave networks have sprung up to transfer information between the Chicago and New York metro areas at as close to the speed of light as possible. The fastest of these networks now transmit within ~2% of the physical minimum. Tremendous efforts have gone into squeezing out every last source of delay.

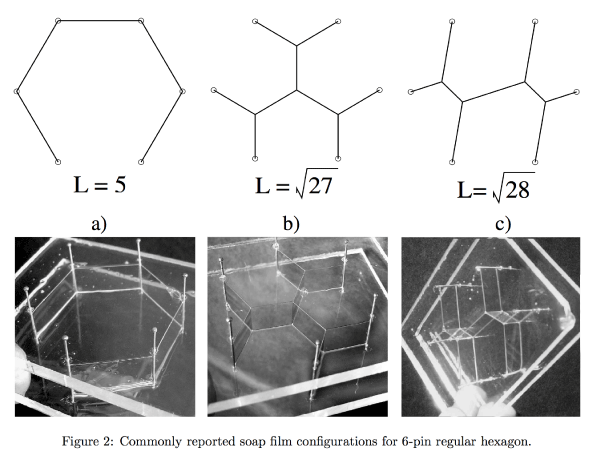
It’s thus interesting to look at what a national low-latency microwave backbone might look like. To optimize on costs, and to minimize connection times, one wishes to connect a number of nodes (metropolitan areas) with the minimal complement of route segments. This task, known as the Steiner tree problem has an interesting history, and computationally, is non-deterministic polynomial-time (NP) hard. One can get analog solutions by placing a board with pegs representing the nodes into soapy water. The connective soap bubble films are physical representations of the Steiner trees:

Screen-Shot-2015-02-22-at-10.03.46-PM

I coded up a Steiner tree finder using an incremental optimization algorithm, and ran it on the top 20 metro areas in the US by populations, which (ranked according to distance from their centroid) are:

1 DFW
2 MSP
3 ORD
4 IAH
5 DIA
6 ATL
7 COL
8 DTW
9 DCA
10 PHX
11 TPA
12 PHL
13 NYC
14 MIA
15 SAN
16 LAX
17 BOS
18 SFO
19 PDX
20 SEA

The algorithm, which employs the Vicenty distance formula between points on the Earth’s surface, and which is not guaranteed to find the absolute shortest route, links the 20 cities with a total path length of 9,814km, about 10x the length of a NYC-CHI route:

Screen-Shot-2015-02-16-at-8.13.20-PM

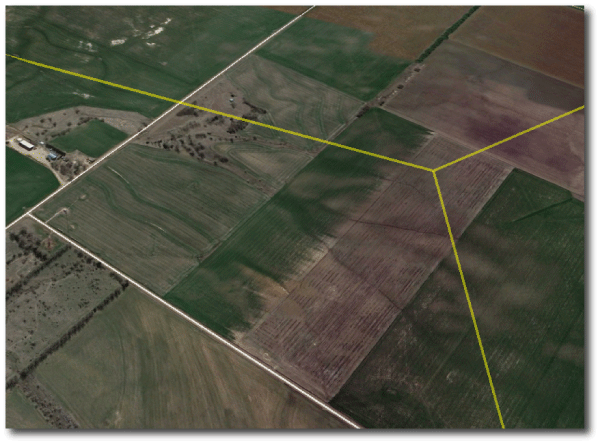
The added interconnecting nodes on the tree are the Steiner points. A prominent example on the map above connects Dallas and Denver with the Minneapolis-Chicago interconnect point, and lies in an obscure field a few miles south of Haven, Kansas.
Screen-Shot-2015-02-22-at-10.22.12-PM
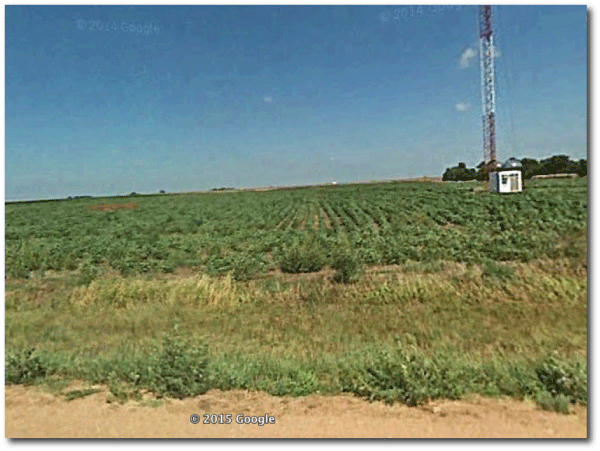
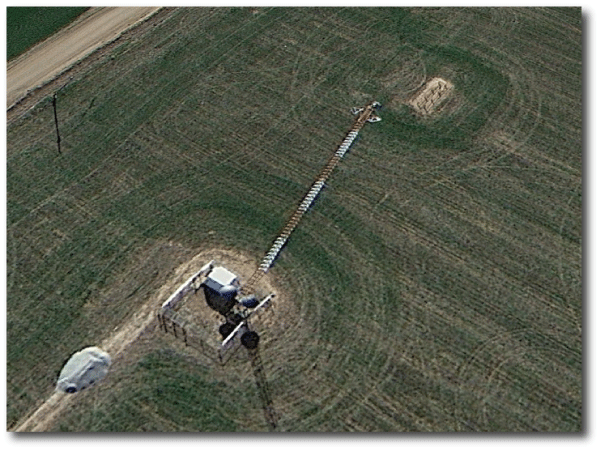
Remarkably, when one zooms in on the exact spot, and settles into street view, there’s a red and white microwave tower a hundred meters or so from the actual Steiner point.
Screen-Shot-2015-02-22-at-10.24.05-PM
Rather fittingly, the tower has three dishes, indeed, pre-aligned and pointing in what appears to be the requisite directions…
Screen-Shot-2015-02-22-at-10.21.49-PM
The Gaia hypothesis, was introduced by James Lovelock in the 1970s and “proposes that organisms interact with their inorganic surroundings on Earth to form a self-regulating, complex system that contributes to maintaining the conditions for life on the planet.”

As the planet wires itself and its computers ever more tightly together in an ever-lower latency web of radio links and optical fiber, it no longer seems like a particular stretch to float an Electra hypothesis in which computational nodes and their interconnections assume a global role comparable to that now filled by the biological organisms.

The Machine Epoch

Screen-Shot-2015-02-14-at-6.23.47-PM

In looking through oklo’s activity logs, it is evident that many of the visitors are not from the audience that I have in mind as I write the posts. The site is continually accessed from every corner of the planet by robots, harvesters, spamdexing scripts, and viral entities that attempt to lodge links into the blog.

A common strategy consists of attempts to ingratiate with generically vague comments of praise:

Screen-Shot-2015-02-13-at-11.51.48-AM

The Turing test was envisioned as a text-only conversation with a machine. The machine passes the test if it can’t be distinguished from a real person. In Alan Turning’s Computing Machinery and Intelligence, he asks, “Are there imaginable digital computers which could do well in the imitation game?”

For now, the general consensus seems to be no. Machines can’t consistently pass the test (and the test itself seems increasingly dated), but their moment is approaching fast. Judith Newman’s recent NYT article about interaction with the iPhone’s Siri telegraphs the stirrings of the current zeitgeist.

The economics of comment spam must be relatively minor. Were serious money was at stake, a Nice Post! robot armed with state-of-the-art-2015 natural language processing skills and tuned to the universe of text strings and facts could almost certainly pull the wool over my eyes.

Screen-Shot-2015-02-14-at-6.29.23-PM

In early 2001, I was working at NASA Ames Research Center. The first Internet Bubble hadn’t quite ended. Highway 101 was a near-continual traffic jam. Narrow billboard trucks advertising this or that dot com were still cycling aimlessly up and down the Peninsula. We had just published our plan to move the Earth in response to the gradually brightening Sun.

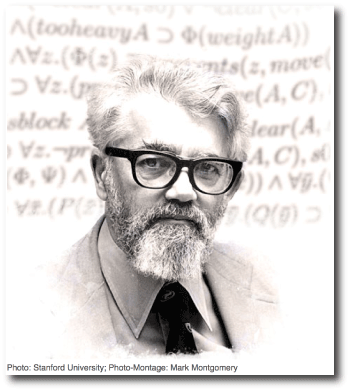
I got an e-mail with a stanford.edu address from someone named John McCarthy, who asked if he could come to NASA Ames to talk with us about astronomical engineering. This was before the Wikipedia, and for me, at least, before the ingrained reflex to turn to the web for information about someone one doesn’t know. I just wrote back, “Sure!”

I recall McCarthy in person as a rather singular character, with a bushy white beard surrounding thick black glasses. He had a rattletrap car with a bulky computer-like device somehow attached next to the steering wheel. My co-author, Don Korycansky, was there. I remember that the conversation was completely focused on the details of the orbits and the energy budgets that would be required. We didn’t engage in any of the far-out speculations or wide-eyed ramifications that thrust us, as a result of my ill-advised conversation with a reporter a few weeks later, into a terrifying worldwide media farce.

Only later did I realize that John McCarthy was one of the founding giants of computer science. He coined the term Artificial Intelligence, invented Lisp, and was famous for his Usenet .sig, “He who refuses to do arithmetic is doomed to talk nonsense.”

McCarthy’s Progress and Sustainability web pages (online at http://www-formal.stanford.edu/jmc/progress/index.html) are dedicated to the thesis of optimism — that human progress is desirable and sustainable. He wrote, “There are no apparent obstacles even to billion year sustainability.” In essence, the argument is that the Anthropocene epoch, which began at 05:29:21 MWT on July 16, 1945, will stretch to become an eon on par in duration with the Archean or the Proterozoic.

Optimistic is definitely the operative word. It’s also possible that the computational innovations that McCarthy had a hand in ushering in will consign the Anthropocene epoch to be the shortest — rather than one of the longest — periods in Earth’s geological history. Hazarding a guess, the Anthropocene might end not with the bang with which it began, but rather with the seemingly far more mundane moment when it is no longer possible to draw a distinction between the real visitors and the machine visitors to a web site.

Epicycles

Screen-Shot-2015-02-08-at-2.10.36-PM

Vladimir Arnold, he of the A in KAM Theory, wrote a classic graduate text entitled Mathematical Methods of Celestial Mechanics. This, as one might imagine, is a book that is not exactly a storehouse of easy homework assignments. There are, however, a scattering of problems that offer insights while, at the same time, not actually requiring the tough-guy methods that are the text’s primary focus.

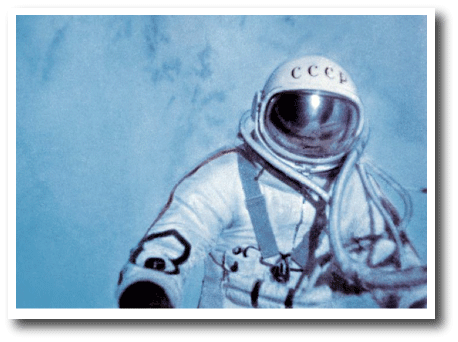
During his walk in outer space [as part of the Voskhod 2 Mission on 18 March 1965], the cosmonaut Alexey Arkhipovich Leonov threw the lens cap of his movie camera toward the Earth. Describe the motion of the lens cap with respect to the spacecraft, taking the velocity of the throw as 10 m/s. Neglect the asphericity of the Earth.
Screen-Shot-2015-02-08-at-11.59.02-AM
(Ria Novosti/Science Photo Library)

Leonov’s space walk tipped off a hair-rising adventure which began with his being nearly unable to re-enter the spacecraft, and ended with a frigid way-off-course landing in the Siberian Tiaga, all of which is covered in a recent BBC documentary.

One can hand-crank the problem by noting that the radially directed, \({\bf v}_{i}=10\,{\rm m\,s^{-1}}\), launch of the lens cap exerts no torque, so that \({\bf r}\times{\bf v}_{i}=0\), whereas the total specific energy of the lens cap’s initial orbit, \(-GM_{\oplus}/2a\) is augmented by \(\frac{1}{2}v_{i}^{2}\). Given the new semi-major axis, \(a_{\rm new}\) and the before-and-after conservation of \(h=(GM_{\oplus}a_{\rm new}(1-e^2))^{1/2}\), one can solve for \(e\), and then proceed to all four orbital elements by noting that \(r=a(1-e\cos E)\) and \(M=E-e\sin E\), and then working out the longitude of pericenter, \(\varpi\), relative to the reference direction defined by the radius vector from the Earth’s center to the point where the lens cap was thrown. Clumsy.

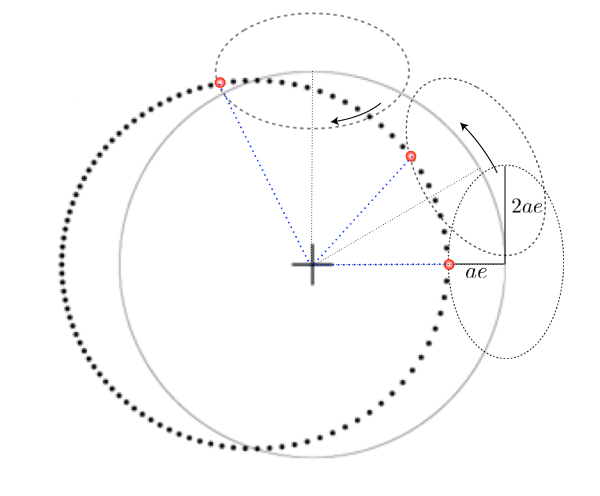
The guiding center approximation revives the old idea of epicycles to describe the motion of a particle (in this case, the lens cap) on a low eccentricity orbit. For modest \(e\), the true Keplerian motion is approximated as a compound of the circular motion of a “guiding center” and the counter-directed motion about the guiding center on a 2:1 ellipse, where the semi-minor axis is oriented radially, and has length \(ae\). Both motions complete once per orbital period. Here’s the basic idea, drawn for an orbit with \(e=0.3\), which is actually quite a substantial eccentricity:
Screen-Shot-2015-02-08-at-2.14.40-PM

For the lens cap problem, the guiding center materializes at a distance \(2ae\) ahead of the launch point. The motion associated with the guiding center is the superposition of two simple harmonic motions. For the radial oscillation, \(\frac{1}{2}v_{i}^{2}=\frac{1}{2}n^{2}x^{2}\rightarrow v_{i}=nae\), which works out to \(e=0.0013\). To first (and very good) approximation, the lens cap arrives back 88 minutes later in the close vicinity of the spacecraft, after inward and outward radial excursions of 8.4 km, and after leading the spacecraft by as much as \(4ae=34\) km. The small total gain in orbital energy lengthens the lens cap’s orbital period slightly, which means that the cap fails to catch up by a few tens of meters at the end of a full one-orbit epicyclic oscillation.

In Michael Rowan-Robinson’s Cosmology (3rd ed.) Oxford University Press. pp. 62–63, one finds, “It is evident that in the post-Copernican era of human history, no well-informed and rational person can imagine that Earth occupies a unique position in the universe.”

If one insists on a strictly inertial frame, I guess that’s true, but non-inertial frames often have more value. Thousands of extrasolar planets have been found, and not one of them is remotely habitable. Many lines of evidence are beginning to point toward an Earth that is unique, probably in the galaxy, and perhaps, even, in the accessible universe. In the post-post Copernican era, epicycles (2:1, rather than 1:1) have a certain appeal. And indeed, there’s nothing inherently wrong about the Tychonic model of the solar system, it simply subscribes to an Earth-centered point of view. Don’t we all?

On the topic of epicycles, I have to say I wasn’t a fan of the article on “retrograde beliefs” that appeared a few weeks ago in the New York Times Magazine. Obviously, astrology is a bunch of bunk. It’s known to be wrong. One can make the argument that taking it down in the genteel and informed confines of the NYT magazine amounts to shooting fish in a barrel. Satire is probably the best approach. Aside from this stylistic quibble, the writing in the NYT piece seems incoherent, somehow second-hand and artless. An intricate 1756 diagram by James Ferguson (who is no longer around to defend his work) is given a rather underhanded misrepresentation:

Screen-Shot-2015-02-08-at-6.15.31-PM

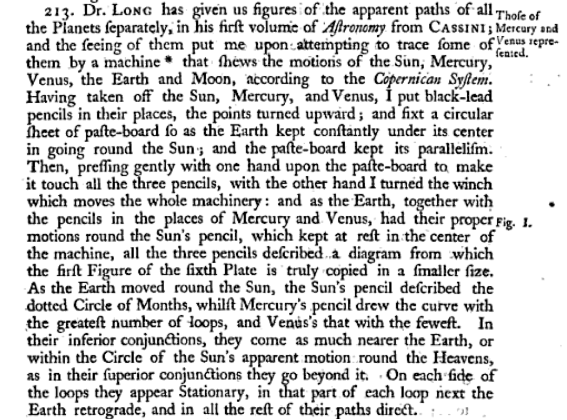
The full title of Ferguson’s book is Astronomy Explained Upon Sir Isaac Newton’s Principles, And Made Easy to Those who Have Not Studied Mathematics. The diagram reproduced in the NYT is not the product of some recalcitrant Ptolemaic view as implied in the caption, but rather appears in a chapter entitled “The Phenomena of the Heavens as seen from Different Parts of the Solar System”. It shows the intricate motions of the inferior planets in a co-rotating Earth-centered frame, and Ferguson gives a fascinating description of the analog-computational method he used to create the diagram:

Screen-Shot-2015-02-08-at-6.45.41-PM

Exhaustive new review article on exoplanets.

Screen-Shot-2015-02-08-at-9.21.17-PM

One tends to roll one’s eyes when the topic turns to Georges-Louis Leclerc, Comte de Buffon, the French encyclopedist and pre-revolutionary intellectual luminary.

Buffon sounds regrettably similar to Buffoon, especially considering that The Comte is best-known for some memorable blunders. For example, Georges-Louis came out on the losing side of a tussle with Thomas Jefferson regarding the general valor of the New World fauna. From the wikipedia article:
At one point, Buffon propounded a theory that nature in the New World was inferior to that of Eurasia. He argued that the Americas were lacking in large and powerful creatures, and that even the people were less virile than their European counterparts. He ascribed this inferiority to the marsh odors and dense forests of the American continent. These remarks so incensed Thomas Jefferson that he dispatched twenty soldiers to the New Hampshire woods to find a bull moose for Buffon as proof of the “stature and majesty of American quadrupeds”

Buffon also speculated, in 1778, that the solar system’s planets were the result of a collision between a comet and the Sun, a hypothesis that is completely incorrect. Even in the 1750s, perturbation analyses (such as those carried out by Alexis Claude Clairaut in connection with the successful predictions of the return ephemeris for Halley’s Comet) had made it clearly evident that cometary masses are far smaller than planetary masses.

Buffon, however, was definitively not a buffoon. He came remarkably close to having a full command of all the scientific disciplines, and some of his efforts still sparkle. He calculated that the chance of the Sun rising tomorrow is \(1-(1/2)^x\), where \(x\) is the number of consecutive days that it has risen to date. In his treatment of probability theory, he also stated that one chance in 10,000 is the lowest practical probability — an enormously useful bon mot, on par, say, with Andy Warhol’s remark that “when you think about it, Department Stores are kind of like Museums.”

Buffon’s Histoire Naturelle, which aimed to exhaustively cover all of the natural sciences, ran to 44 quarto volumes, eight of which were written and which appeared after he died, and all of which were out of date the moment they were printed. Even in the 1700s, scientific knowledge was accumulating so rapidly that it was impossible to keep up.

It has been recently hammered home to me that the same situation also now holds true for extrasolar planets. Jack Lissauer and I just finished a review article on exoplanets for the forthcoming second edition of Elsevier’s Treatise on Geophysics. A pre-print is up on today’s arXiv listing. In writing the article, it was painfully clear just how large the literature is, and how fast it is growing…

Census

Screen-Shot-2015-01-17-at-12.23.27-PM

I’ve been putting the finishing touches on a review article covering extrasolar planets that will be posted to arXiv in a few days. The list of to-do’s involves updating the figures, including the one shown just below, which charts \(M\sin i\)‘s of the RV-sourced planets in dark gray and simple radius-derived mass estimates of the transit-sourced planets in red. The steady Moore’s Law-like progression toward ever-lower masses has definitively reached Earth-mass (not to be confused with Earth-like) planets. The process took up only two decades, and was among the more impressive scientific advances of the recent past.

Screen-Shot-2015-01-17-at-12.25.04-PM

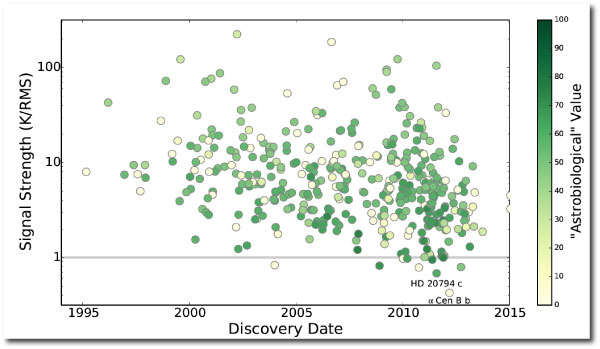
Here’s an elaboration of the above figure that doesn’t make it into the article, but is interesting nonetheless. On the y-axis is \(K/rms\), which is reasonably well correlated with the signal strength of Doppler velocity discoveries. One can certainly detect planets with confidence at low \(K/rms\), but it requires a large number of independent Doppler velocity measurements. The color corresponds to “astrobiological interest” — surely naive, and probably misplaced, but nonetheless quantifiable by my planet valuation formula.

Screen-Shot-2015-01-17-at-12.29.08-PM

The Elysian Fields

Screen-Shot-2015-01-14-at-5.49.47-PM
Credit: NASA/JPL

It feels increasingly awkward and embarrassing to read LaTeXed, peer-reviewed articles that quantify and delineate the habitable zone — the special region surrounding a star that is invariably (and rather fittingly) linked to a particular fairy tale from the Brothers Grimm.

Evolutionary psychologists have speculated that the concept of the afterlife might be inextricably entwined to the evolution of the mind’s ability to reason about the minds of others. A rational world view, however, frustrates ingrained atavistic yearnings and a belief in the supernatural. Habitable planets provide a respectable stopgap to assuage the discomfort of these incompatible poles. Could it be a mere coincidence that the ancient Greek and classical depictions of Elýsion pedíon, the Elysian Fields, are part and parcel the very image of the habitable zone?

Screen-Shot-2015-01-14-at-5.43.46-PM
Credit: NASA/SETI/JPL

And they live untouched by sorrow in the islands of the blessed along the shore of deep-swirling Ocean, happy heroes for whom the grain-giving earth bears honey-sweet fruit flourishing thrice a year, far from the deathless gods…

— Hesiod, Works and Days (170)

Detroit

Screen-Shot-2015-01-08-at-12.19.43-PM

The submerged summit of the Detroit Seamount ranks among the planet’s gloomiest spots. East of Kamchatka, a mile beneath the waves at 51 51′ N, 167 45′ E, it is second-to-last in the long line of Emperors. Inch by inch, it creeps toward destruction in the Aleutian Trench.

Detroit’s glory days were the late Cretaceous. Back then, it was an active Hawaiian volcano.

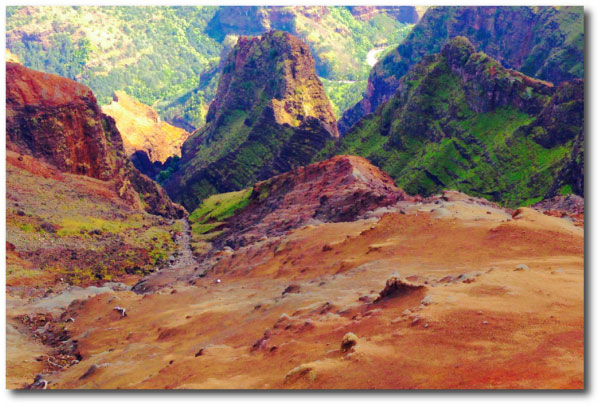
Live it fast, you’re gonna get there soon. Kauai is five million years old, but underground, the lights have gone out. Over half of the original height and the original land area have disappeared. Rivers gush sediment into the sea. Waimea Canyon juxtaposes verdure and an erosive wasteland. Four wheel drive claws and rends the red dirt.

Screen-Shot-2015-01-08-at-12.32.49-PM

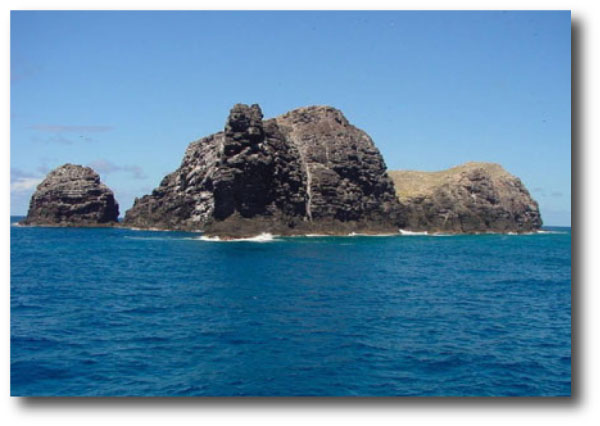
Beyond Kauai, the next islands in the chain are Nihoa,

Screen-Shot-2015-01-08-at-12.08.42-PM

Necker,

Screen-Shot-2015-01-08-at-12.09.46-PM

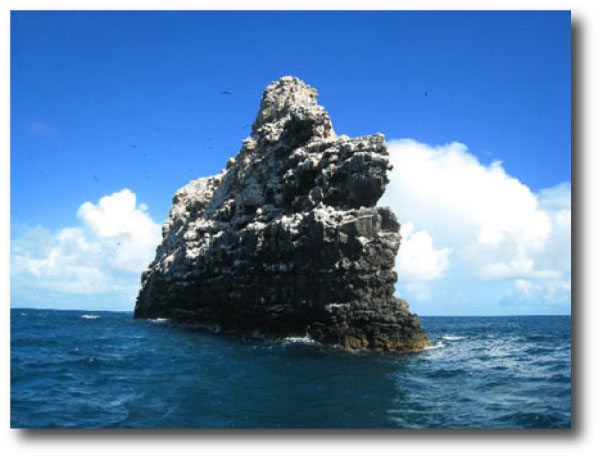
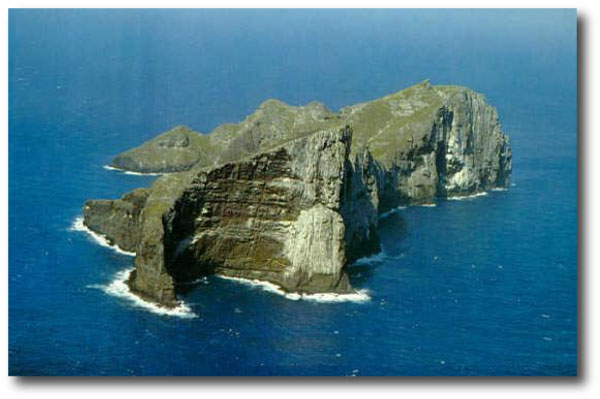
and the La Perouse Pinnacle,

Screen-Shot-2015-01-08-at-12.13.32-PM

whose resemblance to a sinking ship is not just metaphoric.

Before humans arrived, the Hawaiian islands had strange flightless birds. Indeed, each island in the chain developed its own odd avian inhabitants, sculpted by natural selection, and then driven conveyor-like to extinction. Not once, in forty, fifty, sixty tries, did the birds respond by evolving intelligence and doing something about their situation. Probably, there was never enough time.

Or perhaps, that’s something that rarely, if ever, happens.

lightspeed

Screen-Shot-2015-01-01-at-1.21.48-PM

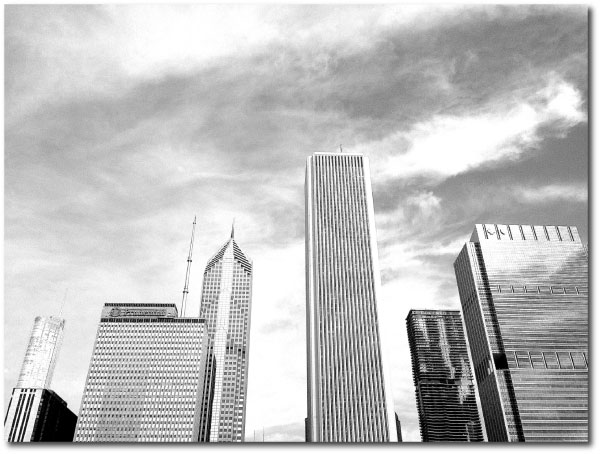
Aon Tower, as seen from Lurie Garden in Millennium Park

Millennium Park in Chicago is a remarkable place. Skyscrapers shoulder together and soar up steeply to the north and to the west. The vertiginous effect of their cliff faces is reminiscent of Yosemite Valley.

Lurie Garden is at the center of the park, and is given over largely to native plants that carpeted the Illinois landscape in the interval between the retreat of the glaciers and the advance of the corn fields. In the silence of a photograph with a narrow field of view, it is as if the city never existed.

Screen-Shot-2015-01-01-at-4.47.48-PM

Lurie Garden

Restore the sound, and the the buzz and hum of insects are superimposed on the wash of urban noise. A swarm of bees, algorithmic in their efficiency, and attuned to the flowers’ black light glow, collect the nectar. 55% sucrose, 24% glucose and 21% fructose.

When viewed in microwaves and millimeter waves, say from 1 to 100 GHz, the Millennium Park scene displays a similarly jarring juxtaposition. The sky glows with the ancient three degree background radiation — the cosmic static of the Big Bang explosion — subtly brightest in the direction of the Virgo Supercluster. All around, the buildings, the roads and the sidewalks are lit up with manically pulsating wireless transmitters: routers, cell phones, myriad sensors. In highly focused 6 GHz and 11 GHz beams, billions of dollars in coded securities orders streak above the urban canyons on line-of-sight paths linking the data centers of Chicago, Aurora, and suburban New Jersey. The fastest path of all runs through the top of the monolithic Aon Tower, where the signal is amplified and launched onward across the Lake and far into Michigan.

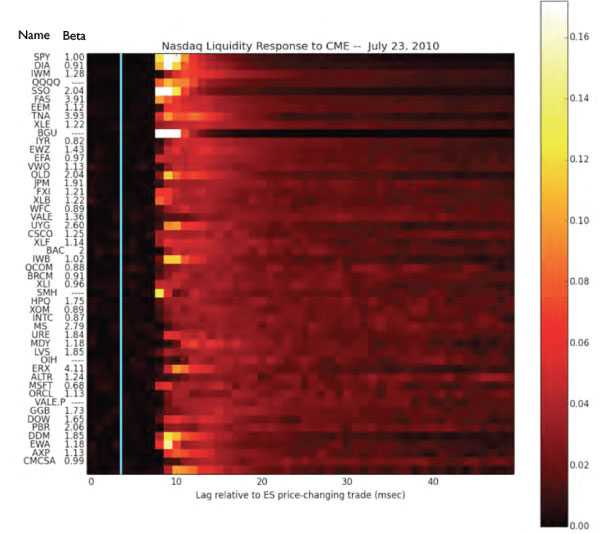
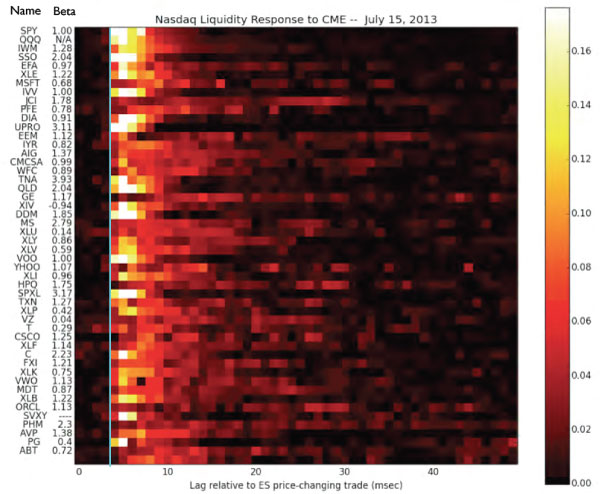
The microwave beams are a new development. In mid-2010, price movements at the Chicago Mercantile Exchange generated reactions in New Jersey nine milliseconds later. The signals traveled on fiber optic cables that meandered along railroad rights-of-way.

stockResponse2010

Now, the messages arrive within a few microseconds of the time it would take light to travel in vacuum, galvanizing the swarm of algorithms that are continually jostling and buzzing in the vicinity of the match.

stockResponse2013

Angular Power Spectra

Screen-Shot-2014-12-28-at-10.24.18-PM

It’s worth a scramble to get a window seat on a Hawaiian inter-island flight. The views are full of craggy green cliffs, porcelain ocean, and wispy masses of fog and cloud. Sometimes, several islands are visible at once, and it’s not hard to imagine that the archipelago might extend over the entire globe.

That would be a very different planet, and, in fact, a world covered by hotspot volcanoes might have a surface elevation profile somewhat reminiscent of the WMAP image of the temperature fluctuations in the cosmic microwave background. The WMAP image brings to mind a planet covered in Hawaiian islands.

Screen-Shot-2014-12-28-at-10.36.31-PM

Any distribution, \(f(\theta,\phi)\), on the surface of a sphere, be it of temperature, or elevation, or the density of IP addresses, can be expressed as a weighted sum of spherical harmonics

$$f(\theta,\phi)=\sum_{l,m} a_{l,m} Y(\theta,\phi)_{l}^{m}\, ,$$
where the coefficients corresponding to the individual weights, \(a_{l,m}\) are given by
$$a_{l,m}=\int_{\Omega}f(\theta,\phi)Y(\theta,\phi)_{l}^{m \star}d\Omega\, ,$$
and the power, \(C_{l}\) at angular scale \(l\) is
$$C_{l}=\frac{1}{2l+1}\sum_{m=-l}^{l}a_{l,m} {a_{l,m}}^{\star}\, .$$

The power spectrum of the CMB anisotropies peaks at \(l\sim 200\), which corresponds to an angular scale on the sky of \(\Delta \theta \sim 1^{\circ}\), which is very close to the solid angle subtended by the Big Island of Hawaii on the surface of the spherical Earth.

Here’s a recent version of the CMB temperature anisotropy spectrum from the Planck Mission website

Screen-Shot-2014-12-29-at-9.24.16-AM

The peaks in the spectrum of CMB temperature anisotropies stem from acoustic oscillations and diffusion damping in the early universe, and they encode all sorts of information about the fundamental cosmological parameters. This, of course, is very well-known stuff: a search on all literature in the ADS database published since 2000, and ranked by citations, lists Spergel et al. 2003, First-Year Wilkinson Microwave Anisotropy Probe (WMAP) Observations: Determination of Cosmological Parameters at #1, with 7,914 citations and (rapidly) counting.

Given the similarity between the angular scales of the Hawaiian islands and the main CMB peak, it’s interesting to compute the angular power spectrum of Earth’s bedrock elevation profile. A global relief dataset with one arc-minute resolution is available from NOAA as a 4GB (uncompressed) file. Downsampling by a factor of 100, and applying the “terrain” color map yields a familiar scene

Screen-Shot-2014-12-29-at-10.33.14-AM

Computing the power in the first 108 angular modes of the relief distribution in the above data set gives a spectrum that is weighted toward continents and ocean basins rather than archipelagos. There is a pronounced peak at \(l=5\) that reflects the typical angular scale of continents and ocean basins.

figureAng_1

Here is the global relief distribution obtained by summing just the \(l=5\) contributions. It’s right for more or less the same reason that Crates of Mallus was right:

Screen-Shot-2015-01-01-at-6.06.04-PM

Using all 108 angular mode families to reconstruct the image gives a fairly credible-looking world map. It’s as if the watercolors ran slightly before they dried. Most critically, the \(l=108\) reconstruction fails to capture the highest peaks and the lowest ocean trenches, and hence more of the dynamic range of the color map is distributed across the globe.

Screen-Shot-2014-12-31-at-6.06.04-PM

Degree-wide islands like Hawaii are the exception rather than the rule on Earth’s surface. I believe that this was the concept that former US Vice President Dan Qualye was struggling to express in one of his much-ridiculed pronouncements:

Hawaii has always been a very pivotal role in the Pacific. It is IN the Pacific. It is a part of the United States that is an island that is right here.

(See also his comments on Mars.)

Skyscraper

Screen-Shot-2014-12-18-at-4.29.07-PM

A few weeks ago, I had a flight out of LaGuardia Airport in New York City. On the drive there, I caught a distant glimpse of the Manhattan skyline. I was startled to see that it is newly altered. Rising from midtown was a silhouette that seemed both impossibly narrow, and taller than any other skyscraper in the far-off cut-out.

Photo Credit: 432 Park Avenue -- processed screenshot
Original Photo: 432parkavenue.com — Photoshop processed screenshot

The Internet, of course, has the story. 432 Park Avenue — $1.25B, 426 meters, the highest rooftop in the city. Many of its floors, especially the higher ones, are monolithic residences, in the process of acquisition by opaque, limited liability corporations, “bank safe deposit boxes in the sky that buyers can put their valuables in and rarely visit.”

Often, the aesthetic informing such projects veers toward the rococo, but 432 Park is minimalist to the core. Every window of the tower is an exact 10 foot by 10 foot square. From the elaborate on-line galleries, it wholly ambiguous whether the surreal bone-parchment interiors already exist or whether they are virtual. Somewhere, in micrometric accuracies of the digital architectural model, lies the pattern of the seasons, the moment of the equinox, the precise angle of sunlight shafting into the cavernous, unvisited, perhaps as-yet unconstructed rooms.

Like the pyramids at Giza — after they were sealed and before they were robbed.

Dead voices on air

Screen-Shot-2014-12-17-at-10.04.00-PM

This Fall quarter, I taught a class for undergraduates on order-of-magnitude estimation in physics with a focus on astronomical examples. And on the last day of class, with final exams looming, what could be better that the time-tested stress relievers provided by the Fermi Paradox and the Drake Equation?

In Los Alamos National Laboratory publication LA-103110MS, “Where is Everybody?” An Account of Fermi’s Question, Eric Jones describes how Enrico Fermi, Emil Konopinski, Edward Teller, and Herbert York were diverted into their famous lunch-time conversation in the summer of 1950. While walking to the cafeteria, they were discussing news reports of UFOs, and an associated New Yorker cartoon that explained why the public trash cans in New York City were disappearing.

Screen-Shot-2014-12-18-at-8.01.51-AM

The flying saucers of the early 1950s hold a special fascination. A compound of Cold War anxieties — nuclear weapons, communists, infiltrators — they are silvery and remote, icons of minimalist design from a time when the space age was truly, rather than retro- futuristic.

Indeed, much of my own interest in astronomy can be traced to 50’s-era flying saucers. In the Bicentennial summer of 1976, after finishing third grade, I got a paper route delivering the Champaign-Urbana Courier. One of my customers, Mrs. Barbara Houseworth, had a garage full of cast-off books that she collected for an annual drive. I spent a great deal of time examining them whenever I visited to collect the subscription fee. I was particularly drawn to the pulpy paperback books — especially the ones with clay-coated photographic inserts — that covered the Bermuda Triangle, Bigfoot, the Loch Ness Monster, and Flying Saucers. All matters that seemed to merit the most urgent scientific concern.

Screen-Shot-2014-12-18-at-10.57.41-AM

At the top of my list was Gray Barker’s They Knew Too Much About Flying Saucers, published in 1956. I was so taken with it that Mrs. Houseworth simply gave me the book.

FullSizeRender

Gray Barker was an intriguing character, a closeted gay man in mid-century West Virginia who took a certain delight in channeling the fears and neuroses of the American masses into money-making volumes. Barker’s invention of the three men in dark suits, in particular, achieved a lasting cultural resonance. There is more about him at the UWV Center for Literary Computing, and he is the subject of several recent documentaries.

saucerfilmstills

The message in the Cold War flying saucer books was crystal clear. Watch the Skies. And I did — on many clear dark Central Illinois nights with a Sears catalog 50mm refracting telescope…

Back to Friday’s class. We adopted the following form for the Fermi-Drake equation
$${N} = \Lambda ~f_{\star \rm{app}}~f_{\rm pl}~f_{\rm quqHP}~f_{\rm life}~f_{\rm macro}~f_{\rm intel}~f_{\rm tech}~L\,,$$
where \(N\) is the number of broadcasting civilizations in the galaxy, \(\Lambda\) is the number of stars formed per year in the Milky Way, \(f_{\star \rm{app}}\) is the fraction of stars with main sequence lifetimes long enough to support the development of a broadcasting civilization, \(~f_{\rm pl}\) is the fraction of stars with planets, \(~f_{\rm HP}\) is the average number of “habitable” planets per star, \(~f_{\rm life}\) is the fraction of these habitable planets that develop life, \(~f_{\rm macro}\) is the fraction of life-bearing planets that develop macroscopic life, \(~f_{\rm intel}\) is the fraction of macroscopic life-bearing planets that develop an “intelligent” life form (e.g. one that can orient itself abstractly in time), \(~f_{\rm tech}\) is the fraction of intelligent species that develop an understanding of the Maxwell Equations and build radios, and \(L\) is the civilization lifetime in years.

We defined and estimated two versions of \(L\). \(L_{\rm radio}\) is the average length of a time that a civilization leaks modulated electromagnetic signals into space. \(L_{\rm extinct}\) is the lifetime of the civilization, marked from the understanding of Maxwell’s equations to the point where the equations are collectively no longer understood.

The first few terms in the equation have been elevated from the realm of science fiction. I’ve adopted values of \(~\Lambda=10\,{\rm stars~yr^{-1}}\), \(~f_{\star \rm{app}}=0.75\), and \(~f_{\rm pl}=0.75\). Note that \(~\Lambda=10\,{\rm stars~yr^{-1}}\) is admittedly on the high side, even for 4.5 Gyr ago when star formation was somewhat more prevelant in the Galaxy.

Here is the table of values for the unknown terms, as estimated by the class members. I tried not to influence the results by telegraphing currently fashionable guesses. Twenty responses were collected:

\(f_{\rm HP}\) \(f_{\rm Life}\) \(f_{\rm Macro}\) \(f_{\rm Intel}\) \(f_{\rm Tech}\) \(L_{\rm Radio}\) \(L_{\rm Extinct}\)
0.10 0.01 0.3 0.1 0.2 1000 100000
0.10 0.70 0.01 0.6 0.001 500 10000
0.40 0.60 0.01 0.1 0.9 500 3000
0.20 0.90 0.08 0.4 0.002 500 500
0.01 0.90 0.05 0.001 0.2 1000 10000
0.01 0.1 0.1 0.01 0.001 1000 1000
0.10 0.01 0.1 0.1 0.01 100 1000
0.40 0.1 0.05 0.5 0.6 100000000 1000000
0.01 0.4 0.01 0.01 0.9 1000 10000
0.30 0.001 0.032 0.6 0.001 200 200
0.01 0.8 0.1 0.7 0.9 1000 1000
0.10 0.0001 0.01 0.001 0.02 500 150
0.10 0.2 0.1 0.01 0.1 10000 100000
0.10 0.9 0.25 0.01 0.5 10000 500000
0.30 0.001 0.01 0.6 0.9 500 3000
0.30 0.05 0.3 0.01 0.01 1000 1000
0.10 0.01 0.1 0.00001 0.00000001 300 5000
0.30 0.01 0.00001 0.01 0.0001 5000 5000
0.05 0.01 0.03 0.3 0.015 1000 150
0.02 0.01 0.1 0.01 0.001 100 100

With results:

Civilizations Currently Broadcasting in the Milky Way Galaxy
Average # 16,875
Median # 0.0016
Standard deviation 73,500
Max 337,500
Min 2.8125e-13

Civilizations Currently Present in the Milky Way Galaxy
Average # 185
Median # 0.013
Standard deviation 735
Max 3,375
Min 2.8125e-13

A smooth distribution of estimates for \(~{N}\) can be generated by drawing randomly from the list of estimates for each uncertain term in the equation, and then repeating for many estimates of \(~{N}\). Here are the histograms of estimates for the number of civilizations broadcasting from the galaxy and the number of civilizations present in the galaxy. The \(x\)-axes are \(\log_{10}N\).

Screen-Shot-2014-12-18-at-4.29.07-PM

The estimates point to the possibility that a civilization broadcasts for longer than intelligent members of the species exist. Two people implied this, by submitting values \(L_{\rm radio}>L_{\rm extinct}\). Looking at the table, there is one case where \(L_{\rm radio}\gg L_{\rm extinct} \gg \langle L \rangle\). The large values for \(L\) submitted by this person are causing the Average estimate for \(~{N}\) to substantially exceed the median estimate for \(~{N}\).

Adopting the \({ N=0.002}\) median of this distribution implies we need to look through \(\sim{n=500}\) galaxies to find the nearest broadcasting civilization, and that our nearest neighbors are \(\sim{ 8}\) Megaparsecs away. By the time one receives a message and replies to it, the intended recipient has long since gone extinct.

Rocket Summer

Screen-Shot-2014-12-13-at-12.12.56-PM

In 1997, Ray Bradbury’s The Martian Chronicles was reissued by William Morrow Press. It’s a book that’s on my shelf.

In the original edition, published in 1950, the stories were set in what is now the present day, starting with Rocket Summer, dated to January 1999, and ending with The Million Year Picnic, set in October 2026.

Screen-Shot-2014-12-13-at-12.12.27-PM

For the 1997 edition, the dates for the stories were all pushed back by thirty one years. The rocket summer still lies sixteen years in the future, but the imposed literary device seems hollow, stop-gap, ineffective. Mars of 1950 is a forever different world than Mars of today, which, satisfyingly, is also populated by two waves of explorers from Earth. Meteor-borne archeobacteria, perhaps still clinging to existence in the warmth of the deep subsurface, and a cadre of faintly autonomous, sometimes faintly anthropomorphic robots and satellites that pine eagerly for attention on social media. 2836 tweets. 1.76M followers.

Screen-Shot-2014-12-13-at-12.25.39-PM

50 oklo

Screen-Shot-2014-12-07-at-2.28.58-PM

In writing about the rise of the data centers earlier this year, I suggested the “oklo” as the cgs unit for one artificial bit operation per gram per second. That post caught the eye of the editor at Nautilus Magazine, who commissioned a longer-form article and a series of short interviews, which are on line here.

In writing the Nautilus article, it occurred to me that the qualifier “artificial” is just that: artificial. A bit operation in the service of computation should stand on its own, without precondition, and indeed, the very word oklo serves to reinforce the lack of any need to draw a distinction. The Oklo fossil reactors operated autonomously, without engineering or direction more than two billion years ago. In so doing, they blurred snap-judgment distinctions between the natural and the artificial.

Several years ago, Geoff Manaugh wrote thoughtfully about the Oklo reactors, drawing a startling connection to a passage in the second of William S. Burroughs’s cut-up novels:

I’m reminded again here of William Burroughs’s extraordinary and haunting suggestion, from his novel The Ticket That Exploded, that, beneath the surface of the earth, there is “a vast mineral consciousness near absolute zero thinking in slow formations of crystal.” Here, though, it is a mineral seam, or ribbon of heavy metal—a riff of uranium—that stirs itself awake in a regularized cycle of radiative insomnia that disguises itself as a planet. Brainrock.

Revising the definition,

1 oklo = 1 bit operation per gram of system mass per second,

brings the information processing done by life into consideration. Our planet has been heavily devoted to computation not just for the past few years, but for the past few billion years. Earth’s biosphere, when considered as a whole, constitutes a global, self-contained infrastructure for copying the digital information encoded in strands of DNA. Every time a cell divides, roughly a billion base pairs are copied, with each molecular transcription entailing the equivalent of ~10 bit operations. Using the rule of thumb that the mass of a cell is a nanogram, and an estimate that the Earth’s yearly wet biomass production is 1018 grams, this implies a biological computation of 3×1029 bit operations per second. Earth, then, runs at 50 oklo.

Using the Landauer limit, Emin=kTln2, for the minimum energy required to carry out a bit operation, the smallest amount of power required to produce 50 oklo at T=300K is ~1 GW. From an efficiency standpoint, DNA replication by the whole-Earth computer runs at about a hundred millionth of the theoretical efficiency, given the flux of energy from the Sun. The Earth and its film of cells does lots of stuff in order to support the copying of base pairs, with the net result being ~200,000 bit operations per erg of sunlight globally received.

Viewed in this somewhat autistic light, Earth is about 10x more efficient that the Tianhe-2 supercomputer, which draws 17,808KW to run at 33.8 Petaflops.


optical data transmissions

Screen-Shot-2014-11-28-at-6.24.11-PM

The amount of information that can be carried on a laser diode-driven fiber optic cable is staggering. The current state-of-the-art is of order a petabit per second over 50 km, with a direct power consumption of order 100 milliwatts, as described in this press release from NTT, and in primers on optical communication.

When data is transmitted via optical fiber, no signal leaks into space at all (other than a trivial quantity of waste heat). From the standpoint of eavesdropping civilizations, Earth is going dark, presenting a fashionable and much-remarked potential solution to the Fermi Paradox.

To order of magnitude, fiber optic cables currently employ 10^-16 ergs to transmit one bit of information over a distance of one centimeter. It’s interesting to compare this with the energy throughput and transmission efficiency of the first recorded description of an optical information transmission network.

In The Information — A History  A Theory A Flood, James Gleick draws attention to a passage that appears in Aeschylus’ Agammemon describing how a chain of eight signal bonfires transmitted the news of Trojan defeat over the course of a single night to Clytemnestra, scheming, four hundred miles away in Sparta.

Aeschylus’ full passage is worth tracking down and is thrilling to read; a satisfyingly direct antecedent to NTT’s press release describing their record-setting petabyte per second optical data transmissions.

LEADER:

Yet who so swift could speed the message here?

CLYTEMNESTRA:

From Ida’s top Hephaestus, lord of fire,
Sent forth his sign; and on, and ever on,
Beacon to beacon sped the courier-flame.
From Ida to the crag, that Hermes loves,
Of Lemnos; thence unto the steep sublime
Of Athos, throne of Zeus, the broad blaze flared.
Thence, raised aloft to shoot across the sea,
The moving light, rejoicing in its strength,
Sped from the pyre of pine, and urged its way,
In golden glory, like some strange new sun,
Onward, and reached Macistus’ watching heights.
There, with no dull delay nor heedless sleep,
The watcher sped the tidings on in turn,
Until the guard upon Messapius’ peak
Saw the far flame gleam on Euripus’ tide,
And from the high-piled heap of withered furze
Lit the new sign and bade the message on.
Then the strong light, far-flown and yet undimmed,
Shot thro’ the sky above Asopus’ plain,
Bright as the moon, and on Cithaeron’s crag
Aroused another watch of flying fire.
And there the sentinels no whit disowned,
But sent redoubled on, the hest of flame
Swift shot the light, above Gorgopis’ bay,
To Aegiplanctus’ mount, and bade the peak
Fail not the onward ordinance of fire.
And like a long beard streaming in the wind,
Full-fed with fuel, roared and rose the blaze,
And onward flaring, gleamed above the cape,
Beneath which shimmers the Saronic bay,
And thence leapt light unto Arachne’s peak,
The mountain watch that looks upon our town.
Thence to th’ Atreides’ roof-in lineage fair,
A bright posterity of Ida’s fire.
So sped from stage to stage, fulfilled in turn,
Flame after flame, along the course ordained,
And lo! the last to speed upon its way
Sights the end first, and glows unto the goal.
And Troy is ta’en, and by this sign my lord
Tells me the tale, and ye have learned my word.

Given that the message was one bit, the signal coding was at the Shannon Limit. The route can be correlated with current-day geographic features,

Screen-Shot-2014-11-28-at-6.18.03-PM

and then traced out in Google Earth:

Screen-Shot-2014-11-28-at-6.17.44-PM


The bonfire on Mt. Ida that signaled the end of the Trojan War probably consumed about a cord (3.62 cubic meters) of wood and emitted about 5×10^12 ergs/sec over a span of an hour, for a transmission efficiency of order 10^9 ergs per centimeter per bit. A mere three thousand years has brought twenty five orders of magnitude of improvement.

With the take-away being that the quality of the message is likely superior in importance to the quantity.