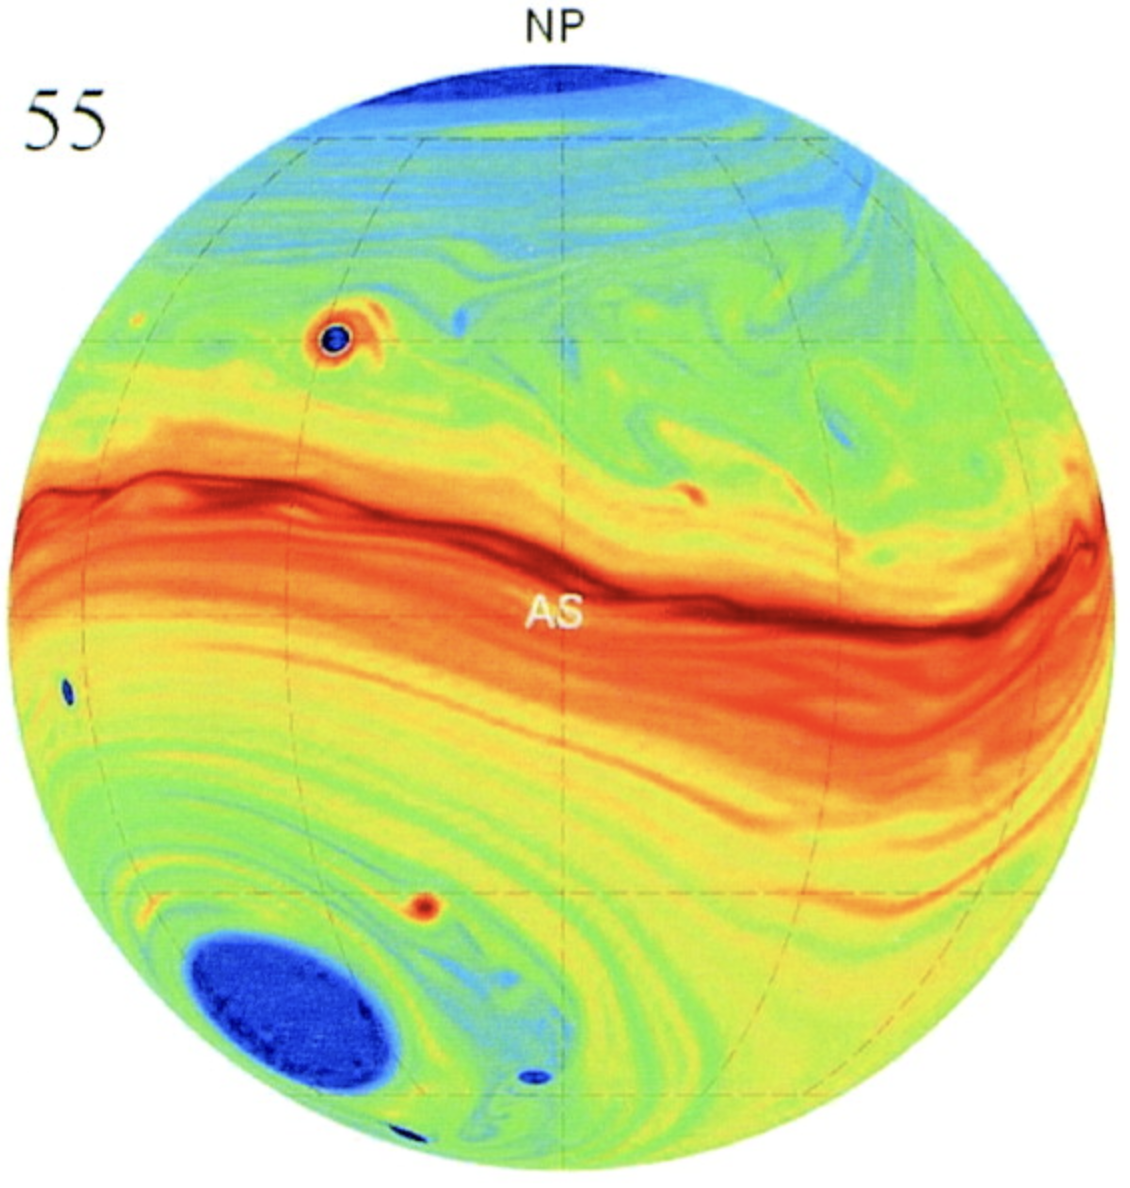
One of the strongest exoplanet graphics of the early aughts was James Cho’s map for HD 209458b. Upon first seeing it, the transit light curve was suddenly revealed as a world. Had Cho simply plotted temperature or wind velocity, the figure would have been vastly less compelling.
The key was to plot the equivalent-barotropic potential vorticity,
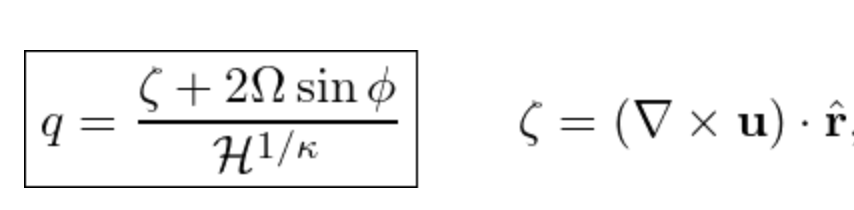
which critically, contains the the curl of the velocity, u, and thus correlates with the tendency of a microscopic paddle-wheel placed in the flow to spin with more or less angular velocity in one or the other direction.
Inspired by this, it’s interesting to take the curl of the swing maps that show the shifts in voting patterns from one election cycle to the next. Here, an agent (obviously) downloaded the US Midterm results from last night, and produced nationwide maps of the curl of the swing vector field with various weightings, all of which generate the same basic overall patterns.
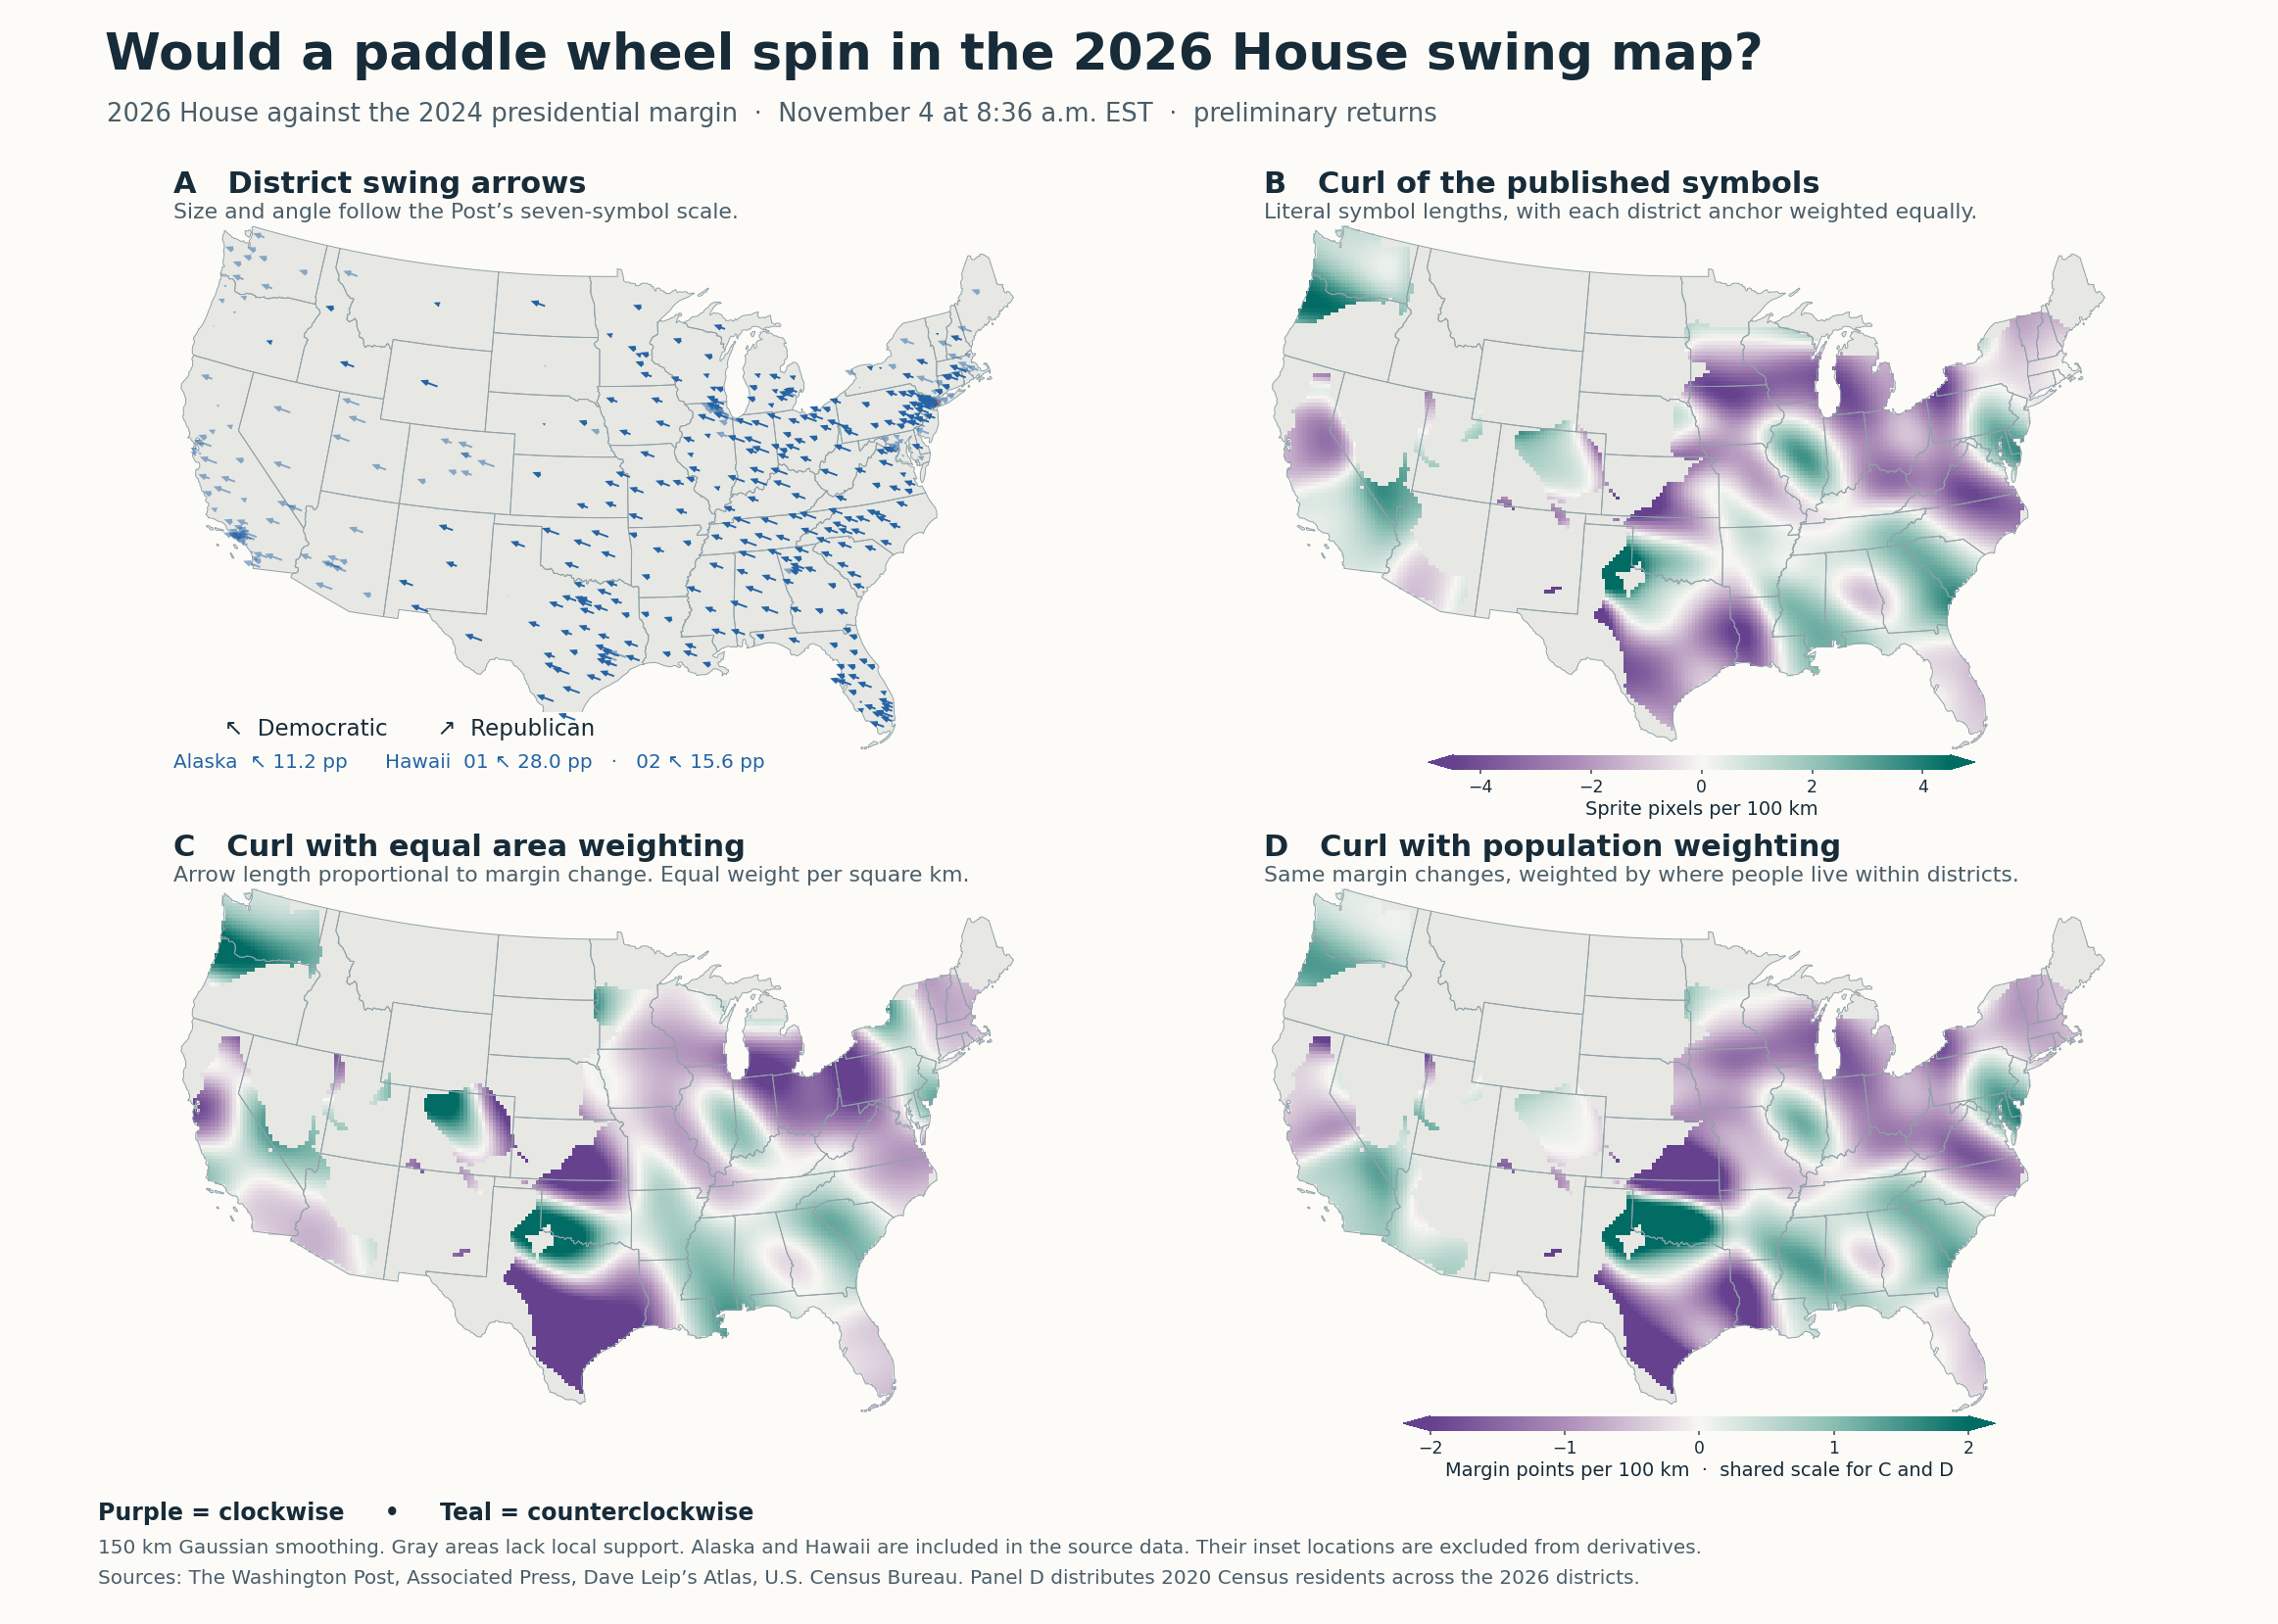
It’s interesting to compare this to 2024 (get your agent to try it), and to think geopolitically about the interpretation…