
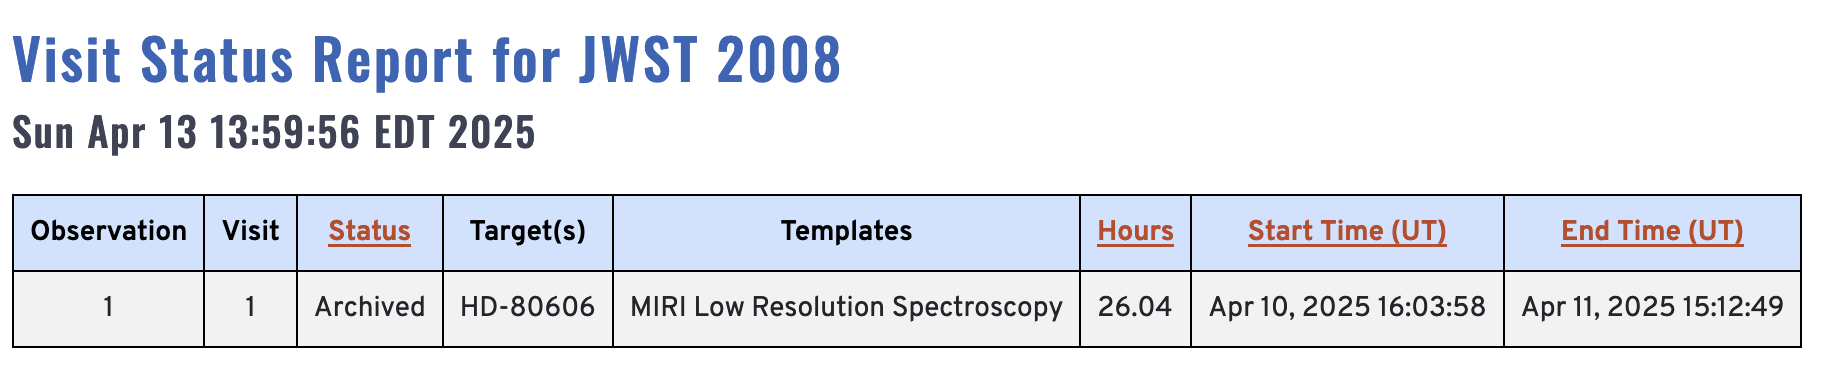
During this most recent ‘606 day, JWST observed HD80606 for 21 hours using the MIRI instrument.
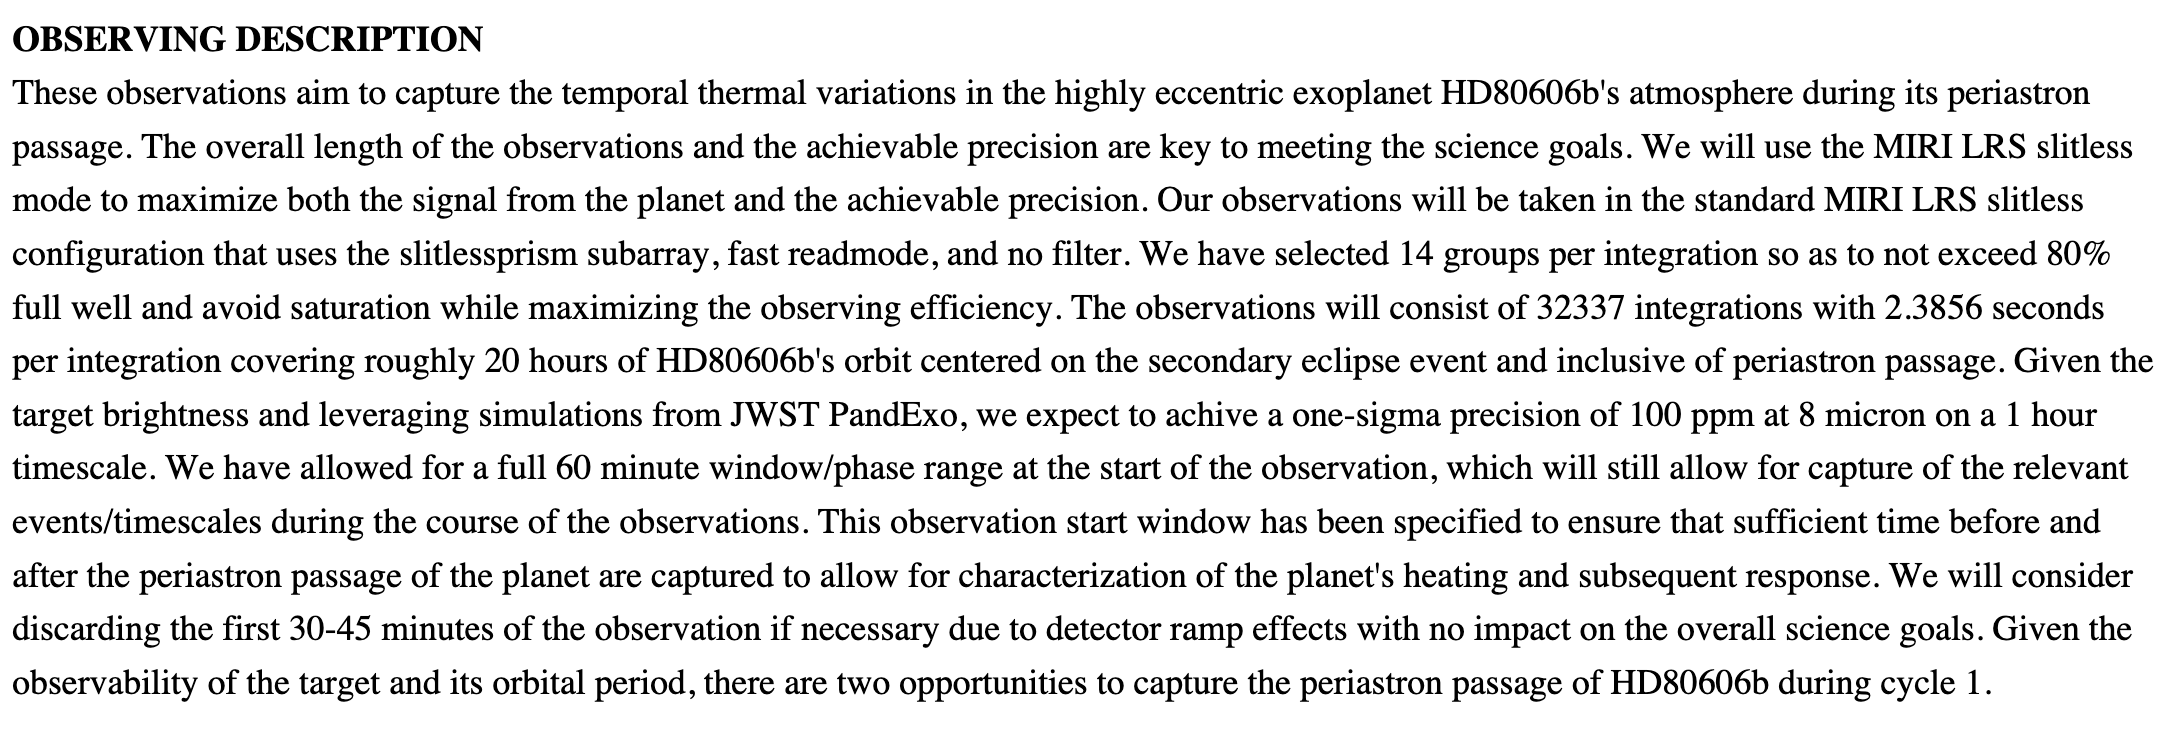
Looking at the archive, it appears that the program was successfully completed.
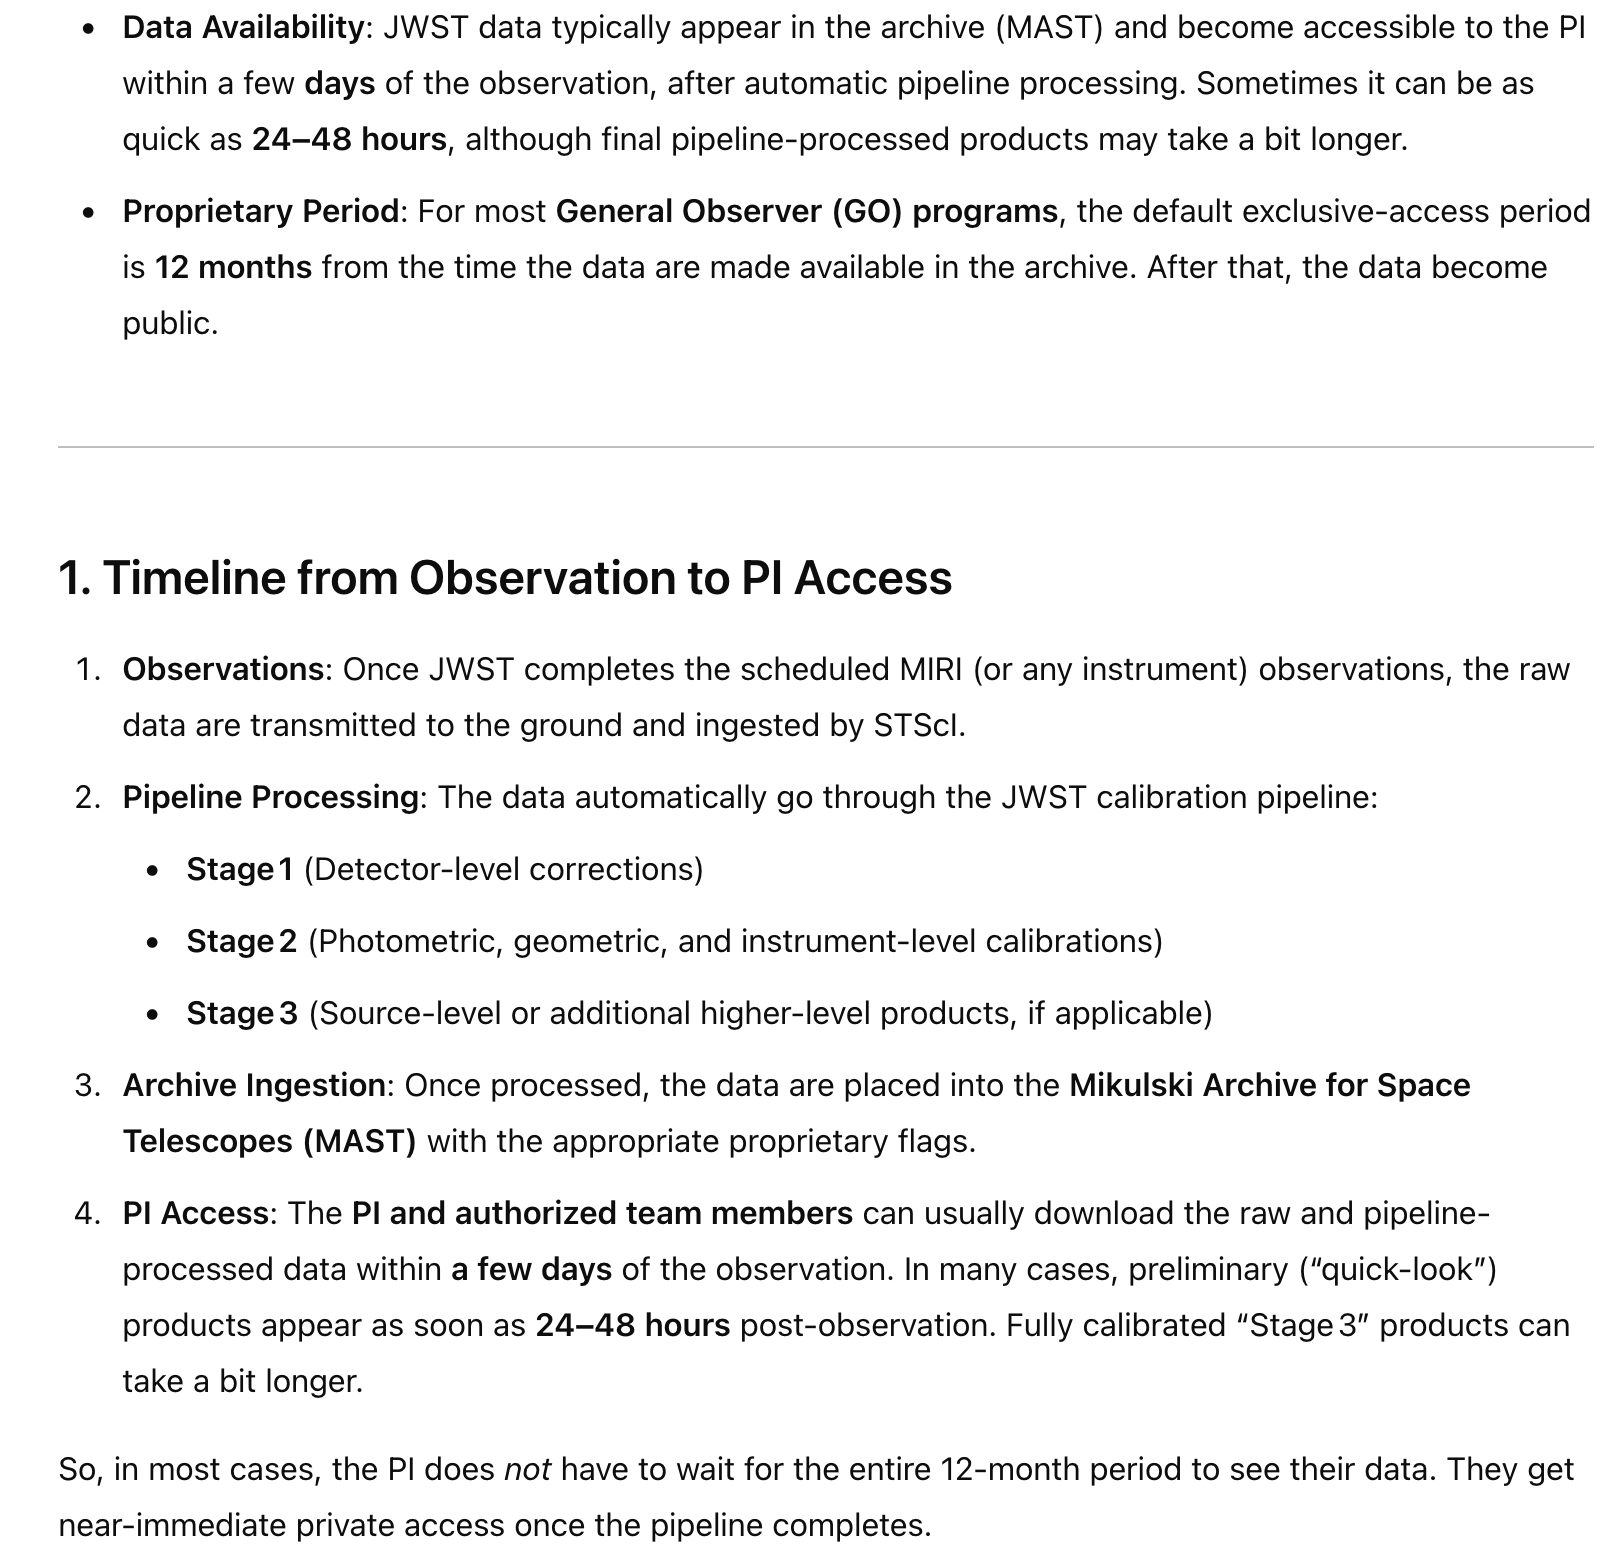
I asked ChatGPT for a run-down regarding the steps taken by the JWST science operations to process and calibrate the raw data to produce files accessible by the P.I. of the observations:
This was sufficient to rouse me in to action, flooded with nostalgia for those good old days, but with a certain steely-eyed cynicism that comes from decades spent on repeated never-quite-definitive quests to extract signal from noise. The world is non-Gaussian.
HD 80606b may be unique in that it’s a Y2K-vintage planet that’s still weird enough to be observed by JWST in a long-duration manner to produce a photometric time-series that can be directly compared with the old observations that were obtained by NASA’s Spitzer Infrared Observatory. I’m beginning to think that this might be quite a significant deal. Consider the iconic Spitzer run-down of HD 187133:
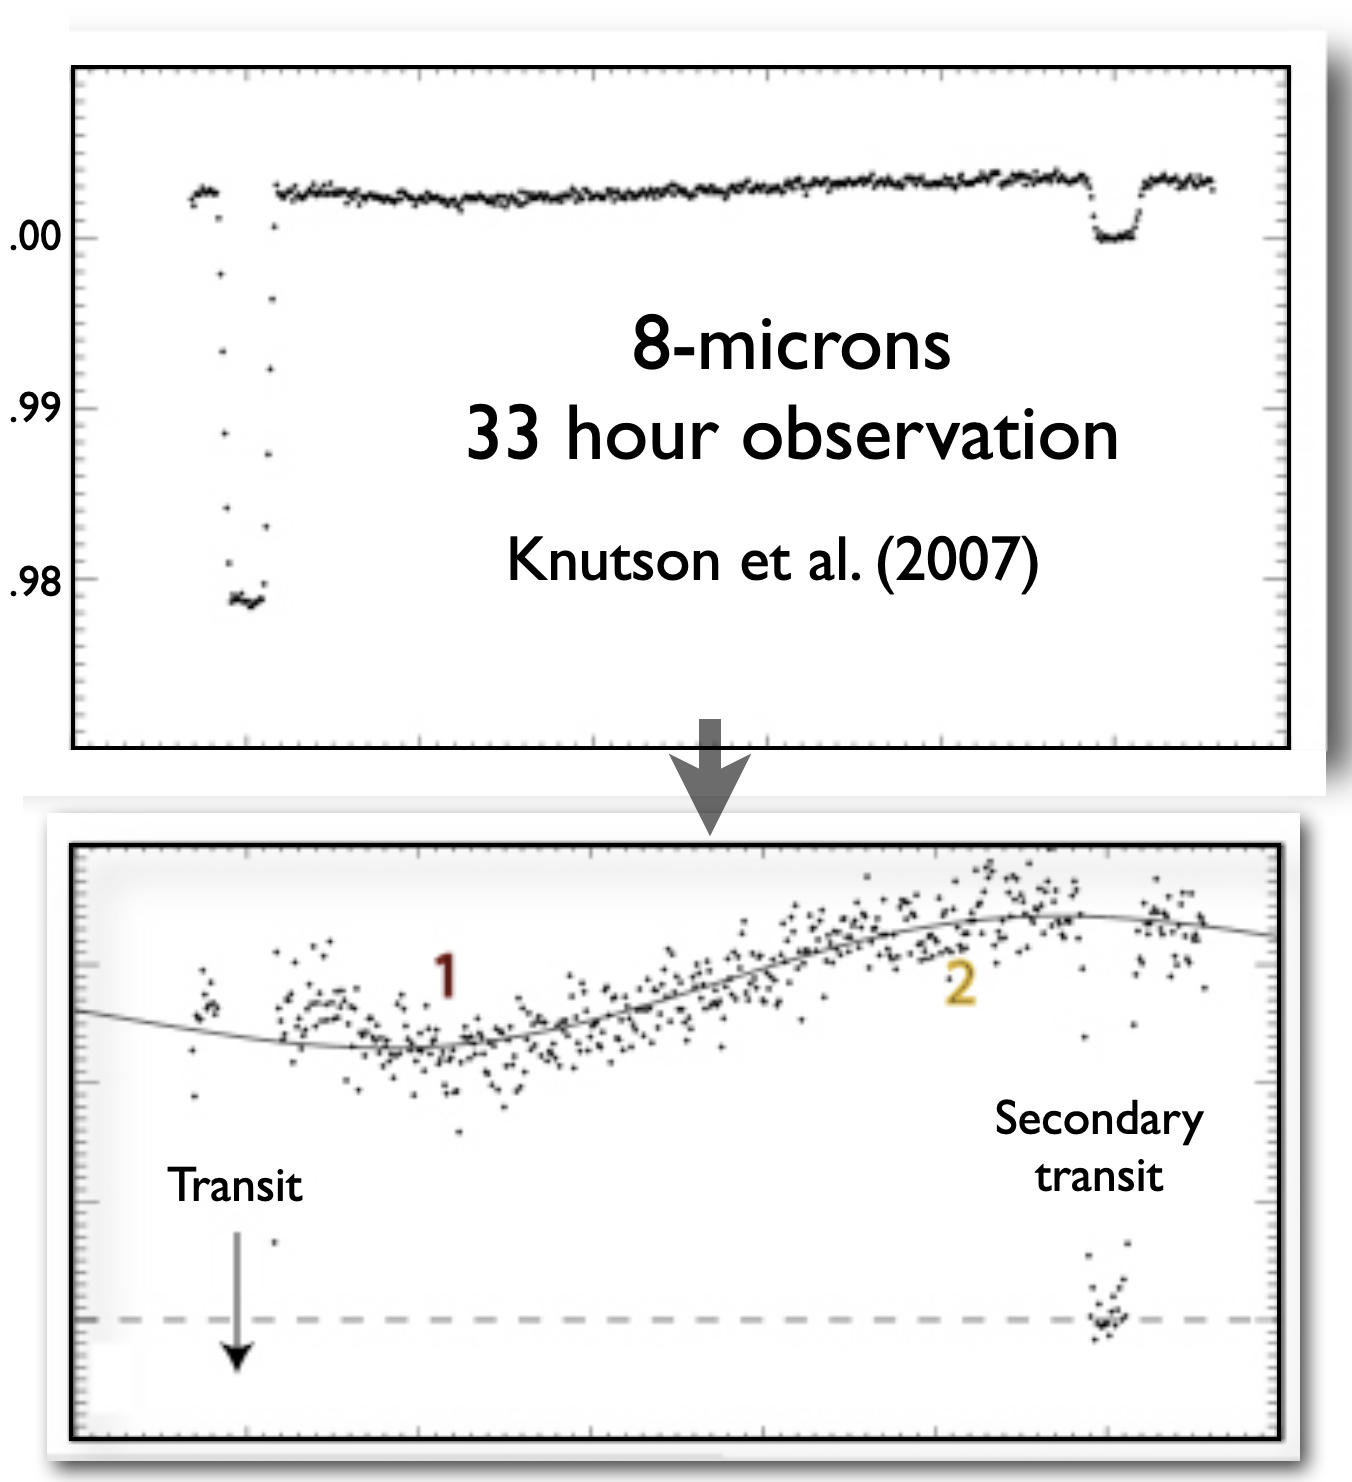
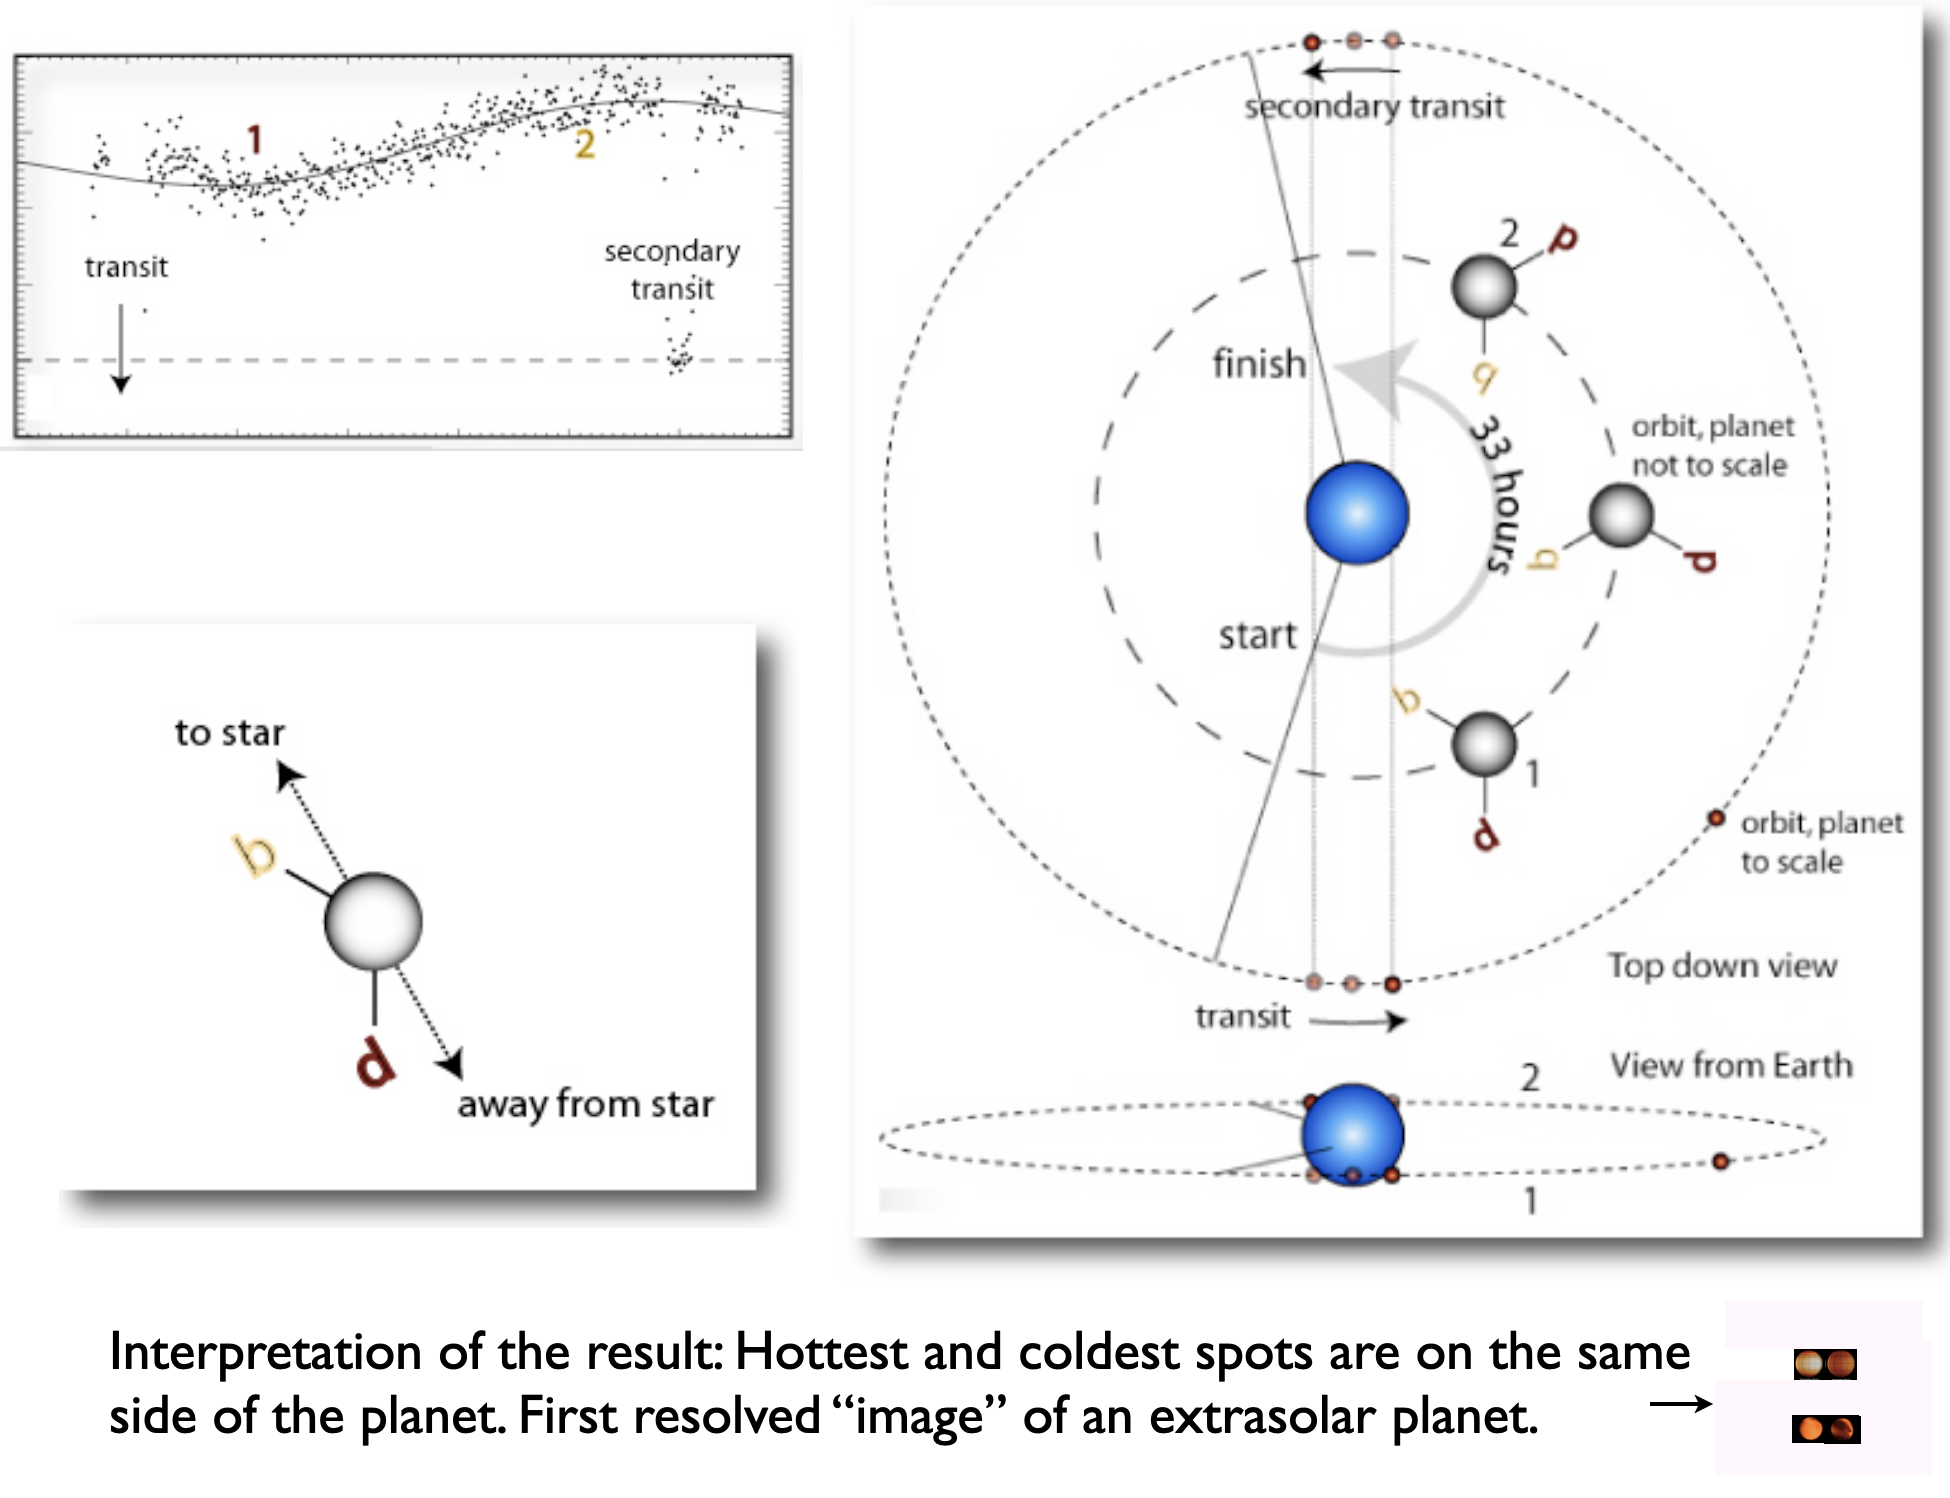
The geometry of the observation and the interpretation for what the planet was doing was as follows. Note that this assumes synchronous rotation holds:
Look at the spike in the photometry that immediately follows the transit. What’s going on there? Must be systematics stemming from the detection ramp. But, then, how do we know that the systematics are isolated to that one odd feature in the light curve? We don’t know.
The Spitzer full-phase photometric curves are rife with systematics. It’s a problem that has never been fully addressed. Where the extrasolar planets are concerned, interpretation has always run out way ahead of the data.
Coincidentally, a new paper on JWST observations of HD187133 was just published. The narrative jumps straight to the maps of the planet, with the goal of improving on those low-resolution thumbnails in the lower-right hand corner of the panel above. The full phase curve — which for Spitzer was certainly impacted by systematics — is not being observed by JWST. As a consequence, it’s unclear whether the remarkable Spitzer data can be replicated (and at what S/N) and moreover, if one looks at the lists of approved proposals, there are many many .pdfs that outline observations that push the optimistic limits.
In contrast to the situation with HD 189733, the first General Observing Cycle for JWST contained two independent HD 80606 programs that replicate long-duration Spitzer campaigns. These two JWST observational programs very similar in spirit. The first obtained a bit less than a day of continuous spectrophotometric data of the events surrounding periastron passage in the 3.8-5.2 micron band. The second (tied to that ‘606 day campaign that wrapped up yesterday) does essentially the same thing at 7-9 microns.
I looked back through my notes from 2007 and found some simulation results that were used to justify the original HD 80606 long-duration photometry sequence obtained by Spitzer during the cryogenic phase of its mission. We used a 2D-hydrodynamics scheme to compute what the emission from the planet should look like at Spitzer’s five photometric bands, and came up with the following then-best-effort diagram:
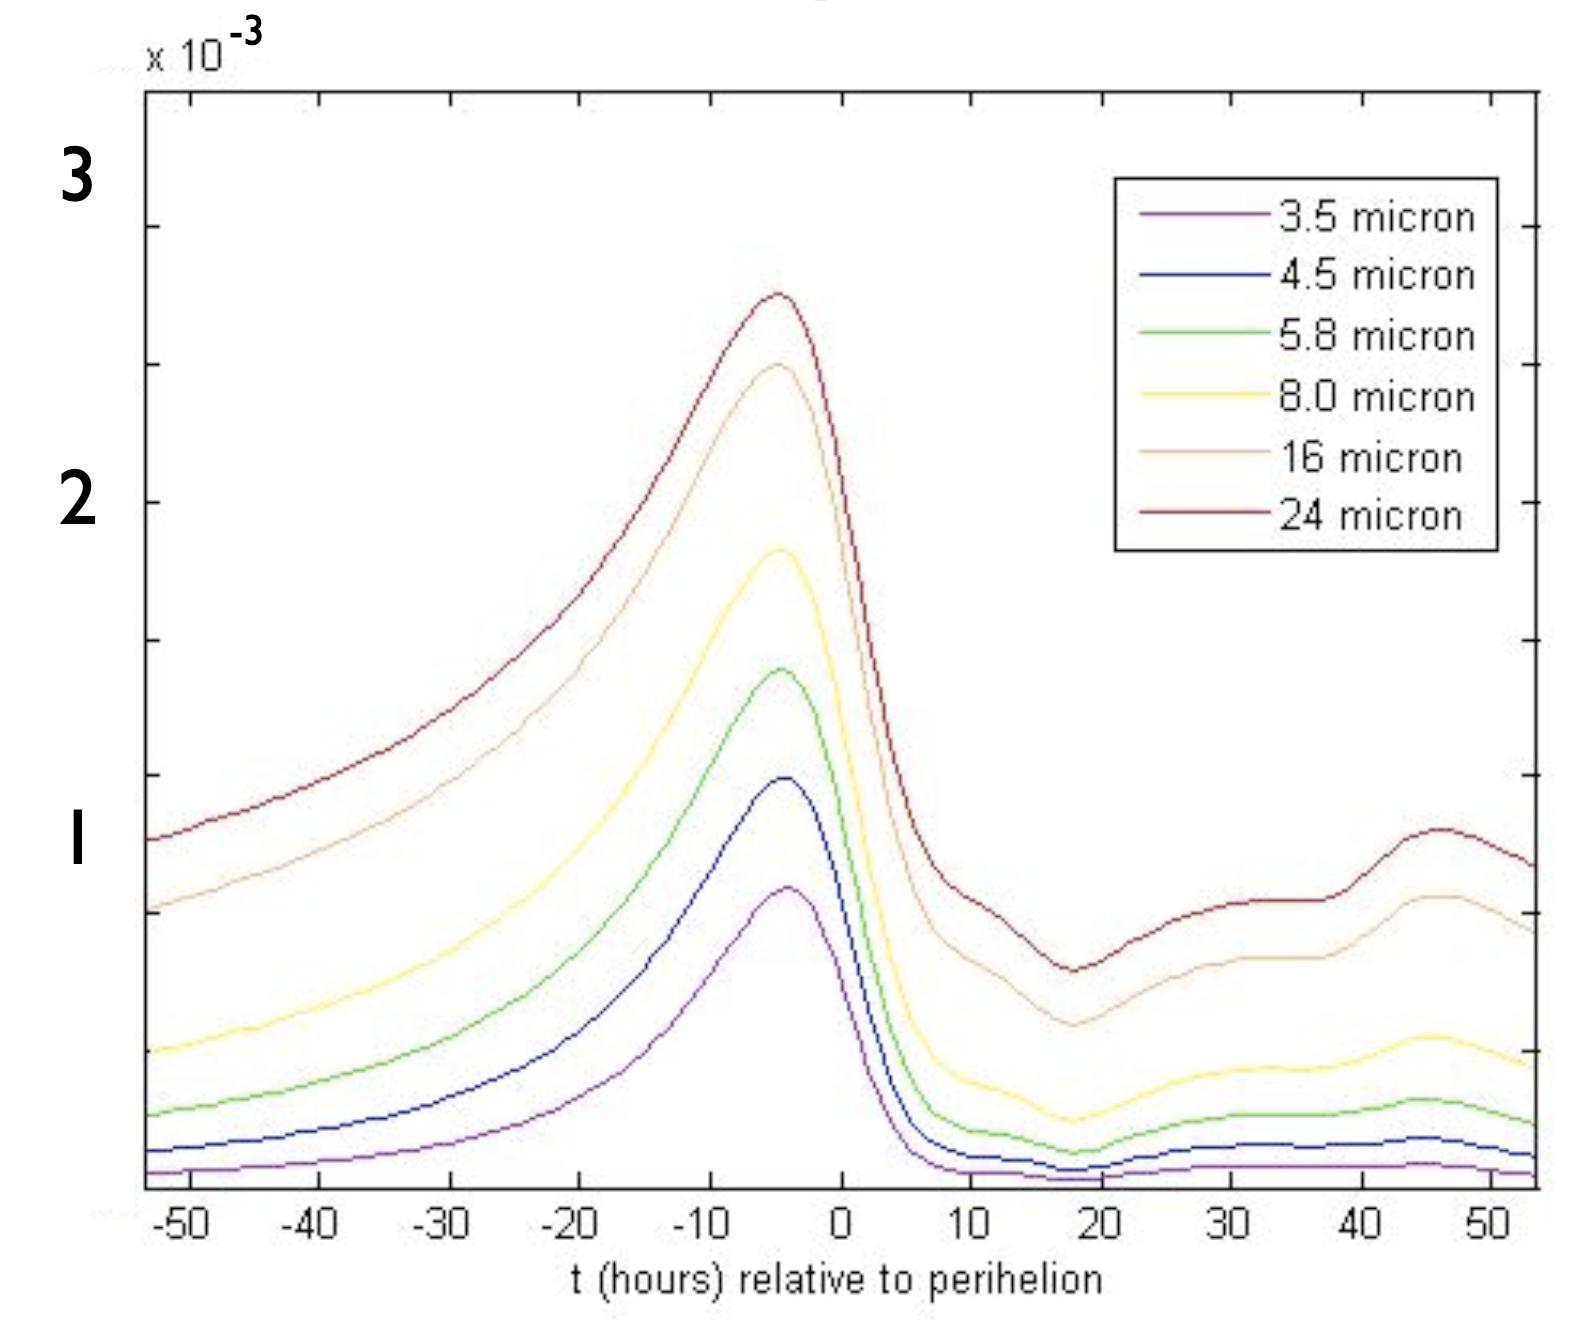
The resurgence in flux at 45 hours stems from the sun-blasted hemisphere of the planet pseudo-synchronously rotating back into view. The curves rely on exo-planetary properties that had never been measured, so they were necessarily uncertain. Bottom line, it was effectively fishing expedition, as nothing like HD 80606b had ever been observed.
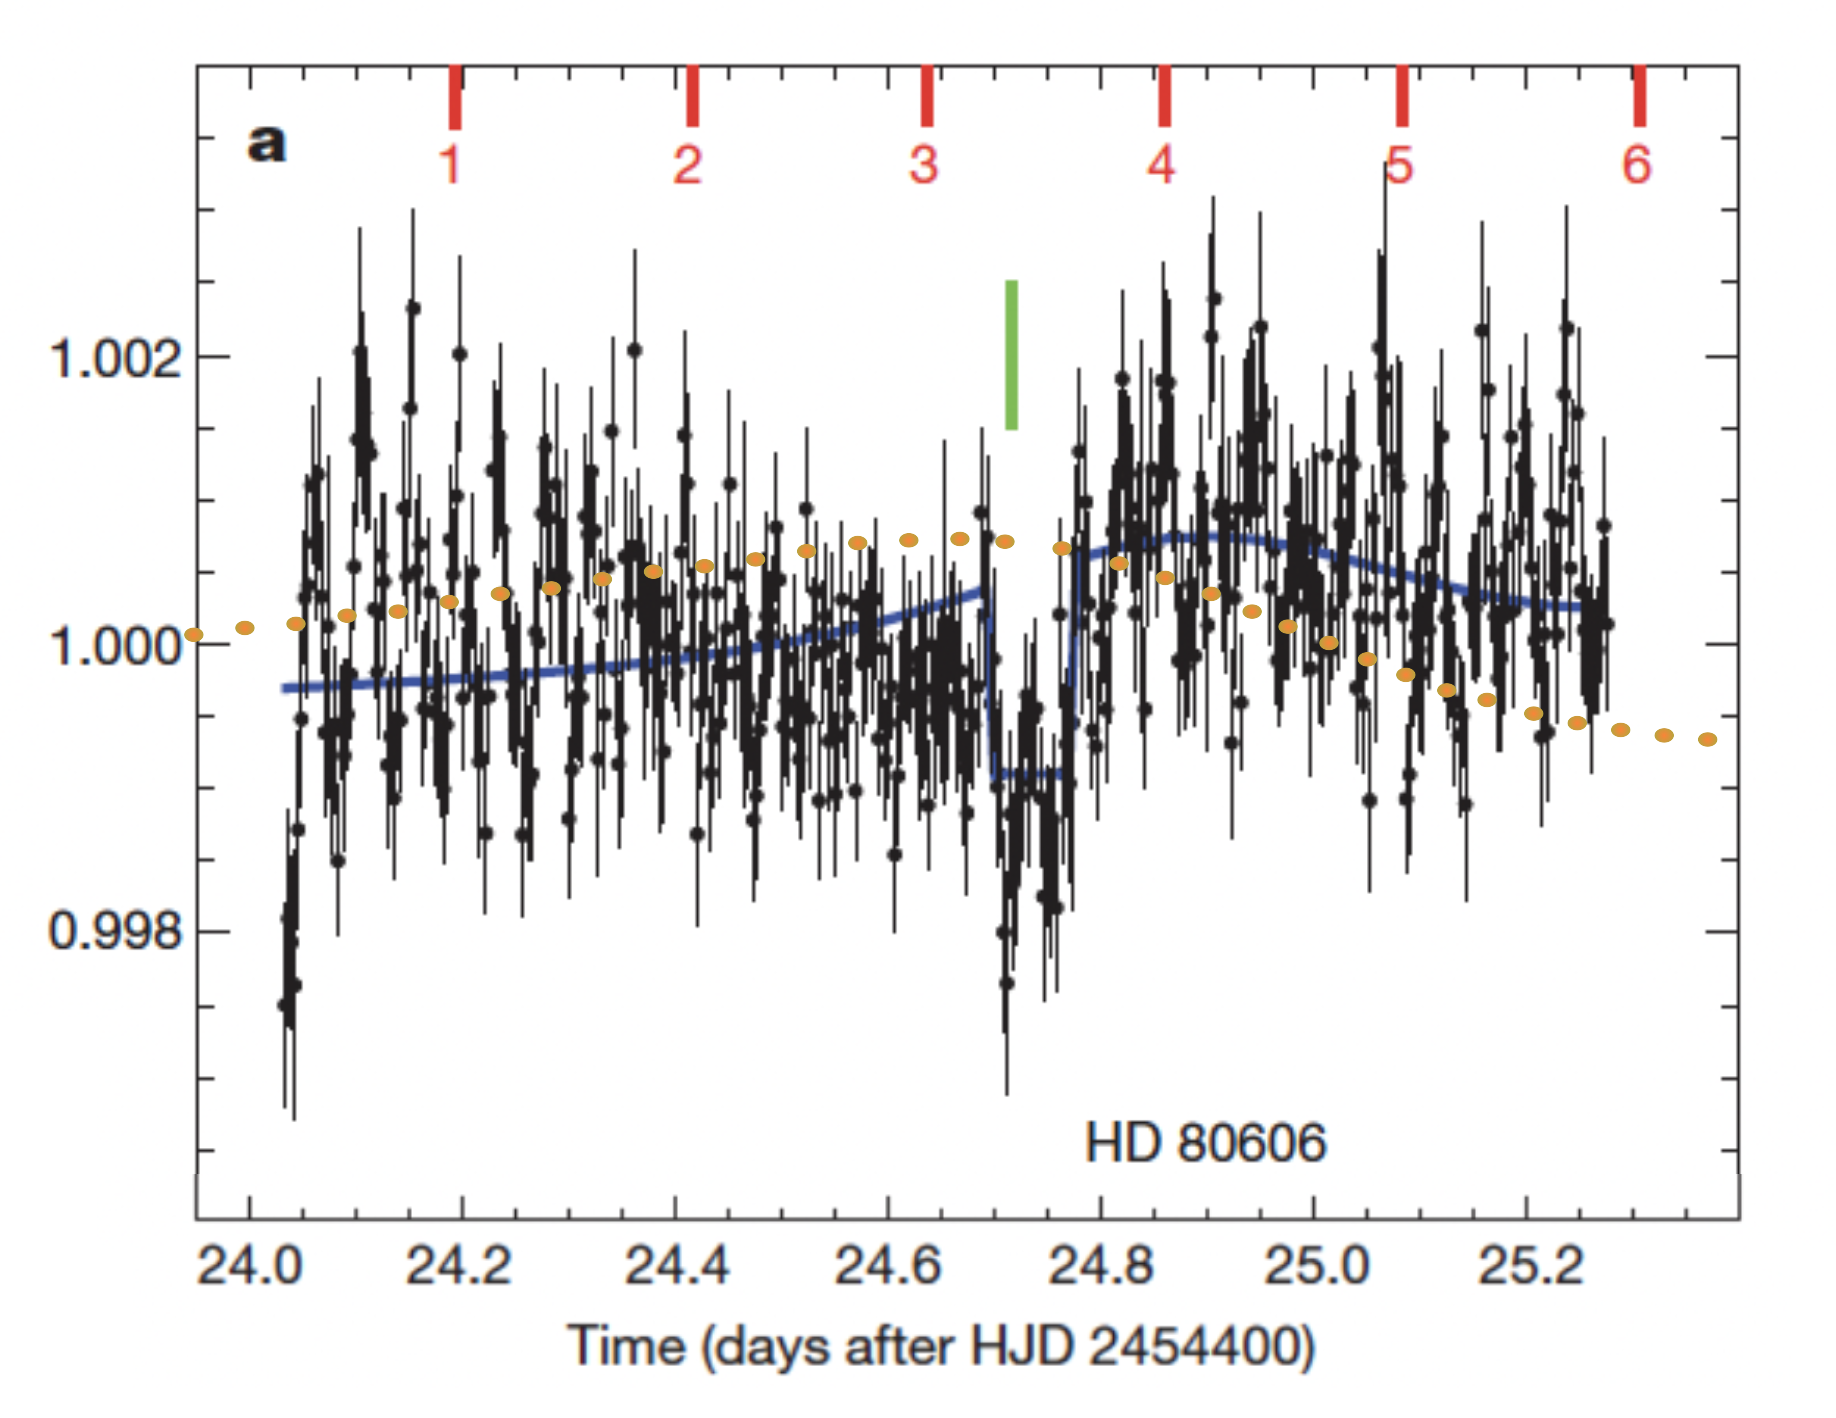
Moreover, at the time of the proposal, HD 80606’s orbital inclination to the plane of the sky wasn’t known. There was a 15% a-priori chance that a secondary eclipse would occur, and we got lucky. It did occur. Placing the yellow 8-micron prediction on the actual data gives this diagram:
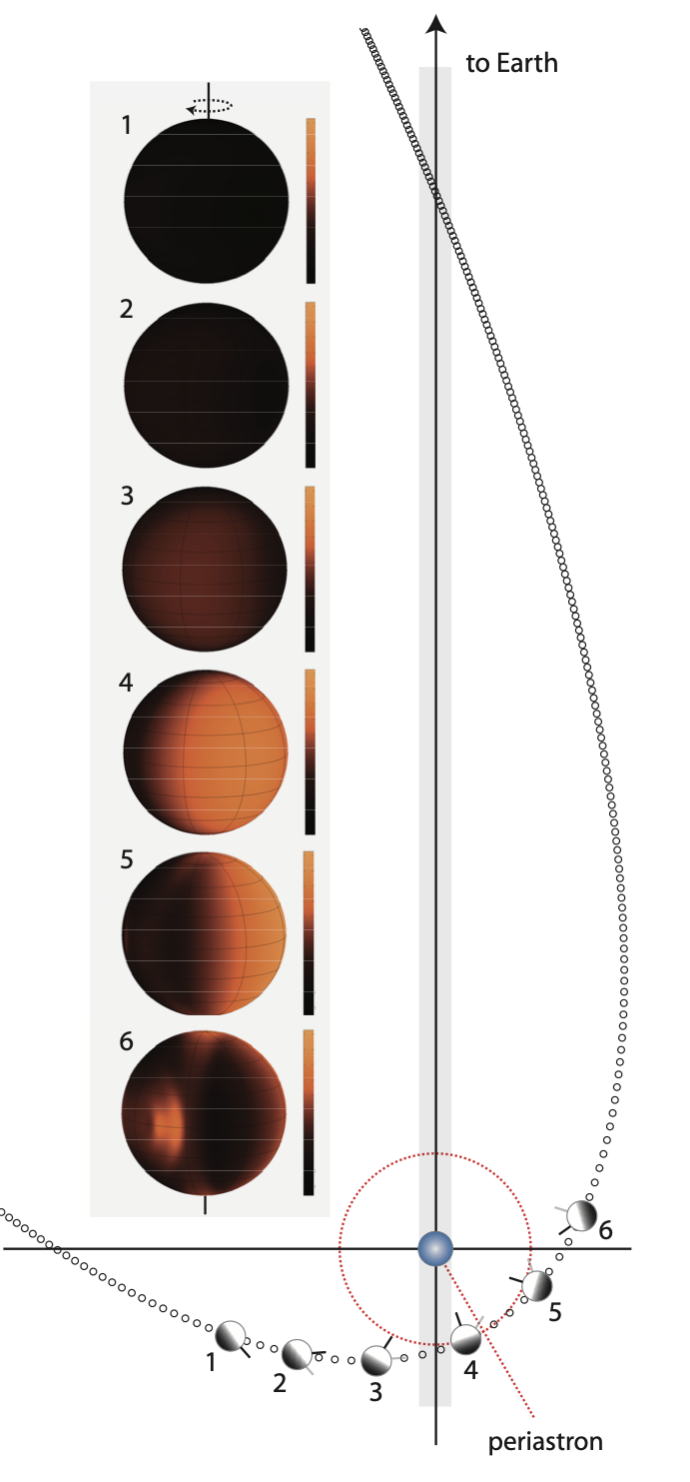
The light curve can be compared with the geometry of the encounter:
The exciting result was that the planet clearly undergoes secondary transit. The disappearance of flux when the planet was behind the star unambiguously demonstrates that the photometric light curve is not all just systematics (although if one looks at it closely, systematic trends are likely present — notice how the flux seems to steadily decline prior to the start of the secondary eclipse).
Once we were in possession of the observations, the parameter deck for the hydrodynamics code could be duly and systematically varied, and a model simulation was found that provided a fit to the data. This is the blue line that runs through the photometry. We discovered that the key to getting a plausible match to the planet’s measured light curve is to adopt a short radiative timescale at the 8-micron photosphere. In keeping with widespread practice, the parameter choices that guided the simulations that supported the observing proposal were not extensively discussed in the resulting paper. If one had it to do over, it’d be better to ensure that the initial prediction and the initially predicted S/N were prominently highlighted in the article. What we got displayed a very interesting divergence from what we’d naively expected.
And in fact, now that I have a certain distance from the field, I would argue that there has never been a significant a-priori theoretical prediction in the exoplanet field that proved to be substantially correct. Hot Jupiters? Peas-in-the-pods? Radius Inflation? Ubiquitous Super-Earths? Something needs to be done to start improving on the abysmal track record…