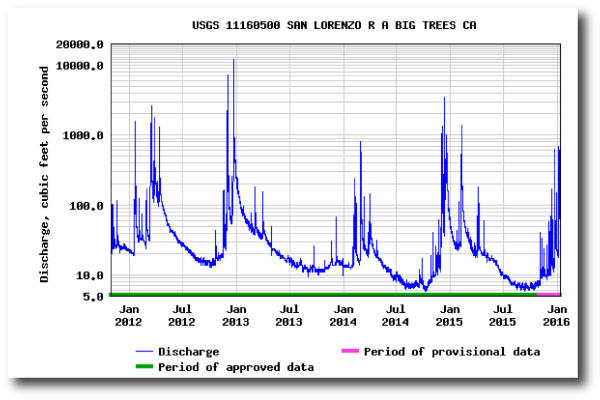
And in California, for the past several years, it mostly hasn’t. This summer, the creeks in the Santa Cruz Mountains were reduced to slight trickles, which was sufficiently alarming to cause me to start watching the USGS’s real-time web-based flow monitor for the San Lorenzo River. The growing drought is evident in the nadirs of this plot of the streamflow for the past four years:
This summer and last, the mighty San Lorenzo was scraping by at about five cubic feet per second, which was thousands of times less than the peak flow at the end of 2012. Stream flow depends on a number of known factors — watershed characteristics, rainfall, ground saturation, etc. etc., all of which allow for an excellent short-term predictive model.
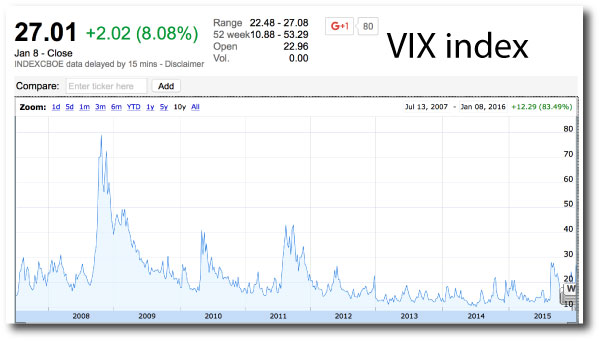
There is a provocative at-a-glance similarity of the stream flow process and the stock market volatility process, which is conveniently measured by the VIX index:
Analogies springing from the superficial commonality might be something interesting to think about when one is constructing predictive models for volatility, and indeed, the idea seems a bit more urgent at the beginning of this week than it was at the beginning of last…
For those interested, I’ve set up two seemingly unrelated prediction markets at our new website Metaculus. The first gathers forecasts of whether the California Drought will end by this spring. The second asks whether we’ll see an intra-day print of VIX>50 this year. We’re trying to juice some liquidity into these markets, so go ahead and and make your forecast…


