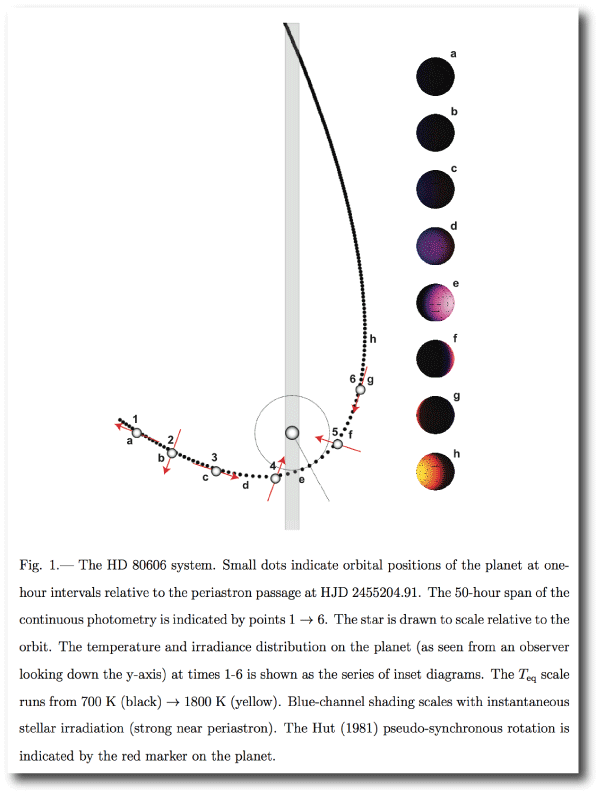
We’re putting the finishing touches on a new research paper that deals with an old oklo.org favorite: HD 80606b. The topic is the Spitzer Telescope’s 4.5-micron photometry taken during the interval surrounding the planet’s scorching periastron passage, including the secondary eclipse that occurs several hours prior to the moment of closest approach (see the diagram just below). I’ll write a synopsis of what we’ve found as soon as the paper has been refereed.
In writing the conclusion for the paper, we wanted to try to place our results in perspective — the Warm Mission has been steadily accumulating measurements of secondary eclipses. There are now over 100 eclipse depth measurements for over 30 planets, in bandpasses ranging from the optical to the infrared.
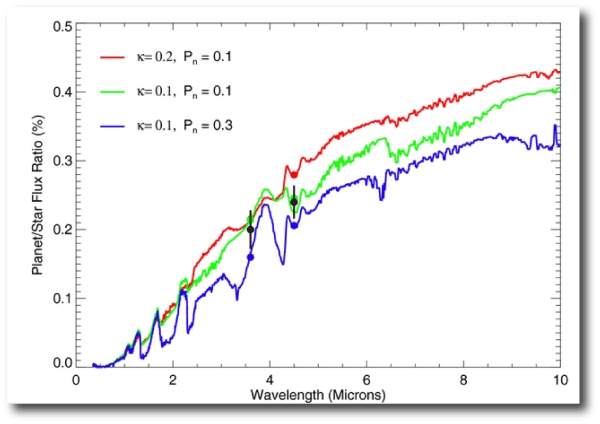
A set of secondary eclipse measurements at different bandpasses amount to a low-resolution dayside emission spectrum of an extrasolar planet. When new measurements of secondary eclipse depths for an exoplanet are reported, a direct comparison is generally made to model spectra from model atmospheres of irradiated planets. Here is an example from a recent paper analyzing Warm Spitzer’s measurements of WASP-5:
Dayside planet/star flux ratio vs. wavelength for three model atmospheres (Burrows et al. 2008) with the band-averaged flux ratios for each model superposed (colored circles). Stellar fluxes were calculated using a 5700 K ATLAS stellar atmosphere model (Kurucz 2005). The observed contrast ratios are overplotted as the black circles, with uncertainties shown. The model parameter kappa is related to the atmosphere’s opacity, while p is related to the heat redistribution between the day and night sides of the planet (Pn = 0.0 indicates no heat redistribution, and Pn = 0.5 indicates complete redistribution).
As is certainly the case in the figure just above, the atmospheric models that are adopted for comparison often have a high degree of sophistication, and are informed by a substantial number of free parameters and physical assumptions. In most studies, some of the atmospheric parameters, such as the presence or absence of a high-altitude inversion-producing absorber, or the global average efficiency of day-to-night side heat redistributions are varied, whereas others, such as the assumption of hydrostatic equilibrium and global energy balance, are assumed to be settled. Invariably, the number of implicit and explicit parameter choices tend to substantially exceed the number of measurements. This makes it very hard to evaluate the degree to which a given, highly detailed, planetary atmospheric model exhibits any actual explanatory power.
The central limit theorem states that any quantity that is formed from a sum of n completely independent random variables will approach a normal (Gaussian) distribution as n becomes large. By extension, any quantity that is the product of a large number of random variables will be distributed approximately log-normally. We’d thus expect that if a large number of independent processes contribute to a measured secondary eclipse depth, then the distribution of eclipse depth measurements should be either normally (or possibly log-normally) distributed. The “independent processes” in question can arise from measurement errors or from systematic observational issues, as well as from the presence of any number of physical phenomena on the planet itself (such as the presence or absence of a temperature inversion layer, or MHD-mediated weather, or a high atmospheric C/O ratio, etc.).
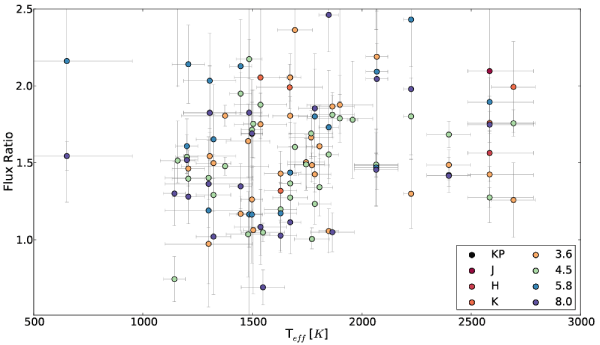
The plot just below consolidates more than 100 existing secondary eclipse measurements onto a single diagram. Kudos to exoplanets.org for tracking the secondary eclipse depths and maintaining a parseable database! The observed systems are ordered according to the specific orbit-averaged flux as expressed by the planetary equilibrium temperaturs — the nominal black-body temperature of a zero-albedo planet that uniformly re-radiates its received orbit-averaged stellar energy from its full four-pi worth of surface area. The secondary eclipse depths in the various bands are transformed to flux ratios, F, relative to what would be emitted from a black-body re-radiator. If all of the measurements were perfect, and if all of the planets were blackbodies, all of the plotted points would lie on the horizontal line F=1.
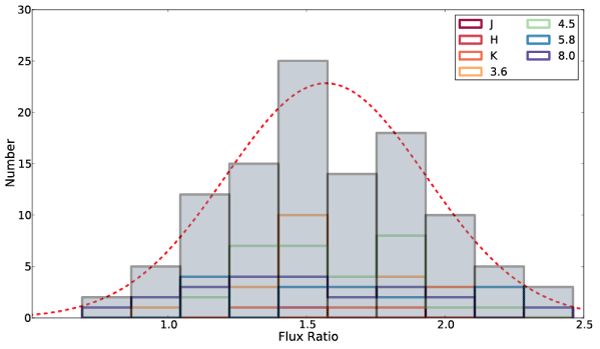
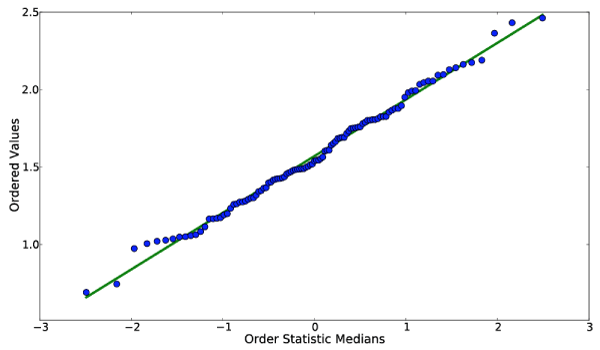
It’s somewhat startling to see that there is little or no systematic degree of similarity among the measurements. One is hard pressed to see any trends at all. Taken together, the measurements are consistent with a normal distribution of flux ratios relative to a mean value F=1.5, and with standard deviation of 0.65:
This impression is amplified by the diagram just below, which is a quantile-quantile plot comparing the distribution of F values to an N(0,1) distribution.
The nearly gaussian distribution of flux ratios suggests that the central limit theorem may indeed find application, and imparts a bit of uneasiness about comparing highly detailed models to secondary eclipse measurements. I think we might know less about what’s going on on the hot Jupiters than is generally assumed…


