
i-Phone snapshot of Difference Engine #2.
The systemic console started life over five years ago as a web-based applet for analyzing radial velocity data. The original version was a collaboration between Aaron Wolf (then a UCSC Undergraduate, now a Caltech Grad Student) and myself, and the Java was coded in its entirety by Aaron. Our goal was to clarify the analysis of radial velocity data — the “fitting” of extrasolar planets — by providing an interactive graphical interface. The look and feel were inspired by sound-mixing boards, in particular, the ICON Digital Console built by Digidesign:

Over the intervening years, the console has expanded greatly in scope. Stefano Meschiari has taken over as lead software developer, and has directed the long-running evolution with considerable skill. The console has been adopted by planet-hunting groups world-wide, as well as by classroom instructors and by a large community of users from the public.
Tuesday’s post pointed to our new peer-reviewed article (Meschiari et al. 2009) that describes the algorithms under the console’s hood, and now that the code base has matured, we’re developing documentation that can serve the widely varying needs of our users. We also intend to return the systemic backend collaboration to the forefront of relevance. A great deal of very interesting work has been done by the backend users, and it can be leveraged.
As the first step, we’re updating and expanding the tutorials, which have been largely gathering dust since November 2005. Following the page break, the remainder of this post updates tutorial #1. If you’ve ever had interest in using the console, now’s the time to start…
Console Tutorial #1: A Fish in a Barrel — HD 4208b
How do you use the console to find planets?
Stellar radial velocity data have been used to infer the presence of hundreds of extrasolar planetary systems, and in nearly every case, the radial velocity data have been tabulated in the papers that announce the discoveries. In this tutorial, we introduce the console, and use it to “discover” a planet orbiting the star HD 4208. (The tutorial assumes version 1.0.90 of the console, running on Mac OS X 10.5.7, if you are using a different set-up, there may be minor differences in details and appearance).
A radial velocity measurement of a star is the component of the velocity of the star along the line of sight from the Earth to the star. Most of this radial velocity stems from the natural motion of the star with respect to our solar system. The Sun orbits the center of the galaxy at a speed of approximately 250 kilometers per second. Most of the stars in the solar neighborhood are moving in roughly the same manner, but stellar orbits are not perfectly circular. Some of the stars in the solar vicinity are moving more quickly than the Sun, while others are moving more slowly. The average difference in orbital velocity between neighboring stars is about 20 kilometers per second. Part of this velocity will be in the so-called transverse direction, the rest is along the radial line connecting our solar system to the star. The Alpha Centauri system, for example, is headed toward us with a radial velocity of -21.6 kilometers per second. By carefully noting the Doppler shift of the stellar lines, it is possible (for favorable cases) to measure the line-of-sight speed of the star with a precision of order 1 meter per second.
In addition to the random motion that a given star has with respect to the Sun, there is also a small superimposed component of motion that is generated as the star wobbles back and forth in response to any planets that are in orbit around it. For the case of a single planet in a circular orbit, the situation is easily visualized by imagining that the star and the planet are attached to the opposite ends of a rigid rod. If you wish to balance the rod on a fingertip, then you must position your finger under a point on the rod that is much closer to the heavy star than it is to the less massive planet. For example, if the star is a hundred times more massive than the planet, then the point of balance lies one hundred times closer to the star than it does to the planet. As the orbit proceeds, one simply swings the star and the planet around the point of balance. The planet executes a large circle, and the star executes (in the same amount of time) a circle that is one hundred times smaller.
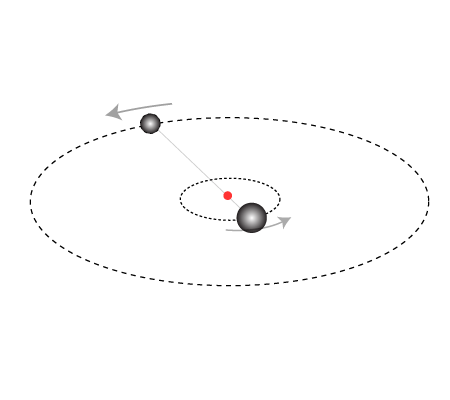
An analogous situation applies when the orbits are eccentric.
To get started, install the “cutting-edge” console on your computer, and double-click the Console.jar icon. When initialization is finished, you’ll see the main console window:
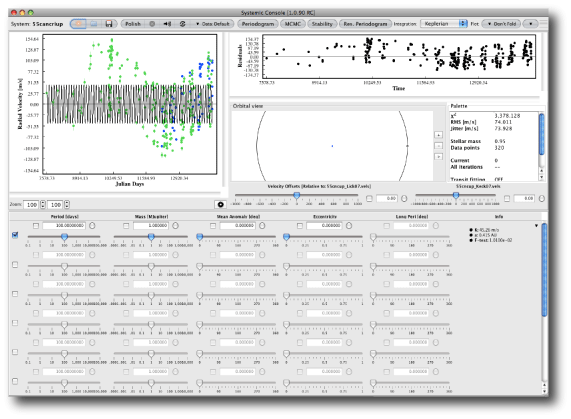
At the risk of sounding silly, it’s worth remarking that the console is ready for rough-and-ready experimentation. Push buttons, slide sliders, and get a feeling for how things work. While it’s not impossible to effectively hang the software, you can always force-quit and restart, and in a worst-case scenario you can always download a fresh-baked copy. It’s free! (Also, in response to a query from a well-known planet hunter, under no circumstances will the console “phone home”.)
When the console first appears, it is set by default to the radial velocity data sets for the multiple-planet-bearing star 55 Cancri. This tutorial walks you through the much less complex data set associated with the star HD 4208. You change data sets by clicking on the star icon
![]()
and then selecting HD 4208 from the ensuing pop-up window:
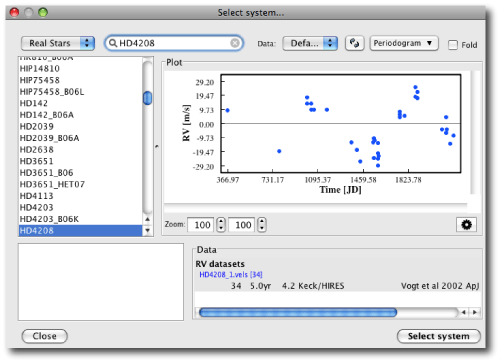
This selection plots the the published HD 4208 radial velocity data set in the console’s data window:
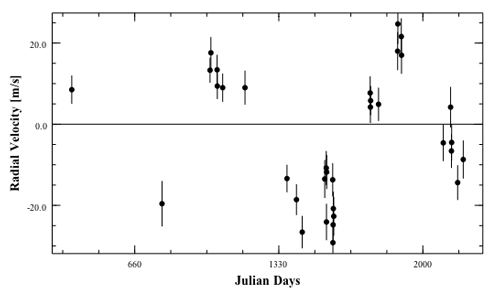
HD 4208 is a sunlike star lying roughly 110 light years from Earth. It’s too faint to see with the naked eye, but it can easily be spotted with binoculars or a small telescope if you know where to look. In 2002, Vogt et al. published a data set containing 35 independent radial velocity observations of the star. These measurements were accumulated at the Keck telescope over an 1,821 day (~5 year) interval starting on JD 2450366.9657 (11:10 AM on Oct. 10, 1996, Universal Time). The observations are spaced unevenly over the years because the California-Carnegie planet search team received only limited blocks of time at the telescope, and also because the star can only be easily observed from Hawaii from July through January.
The radial velocities are clearly varying with time. The block of velocities after day 1330 all lie below the average, whereas the points near day 1000 and near day 1800 are all above average. This variation suggests that a planet might be orbiting the star (and pulling it back and forth along our line of sight) with a period of something like 1500 days.
To test this speculation, click on the button to the left of the first row of sliders. This activates a planet, and computes a synthetic radial velocity curve for the star based on the values given by the positions of the sliders.
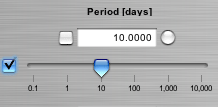
Use the period slider to increase the planetary period to about 1500 days. Notice that the strength of the radial velocity signal diminishes as the period increases. This is because a more distant planet exerts a smaller gravitational force on the star. (Short-period planets are easier to detect because it’s not necessary to wait for a long time to get the data, and also because the radial velocity signal strength is larger for a given mass. The longest-period planets yet detected by the radial velocity method have periods of about 5000 days, and this maximum period will creep up gradually as the time baseline of the radial velocity surveys increases.)
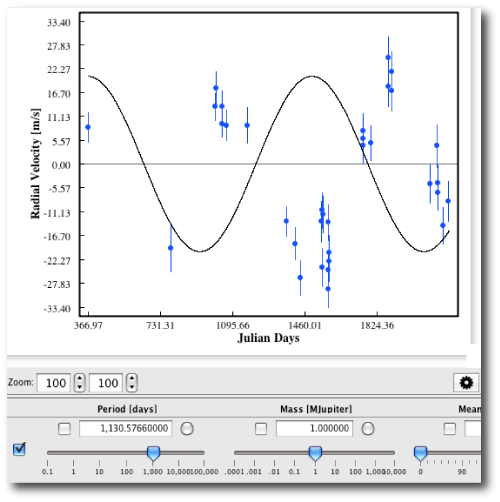
Use the planetary mass slider to increase the amplitude of the radial velocity signal so that it roughly matches the amplitude of the excursion of the data points. The screenshot below indicates that for a planetary period of around 1100 days, the amplitude variation can be explained if the orbiting planet has the same mass as Jupiter:
Repeatedly click on negative zoom button to the right of the “Orbital View” window near the middle of the console display
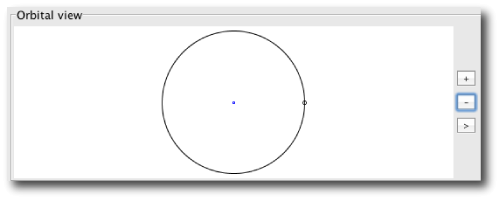
The orbital view window plots the orbit of the planetary system that corresponds to the current slider settings. Using the right arrow button, you can detach the orbital view window from the console to get a more detailed plot of the orbit.
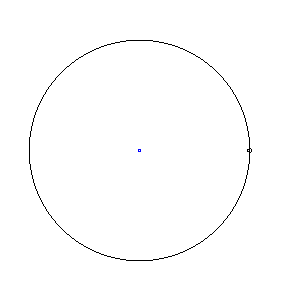
The orbital position of the planet is shown at the moment when the first radial velocity measurement of the star was obtained. In the plot above, the slider positions place the planet at the 3-o’clock position (i.e. on the x-axis) at this moment. The console uses the convention that the orbital motion is counter-clockwise as viewed from above, and that the line of sight from the star to the Earth points toward the top of the screen (i.e. along the y-axis).
In the plot above, the planet is stationed at the point of its orbit where it is momentarily traveling directly toward the Earth. This means that the motion of the star is momentarily directed away from the Earth. By astronomical convention, motion away from the Earth is defined as a positive radial velocity. The stellar radial velocity plot on the console thus shows that the radial velocity is started at the maximum of its cycle.
The radial velocity data, however, suggest that the time of the first measurement did not occur at the maximum of the velocity cycle. You can try to improve the fit by adjusting the planet’s position in its orbit. This is done using the “Mean Anomaly” slider:
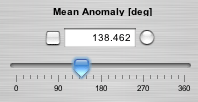
The slider shifts the planet in its orbit, and slides the model radial velocity curve to the left or to the right without changing the shape of the curve.
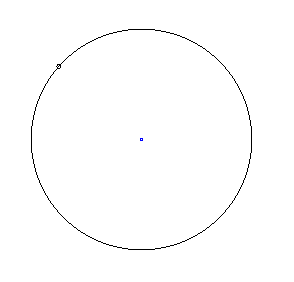
It has been known since 1609 that planetary orbits are generally ellipses rather than circles, and that a planetary orbit has the star at one focus of the ellipse. The eccentricity of the orbit is controlled by the eccentricity slider, which runs from e=0 (a circular orbit) to e=1.00 (a parabolic orbit):
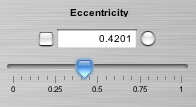
The orbital eccentricities of the planets in our solar system are generally quite small. Earth’s eccentricity, for example, is e=0.0167 (Earth reaches its closest point, its perihelion, on January 4th). Jupiter has e=0.0483. Among the eight major planets, Mercury, with e=0.2056, has the largest eccentricity. Many of the extrasolar planets, on the other hand, seem to have very eccentric orbits. The current record holder is HD 80606b:
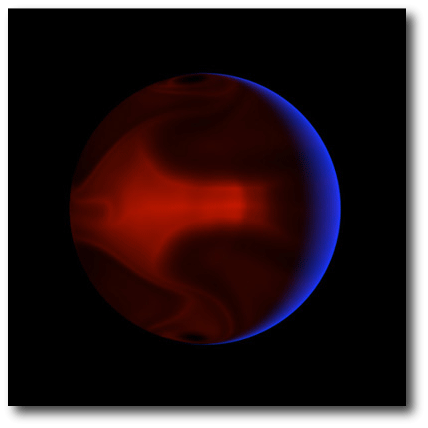
With e=0.932. Every 111.4 days, this planet swoops to within 6 stellar radii of its parent star, a state of affairs that leads to severe and unpleasant weather (I recently talked in detail about the storms on this planet on NPR’s Science Friday, click here if you’re interested to hear the podcast.)
Varying the orbital eccentricity changes the shape of the radial velocity curve:
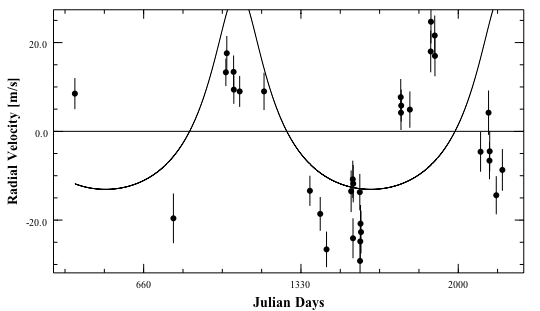
Once an eccentricity has been introduced, one also needs to specify where the location of closest approach (known as periastron) occurs.
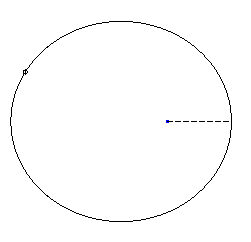
This angle is called the longitude of periastron, and is indicated by the dotted line in the orbital plot:
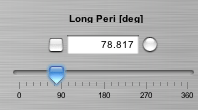
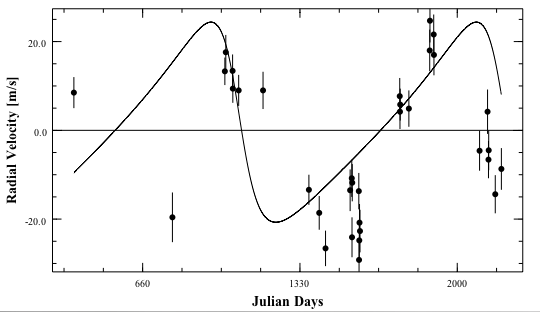
The longitude of periastron slider therefore changes the overall orientation of the orbit once the eccentricity and the period have been specified. Changes in the longitude of periastron have interesting effects on the shape of the radial velocity curve. By adjusting the eccentricity and the longitude of periastron, one can generate a startlingly wide range of different radial velocity waveforms:
Additional planets add their own individual contributions to the overall radial velocity curve. To see how this works, you can activate additional planets by clicking on the box to the far left of each row of sliders:
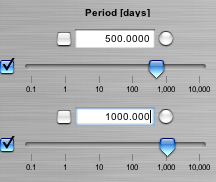
With several planets in play, it is possible to generate some very weird-looking waveforms. For example, the following radial velocity curve,
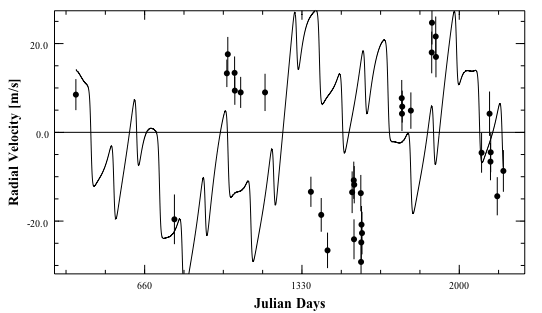
is produced by a configuration of planets that looks like this:
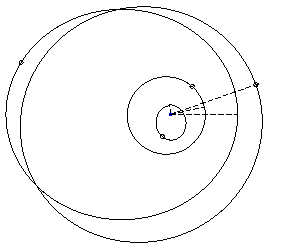
(see, however, tutorial 3, which introduces the dynamical stability and planet-planet interaction issues that can arise for crowded planetary systems).
The Doppler velocity technique produces radial velocity measurements that are valid relative to one another. This leaves the latitude to specify where the zero point of the model velocity curve should lie. The location of the zero point is adjusted using the Stellar Velocity slider. This moves the model radial velocity curve up or down relative to the data.

How does one know whether a particular planetary model provides a good fit to the radial velocity data? In general, the better the job that the model curve does of running through the data, the better the fit. In the systemic console, the “goodness of fit” is quantified by two numerical measures. The RMS (or root-mean-square) of the fit corresponds to the square root of the average of the squares of the velocity differences between the actual radial velocity measurements and the model curve. The reduced Chi-square (abbreviated on the console as ChiSq) is a related statistical measure that gives stronger weight to points that have smaller error bars:
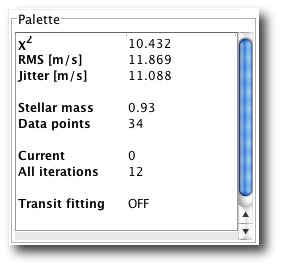
As a rough rule of thumb, one wants the fit to have a reduced Chi-square value which is as close to one as possible.
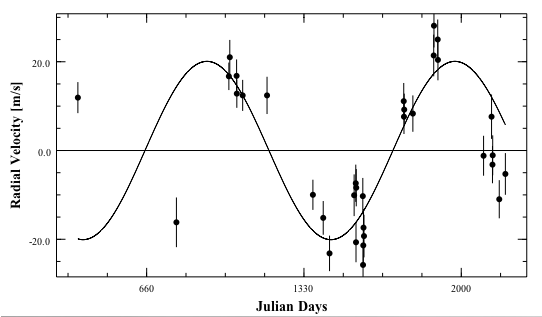
The error bars on the radial velocity data points correspond to estimates of the uncertainties introduced at the telescope by the measurement process. The plotted error bars do not include another source of error known as the “stellar jitter”. The photospheres of the stars probe overturning convective eddies, and at any given moment, a radial velocity measurement of a star will display a component due to the non-zero sum of all of the different upwelling and downwelling points on the visible surface of the star. For stars similar to the Sun, the stellar jitter generally has a value in the neighborhood of 3 to 5 meters per second. The “required stellar jitter” is the amount of jitter that the star would need to have in order for the radial velocity fit to be an acceptable model of the data.
When you first begin to use the console, it is informative to try and get an acceptable fit to the data simply by moving the sliders, and trying to minimize Chi-square. One soon finds, however, that it becomes both tedious and difficult to significantly improve the fit with this method. We have therefore provided several tools which improve the efficiency of the fitting process.
To the right of each slider read-out is a small round button:

Clicking on this button instructs the console to perform a one-dimensional line minimization, which uses bracketing and bisection to find the parameter value that provides the best fit to the data. The fit can be improved by repeatedly clicking on the line-minimization buttons for the active parameters.
Unfortunately, this strategy does not generally find an acceptable fit to the data. A sequence of line minimizations frequently causes the console to become trapped in a local minimum in which no further quantity of succesive line minimizations will improve the fit. To remedy this situation, the console also implements a technique called Levenberg-Marquardt multiparameter minimization, which attempts to locate a more global minimimum. The Levenberg-Marquardt algorithm operates on all of the parameters in which the boxes to the left of the slider displays are clicked:

For reasonable initial guesses, the Levenberg-Marquardt gives the following fit to the HD 4208 data:
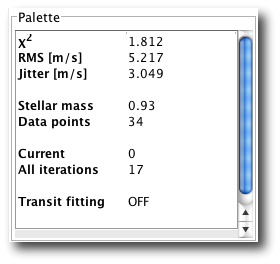
Notice that the required stellar jitter is down to 3 m/s, which indicates that further improvements to the fit are likely not warranted. The orbital fit found by the systemic console agrees quite well with the published fit by Vogt et al 2001, who found: P=812 days, M=0.8 Jupiter Masses, e=0.05, and a longitude of periastron of 249 degrees.
Congratulations! You’ve found a planet.
