Jonathan Fortney has the office next to mine at UCSC, and so we’re always talking about the Spitzer observations of extrasolar planets. The Spitzer Space Telescope has proved to be an extraordinary platform for observing planets in the near infrared, and during the past year, the number of published and planned observations has really been growing rapidly.
Increasingly, with the flood of data, I’ve been finding that I have trouble keeping mental track of all the photometric observations of all the planets that Spitzer has produced. Let’s see, was Tres-1 observed in primary eclipse? Did someone get a 24-micron time series for HD 149026? And so on.
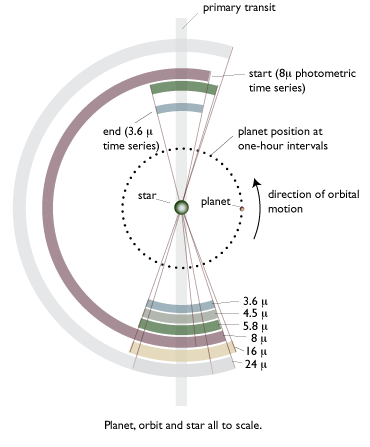
So Jonathan and I decided to put together a poster that aggregates the observations (that we know of) that have either been completed, or which have been scheduled. The relevant information for each campaign includes the star-planet system, the bandpass, and the duration and phase of the observation. We wanted the information for each system to be presented in a consistent manner, in which the orbits, the stars, and the planets are all shown to scale (and at a uniform scale from system to system). As an example, here’s the diagram for HD 189733:

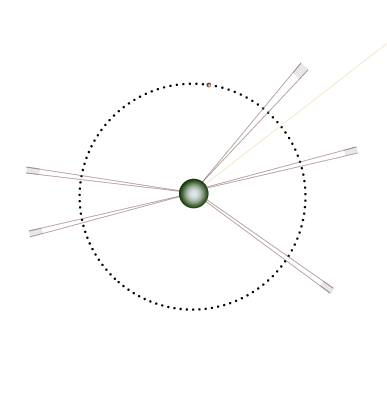
In putting the poster together, we were struck by the variety of different observational programs that have been carried out. Some of the diagrams, furthermore, with text removed, have a delicate insect-like quality.


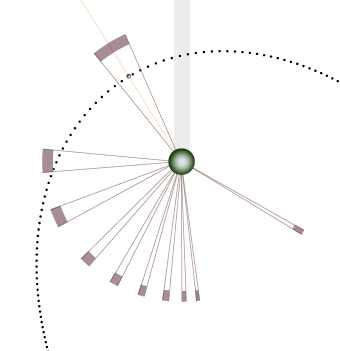
(The figure just above shows Bryce Croll’s planned 8-micron observations of Transitsearch.org fave HD 17156b. Croll’s campaign will attempt to measure the pseudo-synchronous rotation period of the planet.)
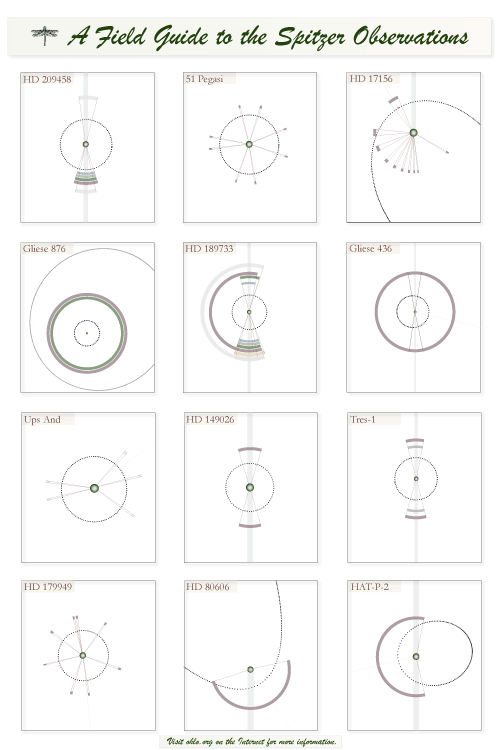
I’m going to Boston next week to attend the IAU transit meeting, and so I printed out a copy of the poster to put up at the meeting:

Here’s a link to the Illustrator file and the .pdf version. Full size, it’s two feet wide and three feet tall. Going forward, I’ll update the files as new observations come in.

So judging by that diagram, you’ve seen the secondary transit of HD 80606b…
Not necessarily, it just means they have observations of HD 80606 from the time period represented by the arc.
Hungry4info2: yes, but only the transiting planets have the shaded vertical bars. HD 80606b has a half-bar.
Oh o_O wow you’re right. I didn’t realise that before. And indeed, even when excluding HD 80606, all non-transiting systems don’t have a bar, so it would make sense that Greg would follow that pattern.
=D So can we interpret this as secondary transit detection?
Afraid the explanation assumes too much background familiarity for me to follow, but here’s one question. Some of the diagrams include a very faint solid line (e.g. HD17156 top-left). Does this represent the direction to the Earth?
I think the faint pinkish solid lines indicate periapsis — the closest approach of the planet to the star — for planets with noticeable eccentricity. (I’m just going by appearances, but that interpretation seems to work for all the diagrams shown…)
Thank you tfisher98. Then the direction to the Earth must be in the direction of the top grey shaded vertical bar on some diagrams. So, many of the observation (e.g. HD179949) are not bracketing the planet transit or eclipse times. The diagram in the post: “160 basis points” shows a similar diagram with labels.
An update: Our HD80606 work has been submitted for publication. Once it’s gone through peer review, I’ll post all the details…