The flurry of activity surrounding the detection of the HD 17156b transits, combined with the start of the academic quarter here at UCSC, caused me to fall way behind on my stack. All of a sudden, over two weeks have passed with no oklo.org posts. I think that’s a record, unfortunately.
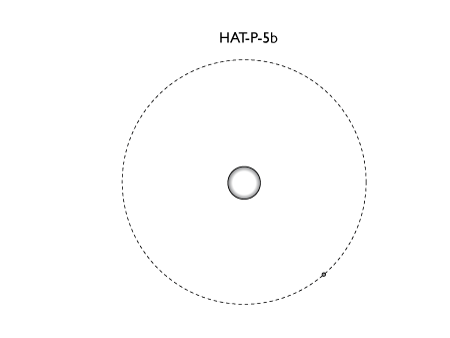
And it’s not as if there’s been no new exoplanet news. The past two weeks have seen the announcement of two more new transiting planets from Gaspar Bakos’ HATnet project. “Yo, what up TrES?” HAT-P-5b has a period of 2.79 days, and looks good in a 400-pixel wide everything’s to scale diagram:

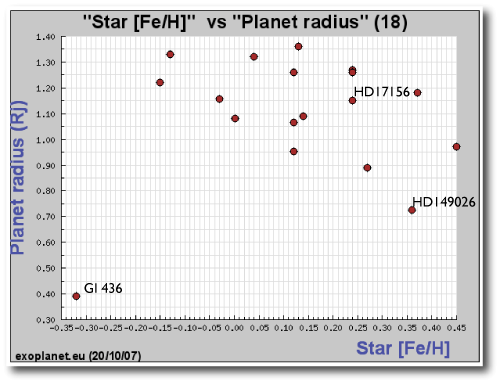
There are enough transiting extrasolar planets now, so that it’s interesting to look for trends in the planetary properties. At Jean Schneider’s exoplanet.eu site, there’s a nifty set of php routines that make it very easy to dial up all the different correlation diagrams. With the inclusion of HD 17156b, HAT-P-5b, and HAT-P-6b, a plot of planetary radii vs. stellar metallicity is pointing to an interesting trend. It’s quite apparent that the metal-rich stars tend to harbor smaller planets. This seems to be indicating that metal-rich disks are yielding planets that have highly enriched heavy element fractions, which in turn is giving us an important clue into the planet formation process.

If we ignore Gliese 436b, which is far smaller in both mass and radius than all the other known transiting exoplanets, then there’s a fairly obvious hint of two separate sequences in the diagram — a large-radius sequence, and a small-radius sequence. Feel free to voice your opinion in the comments section…
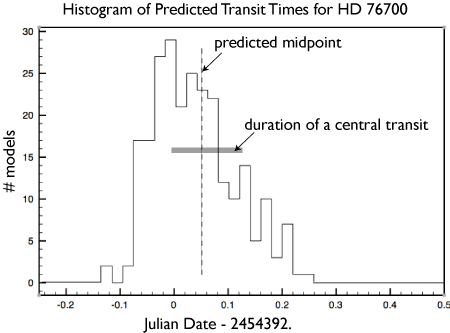
It’d certainly be nice to get more transits by planets orbiting bright parent stars. To that end, it’s important to stress that literally every single planet transiting a V<13 parent star is located north of the the celestial equator. It’s pretty clear that the southern hemisphere Doppler-wobble planets have not been fully followed up with photometric campaigns. I’m thus keen to get the Southern-Hemisphere Transitsearch.org corps out on the sky during the coming austral summer. First on the list is HD 76700b. This 0.20 Jupiter-mass planet orbits with a period of 3.970985 days, and has an extensive and fairly recent set of published radial velocities. I just updated the orbital fit, and found that the transit windows are still quite narrow. A simple bootstrap analysis shows that the uncertainty in the time of the transit midpoint is not much wider than the expected duration of the transit itself. The star is just coming visible in the early morning, and so it should be straightforward to either confirm or rule out a transit for this particular planet.


I fail to see “hint at two separate sequences” in your diagram. I understand what are you pointing at, but to me it seems simply a downward trend within a fairly large intrinsic variance. I guess you need at least 10 times more points to begin to talk about two separate sequences…
Intriguing data nonetheless. Playing around I’ve seen that also the metallicity VS eccentricity looks interesting, but I’m no planetary scientist so let me know if it does mean something.
Oh ok, it doesn’t look that interesting anymore if you count all known exoplanets, and not only transiting ones. Still, that’s why we can’t believe patterns arising from too many data points…
“too many few”
Greg-
I wonder what the metallicity/radius plot looks like when the abudance of metals is plotted linearly, not logarithmically. That is plot, Z, the metals fraction (linearly) as a function of radius. And mabye use planet densities instead of radii (which ignores their total mass). Isn’t this more relevant physics-ally?
Darin
darin — the exoplanet.eu site allows for both logarithmic and linear scaling for both axes.
I thought about using densities, but that can also be a bit misleading, since these objects are fairly well described by n=1 polytropes, and should thus all have roughly the same radii…
devicerandom — I agree that one shouldn’t base conclusions on too few data points. That said, however, if the trends are there, you’ll get an early indication when the data is still sparse. Speculation on the cause of the planet-metallicity correlation started back in 1997, when there were still just a few exoplanets known. The comment section of a blog seems like the perfect venue for somewhat irresponsible speculation.
Another reason why I like the correlation diagrams is because they point out the need to find more transiting planets. They emphasize that it’s not just ya seen one hot Jupiter ya seen ’em all.
cheers,
Greg
Well it looks like SuperWASP’s got a couple of southern sky transiting exoplanets.
Press release (pdf)