Image Source.
Last week, Joseph Harrington and his collaborators published a paper in Science that announced the results of a very interesting set of observations of Upsilon Andromedae with the Spitzer Space Telescope.
As console users know, Upsilon Andromedae is accompanied by three Jovian planets. The innermost body (officially known as “Dinky“) has at least 70% of Jupiter’s mass and orbits with a period of 4.6 days. Observers have checked to see whether Dinky passes directly in front of the parent star. They found that transits don’t occur, and so the orbital geometry likely looks something like this (as seen from Earth, with the planet grossly not to scale):
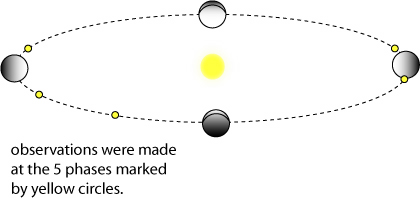
Harrington and collaborators made careful measurements of the infrared brightness of the star in the 24-micron band at five known phases during the planetary orbit. These phases are marked with small yellow circles in the above plot.
When the data were reduced, it was found that the brightness of the star was varying in phase with the orbital period of the planet. The brightness is lower when Dinky is in front of the star (near “inferior conjunction”) and higher when more of the planet’s illuminated surface is in view.
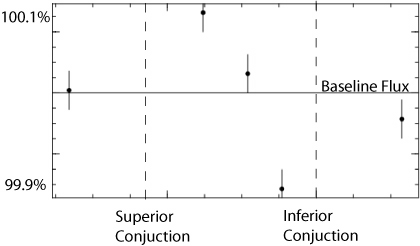
The difference in brightness during the course of the orbit is consistent with a temperature difference of order 1000 K between the illuminated dayside and the dark night side. The planet should be spin-synchronized, so that one side always faces the star and the other face is always pointed away. Harrington et al. showed that the data could be understood if it is assumed that the planet transfers very little heat to the night-side, thus allowing the large temperature difference to be maintained. In fact, they were able to get a good model of the brightness variations by assuming that the night-side was not radiating at all. Such a model curve looks like this:
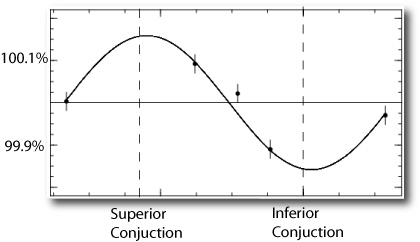
Intuitively, this result seems to make perfect sense. You’d expect a spin-synchronized planet to be hottest at the subsolar point, and coldest at the antistellar point, and this picture is fully consistent with the five observed fluxes. The results are surprising, however, when we take into account the fact that there should be hellacious winds on the planetary surface which should disgorge heat onto the night side.
UCSC graduate student Jonathan Langton has been studying the surface flows on hot Jupiters using a hydrodynamic technique known as the shallow water approximation. A often-seen feature of his models is that the hottest point on the surface of a synchronously rotating planet is well eastward from the substellar point. (A similar state of affairs is predicted by Cooper and Showman, who use a full 3D GCM-type model.)
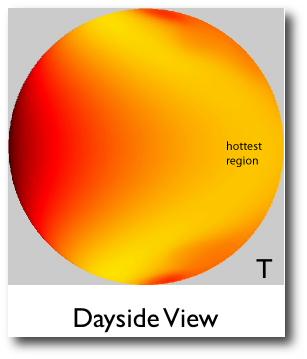
Similarly, the coldest spot on the night side, is also displaced eastward from the anti-stellar point:
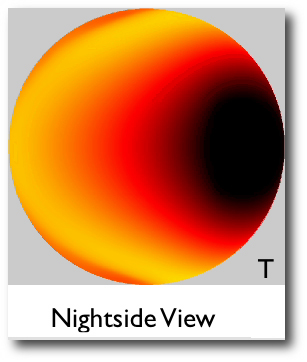
These models predict a smaller day-night temperature difference than the no-redistribution model that Harrington et al. fitted to the data. A smaller day-night temperature difference can indeed be accomodated by the observations, but the predicted phase shift seems highly inconsistent at first glance. Eastward-displaced hot and cold spots give a (edge-on inclined) lightcurve that is clearly out of phase:
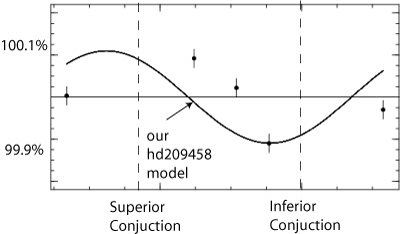
Taken at face value, the observations thus seem to suggest that the flows on the planet are very effective at radiating heat. That is, the upper layers that we can actually observe seem to have a short radiative time constant. In a set of upcoming posts, we’ll have a closer look at the interpretation of this very interesting new result.

My question is;
Refering to the above solar system diagram, and with east-ward winds to dissipate the heat to the night side, I intuitatively get an opposite model than one shown.
Say left side of diagram is position A, inbetween superior conjuction and inferior conjuction, near where 3 data points took place. (left side). Also , call the other side B.
Well, if the planet had the eastward rotation, due to planet spin being synchronized with respect to the star, and winds being eastern direction, shouldn’t it be darker at position A and brigther at position B?
To analogize, say if we cut the planet in 4 pieces, then at position A, we’re getting about 1/2 of all the incident luminosity, ie reflection, but also radiation from 1/2 the planet surface.
At position B, we still get 1/2 of all incident luminosity(as 1/4 of the planet is visibly “illuminated” to us), and due to radiation, we get almost none.
Ie, my question is, howcome the data points show oterwise? or am I just forgetting some basic concept?
Sasha M.
@York University
Hi Greg,
Very interesting post. Actually, if you look at the upper panel of their figure 1, the data before they substracted zodiac light drift, your model seems to fit the data rather well! When I first saw their paper, I feel a bit suspicious about their subtraction. Maybe their raw data is more reliable?
Greg:
Why do you assume an atmosphere?
It would be logical to assume that a planet, that close to its primary, has lost its atmosphere long ago.
If there is no atmosphere, the analysis makes sense, there is only conduction through the solid to transfer heat.
Mike
What would the lightcurve look like for a hot Jupiter spinning on its side?
Thanks for the questions:
Wl: that’s an interesting point. I’d tend to assume that they did the corrections properly, and hence would trust the reduced data more than the raw data. The Harrington et al. team has a great deal of experience with Spitzer, and they understand the instruments and observing situation extremely well. But as you point out, the zodiacal dust IR background correction is tricky, and it could conceivably be that there is a behavior outside the modeling assumptions that they used.
Mike: If the planet doesn’t have an atmosphere, then it would essentially be a large rock, and as you point out, such an object would cool off very quickly. The IR emission in this case, however, would this be considerably lower than observed because the radius of the planet would be much smaller. So a rock would give the correct phase variation, but a much smaller amplitude than observed.
Andy: We’ll reveal that one shortly. Jonathan has done the hydro calculations for that case (Cassini State II)…
Ok, I’ll be patient…
Regarding Mike’s point, the infrared observations presumably give some kind of handle on the radius of Ups And b – is it good enough to tell whether the planet is larger than expected?
Greg,
I agree with you that we should trust their expertise in Spitzer data reduction.
However, the fact that there is no comparison star observed (not necessarily in the same field) bugs me
a bit as the photometric stability they claimed
during their observations is extremely high. Plus
it’s impossible to see enough details on data
reduction out of a paper published in Science…
I thought about doing this myself, so I’ve looked closely at the parameters involved. It is very hard to disentangle the effects of the planetary radius, the inclination to the line-of-sight, the day-night temperature difference, and any phase lag from atmospheric effects as mentioned in the post. Varying each of these (non-independent) parameters alone gives small variations in the infrared light curve, but with only 5 points and non-negligible error bars, none of these parameters can be determined very accurately. Atmospheric effects (like those shown in the oklo.org splash image) complicate things even further.
In their paper (Harrington, et al.), for example, they have a plot of day/night temperature difference versus inclination that is consistent with the observations. The plot shows that a family of solutions are possible… and the plot doesn’t even show the effect of variations in planetary radius. Even so, I’m excited by the fact that the data are good enough to exclude objects that are less than 30 degrees inclined to the line of sight, meaning that the maximum mass of Ups And b is 2-3 Jupiter masses. Note that radial velocities only give you a minimum mass and, in general, maximum masses are not known for planets that are not transiting. (Although, for this system, it might be possible to determine maximum masses from noting the radial velocity effect of integrating the multiple-planet system, which would be observable for large masses.)
Andy, because of strong degeneracies in the parameters, it isn’t possible to say anything much about the radius of Ups And b.
Mike, we know from transiting planets that these objects have radii consistent with gas giants. While there is some disagreement, most people who have studied the problem find that atmospheric loss isn’t expected, even for objects close in.
I anticipate that Harrington, et al. or other teams will continue to gather data about this system, which will eventually put much tighter constraints on all the parameters. In addition, I assume someone is working on the full infrared light curve of transiting planet HD209458b, for which we already know the fluxes at superior and inferior conjunction, as well as the radius and inclination.
Sorry, I meant that the data are good enough to exclude planets less than 30 degrees inclined to the plane of the sky (more than 60 degrees from line-of-sight).
About my previous comment, take a look at
http://hubblesite.org/newscenter/newsdesk/archive/releases/2003/08/
Too Close for Comfort: Hubble Discovers an Evaporating Planet
Pingback: systemic - Follow Ups And other items…
Pingback: systemic - hot and bothered