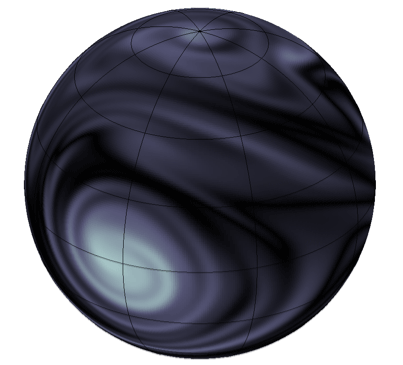
Vorticity can be thought of as the tendency of a paddlewheel to spin if placed in the flow. High vorticity is a large counter-clockwise spin, zero vorticity is no spin, and a large negative vorticity is a tendency to spin clockwise. The climate models of short-period extrasolar planets that Jonathan Langton and I have developed show a remarkable variety of vorticity patterns on their surfaces, in keeping with the incredibly stormy and complex nature of their atmospheres. Here’s a gallery of Mercator-projection vorticity maps for the known strongly irradiated Jovian planets that have significant eccentricities. The red arrows indicate the wind speeds and directions across the planetary surfaces. These figures are all from a paper that’s currently under review at the Astrophysical Journal (see here for an overview of the numerical method that we’re using). Also, a shout-out is due to Edward Tufte for advocating the strong graphic-design effect of small spots of saturated color on a gray-scaled backdrop.
HAT-P-2b:
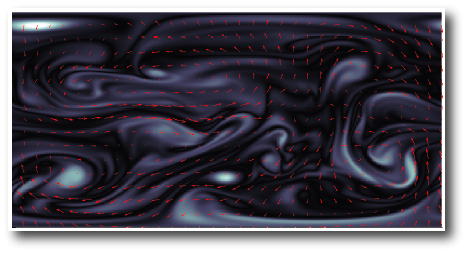
Here are 1.1 MB North Pole, South Pole and Mercator Projection animations of the HAT-P2b vorticity evolution.
HD 80606 b:
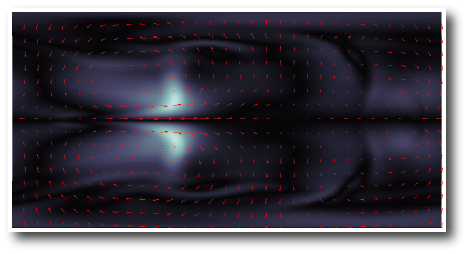
1.1 MB Mercator animation here.
HD 185269 b:
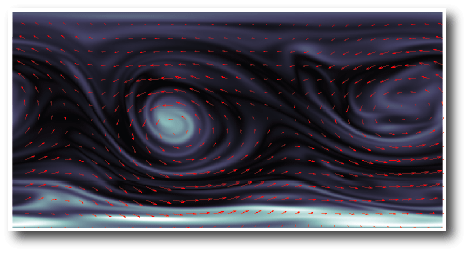
1.1 MB Mercator animation here.
HD 108147 b
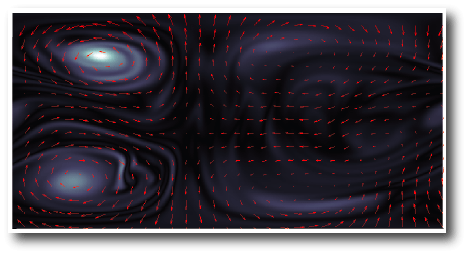
1.1 MB Mercator animation here.
HD 118203 b:
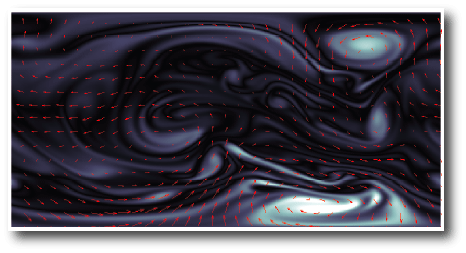
1.1 MB Mercator animation here. The animations above are hosted on the Oklo Corporation’s servers.
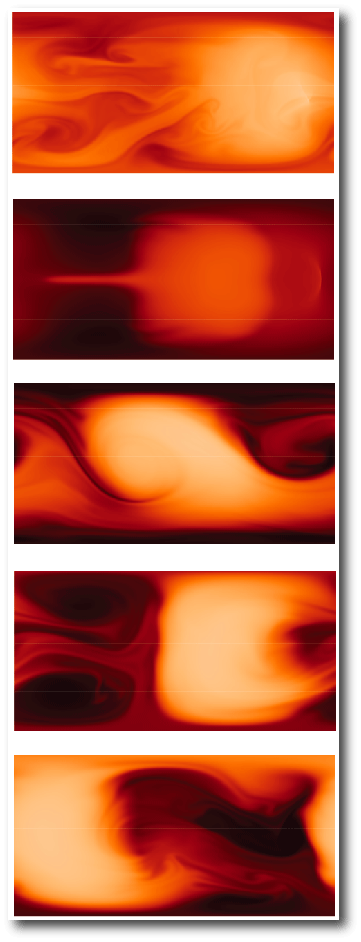
It’s interesting to compare the vorticity maps with the temperature distributions on the planetary surfaces (shown in the same order as above):

Thanks for putting these up! Looks like some of those planets have some vicious storms going on.
BTW the link for the HAT-P-2b Mercator animation is incorrect, it currently points at the south pole animation.
Hi Andy,
thanks! I’ve fixed the link.
Greg
Hi Greg,
these are really amazing images. Talk about rough weather ! One question: what assumption do you make on the obliquity of the planets ? This would have effects on the observed patterns, no ? Since
you are using these models to predict infrared light-curves for these planets (to be validated, or not, by Spitzer observations) I was wondering the same thing for these light curves: how do you handle the unknown obliquity of the planets ?
Cheers,
Luis
Hi Luis,
We’re assuming zero obliquity for all these planets. Non-zero obliquities are certainly possible, and would have an effect on the weather.
The overall character of the animations would likely not change too much for these simulations, however. Obliquity has the largest qualitative effect when applied to synchronous planets, since it destroys the planet’s ability to set up a steady-state flow pattern.
See our recent ApJ letter on this: (astro-ph/0702700).
best,
Greg
Extrasolar taffy pull! These are really beautiful and hypnotic. My big question is, what makes them all so different? The animation for HD 80606 b seems more sluggish, less turbulent, less “defined” than the rest. Is that because the planet has a much longer and more eccentric orbit than the others, and so receives less heat overall? Or . . . ? I’ve been entertained and intrigued – now I’m ready to be educated!
(And thanks for the fantastic images.)
Hi Bucky,
“What makes them all so different?”
That’s a very good question. The short answer is that we’re not completely sure. The planets represent a very large range of rotation rates, masses, and the time-dependence and amount of received energy flux from the parent stars. We are doing new simulations to test some hypotheses regarding exactly what is happening.
The fact that HD 80606b is so different from the others suggests that the heating rate (as opposed to the actual peak temperature achieved, or even the total trough-to-peak temperature difference) is a key factor.
Updates will follow over the coming weeks, stay tuned!
best,
Greg
Also what is that shockwave type structure that goes racing across the planet from about the middle portion. If it is the peak heating would it not vary its starting position each time as the planet rotates.
What was the assumed rotation rate. Would this not create numerous circulation cells as on Jupiter or Earth.
Forgot to mention the Shockwave appears to be on HD 80606b.
Hi Greg,
“What makes them all so different?â€
Doesn’t part of that answer, besides the very large range of rotation rates, masses, and the time-dependence and amount of received energy flux from the parent stars, also have to do with the internal temperature of a planet’s core?
Take the difference between Neptune and Uranus, for example. Neptune is presumed to have a significantly more active climate than Uranus, because it’s core is generating a tremendous amount of heat. Whereas, Uranus’ core is thought to be cool and therefore cannot generate the convection necessary to create vortices like the great dark spot on Neptune. And, it should be noted that both planets are too far aware from the sun for solar energy flux to be of any significant consequence.
Best,
Eric
P.S.
The animations are outstanding, by the way. :-)
Eric
Pingback: systemic - Æ’r3$h R4Ã14£ V3£0(1713$
Pingback: Id?járásjelentés a HAT-P-2b-r?l: forróság és viharos szelek | Csillagászat.hu