Good news for the systemic user base! Eugenio has posted a new version of the downloadable systemic console. This most recent update fixes several bugs, and offers a better graphical interface for those working at limited display resolutions. Progress overall has been rapid during the past several days, and next week we’re planning to roll out both a fully threaded version of the console as well as the Systemic Jr. catalog of synthetic radial velocity data sets. Systemic Jr. will be a testbed for the full Systemic simulation, and will allow us to answer a number of interesting questions regarding the fidelity of planetary models as a function of orbital parameters and observational sampling. Put oklo.org on your bookmark list and tell your friends to drop by. We’ve manufactured plenty of consoles to hand out.
By tomorrow I’ll be back on the extrasolar planets beat, but I thought it would be interesting to show a few more results connected to the strange orbits detailed in the previous post.
It’s clear from the sample of eight orbits that were charted that the m=1 singular isothermal disk potential supports an extensive variety of orbital families: tube orbits, box orbits, chaotic orbits, resonant orbits, and Enron orbits just to name a few. Is it possible to design a map that shows the regions of parameter space that are delineated by the different kinds of orbits?
The best method that I’ve been able to devise consists of what I’ll call an “excursion map”. We can clasify orbits by the total angle that they accumulate over time. For example, a loop orbit (such as the first trajectory shown in the previous post) experiences a steady accumulating of total angle — 360 degrees worth per orbital period. A box-type orbit on the other hand (like the seventh and eighth trajectories shown in the previous post) oscillates back and forth across the x-axis and never accumulates more than 90 degrees or so of total angular excursion. Chaotic orbits (such as the sixth example trajectory) execute a random walk in angular excursion, and on average accumulate a total absolute angular excursion (either positive or negative) which is proportional to the square root of the time.
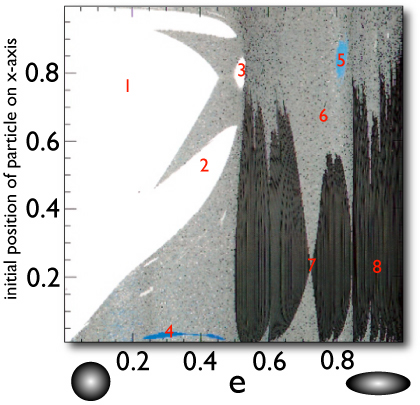
We can thus pack information about the orbital structure of the potential function into a single diagram. We choose intial starting conditions parameterized by position on the x-axis and the e-parameter of the potential function. A given starting condition corresponds to a point on a two-dimensional diagram, and also defines an orbit. The orbit can be integrated for a characteristic time (t=1000, say) and the total angular excursion or the orbit can be logged. A color code can then be assigned: white for orbits that accumulate positive angle in direct proportion to the time, gray for orbits that accumulate angle in proportion to the square root of the time, and dark gray for orbits that never get beyond plus or minus 90 degrees. With this coding, the excursion map looks like this:

The numbers label the locations of the 8 different orbits shown in the previous post.
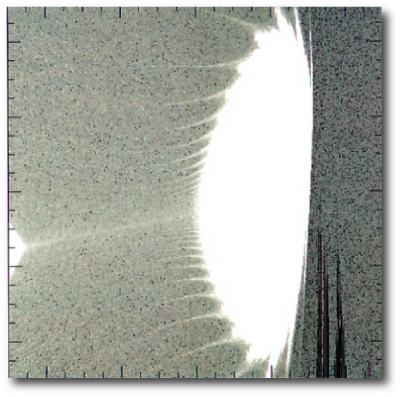
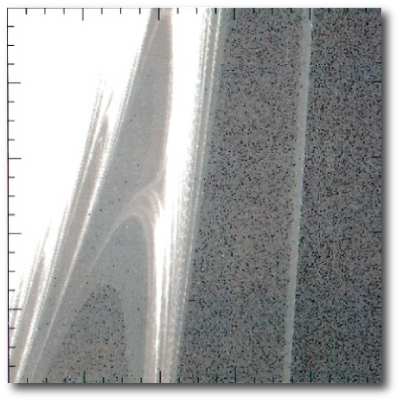
Take orbit 3, for example. It corresponds to a loop-type orbit within an island of similar loop orbits surrounded by a sea of chaotic orbits. If we zoom in on the island with a magnification factor of ten, we see structure emerge. Tiny changes in the initial conditions determine whether an orbit is stable (white) or chaotic (gray). Two jagged fingers of box orbits jut up into the map.

Zooming in by another factor of ten shows that the map has a fractal structure, with detail emerging on every level of magnification:

It’s strange to realize how so much bizarre structure is inherent within such a simple potential function. Somehow, encapsulated into one simple formula, the dynamics are all folded up like an inifinite series of orgami cranes, waiting patiently to be observed…

Chaos is full of endless surprises which seem oddly familiar. Not too many islands of stability in that potential at all.