As Mick Jagger famously remarked, you can’t always get what you want. Kepler’s photometric transit observations provide excellent measurements of the planetary orbital periods, the transit epochs and the planet-to-star radius ratios, but they are stingy and tight-lipped when it comes to the planet’s masses, eccentricities, and longitudes of periastron.
Occasionally masses can be inferred from transit timing variations, especially if a system contains more than one transiting planet. Alternately, one can assume a planetary mass-radius relation (keeping in mind, of course, what happens when u assume). For example, M=R^2.06 in units of Earth masses and radii works quite well in our solar system for V-E-S-U-N. Or, dispensing with the trickery, one can pony up and measure radial velocities.
With photometric data alone, information about the orbital eccentricity distribution of the planet census can be deduced by statistically comparing transit durations to orbital periods. The idea is a full elaboration of the simple observation that if a central transit that is substantially shorter than expected, then it’s quite possible that the planet is occulting the parent star near the periastron of an eccentric orbit.
In one of the flurry of Kepler-related papers that accompanied the February data release, Moorhead et al. (2011) implemented just such a program, and generated a statistical analysis of the distribution of transit durations for the Kepler exoplanet candidates. They assumed that the eccentricities conform to a Rayleigh probability distribution function:

where the controlling parameter, sigma, is is related to the mean orbital eccentricity through
![]()
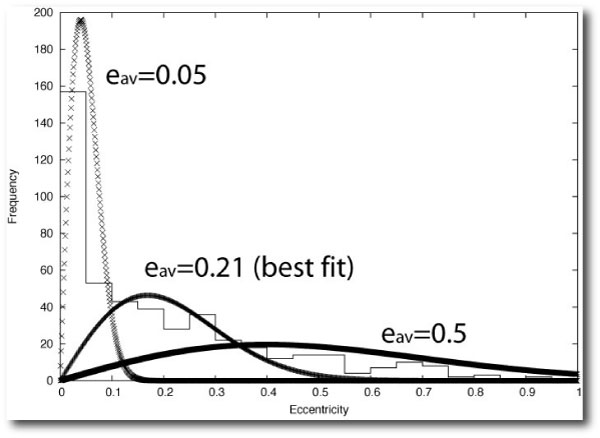
To get a sense of what the Rayleigh distributions look like, here are examples for e_av=0.05, e_av=0.21, and e_av=0.50, compared to the distribution of eccentricities in the exoplanet.eu catalog:

Ignoring planets that are likely tidally circularized, the best fit occurs for e_av=0.21. This model, however, underproduces planets at high eccentricity — ‘606 wouldn’t have turned up if e_av=0.21 were a hard truth. Moorhead et al.’s analysis of the Kepler data comes up with plausible best-fit values for e_av ranging from 0.1 through 0.25, for cooler stars with effective temperatures less than 5100K. So there is rough agreement, even though the two catalogs have radically different sampling biases.
A significantly non-zero value for average orbital eccentricity has some interesting consequences for transit surveys. At a given semi-major axis, eccentric planets have (on average) a higher chance of transiting. This is easily seen by comparing an e=0.5 orbit with a circular orbit having the same semi-major axis.

For a population of planets having a specific Rayleigh distribution of eccentricities, the average transit probability at a given semi-major axis is increased by a factor

where the normalization factor, N, is given by

For e_av=0.25, this boosts the total population of planets by about 10% over what one would infer from the standard 1/a circular orbit scaling.

